My chart for ICAEW this week illustrates how Ireland has displaced Luxembourg in contributing the most to the EU Budget on a per capita basis.
The European Union’s Budget for the 2024 calendar year amounts to €143bn, with national governments contributing €137bn and EU institutions generating the balance of €6bn. At a current exchange rate of £1:€1.17 this is equivalent to a budget of £122bn comprising national contributions of £117bn and other income of £5bn.
My chart illustrates how much national governments contribute to the EU budget on a per capita basis, ranging from Ireland contributing the most to Bulgaria the least. Ireland’s recent economic success has seen it overtake Luxembourg as the country with the highest GDP per capita, and hence the highest per capita contributor to the EU Budget.
The average contribution for the EU’s population works out at just over €302 (£258) per person per year or €25.20 (£21.50) per person per month, based on a total population of 453m living in the 27 EU member countries.
The chart shows how Ireland’s contributions are equivalent to €53.20 per person per month, followed by Luxembourg on €50.70, Belgium on €44.10, Netherlands on €39.00, Denmark on €37.80, Finland on €31.30, Germany on €29.70, Slovenia on €28.90, France on €28.60, Austria on €28.50, Sweden on €25.20, Italy on €24.40, Malta on €23.20, Spain on €21.80, Estonia on €21.70, Cyprus on €20.70, Czechia on €20.30, Lithuania on €20.00, Portugal on €17.80, Latvia on €16.90, Hungary on €16.20, Poland on €15.70, Greece on €15.40, Slovakia on €15.00, Croatia on €13.10, Romania on €12.00, and Bulgaria on €10.50.
Total contributions of €137bn amount to approximately 0.8% of the EU’s gross national income of €17.7trn. They comprise €25bn from 75% of customs duties and sugar sector levies, a €24bn share of VAT receipts, €7bn based on plastic packaging that is not recycled (providing countries with an economic incentive to reduce it), and €82bn calculated as a proportion of gross national income.
While the UK ‘rebate’ no longer exists, these numbers in the chart are net of the equivalent but proportionately smaller ‘rebate’ totalling €9bn that continues to go to Germany, Netherlands, Sweden, Austria and Denmark. The EU Commission had proposed removing it during the negotiations for the 2021 to 2027 multi-year financial framework but was unsuccessful in persuading these five countries to give it up.
The chart only shows the gross contributions paid by national governments – it doesn’t show the amount that comes back to each country through EU spending, whether in the form of economic development funding and agricultural subsidies, through science, technology, educational or other programmes, or through the economic benefits of hosting EU institutions. This will reduce the effective net contribution for most of the richer nations, while poorer member states will benefit by more coming from the EU than they are paying in.
The numbers also do not include €113bn (£97bn) of spending through the NextGenerationEU programme that is funded by direct borrowing by the EU. This is equivalent to additional spending of €20.80 per person per month that will need to be repaid over the next few decades – hopefully through the benefits of higher economic growth.
Year-to-date deficit of £119bn is £5bn lower than latest Office for Budget Responsibility forecast – but is still £11bn worse than this time last year.
Public sector finances for December 2023, released by the Office for National Statistics (ONS) on Tuesday, reported a provisional deficit of £8bn – less than expected – while at the same time revising the year-to-date deficit down by £5bn. This brought the cumulative deficit for the first three-quarters of the financial year to £119bn, £11bn more than in the same nine-month period last year.
Alison Ring OBE FCA, ICAEW Director for Public Sector and Taxation, comments: “Today’s numbers show a cumulative deficit of £119bn for the first three-quarters of the financial year, the fourth highest on record. This should be close to the total at the end of the tax year, as income from self-assessment tax receipts in January is likely to offset deficits in February and March. At £5bn less than the Office for Budget Responsibility’s latest forecast, the Chancellor will be pleased by this marginal improvement in fiscal headroom just when he needs it most.
“However, the Chancellor will still be concerned by the tough economic landscape, with disappointing retail sales data for the final quarter of 2023 and an unexpected rise in inflation last month, and what that might mean for the fiscal forecasts. He is under significant pressure to cut taxes ahead of the general election, but will be all too aware of the need for greater investment in public services and infrastructure if he is to be able to lay the foundations for economic growth in the next Parliament. The risk of local authorities going bust will also be on his mind as he seeks to generate positive economic vibes going into the general election campaign.”
Month of December 2023
The provisional shortfall in taxes and other receipts compared with total managed expenditure for the month of December 2023 was £8bn, made up of tax and other receipts of £89bn less total managed expenditure of £97bn, up 6% and down 3% respectively compared with December 2022.
This was the lowest December deficit since 2019, principally because interest on Retail Prices Index-linked debt fell from £14bn in December 2022 to close to zero in December 2023.
Public sector net debt as at 31 December 2023 was £2,686bn or 97.7% of GDP, up £15bn during the month and £146bn higher than at the start of the financial year.
Nine months to December 2023
The provisional shortfall in taxes and other receipts compared with total managed expenditure for the first three quarters of the financial year to December 2023 was £119bn, £11bn more than the £108bn deficit reported for the first nine months of 2022/23.
This reflected a year-to-date shortfall between tax and other receipts of £776bn and total managed expenditure of £895bn, both up 6% compared with April to December 2022.
Inflation benefitted tax receipts for the first nine months compared with the same period in the previous year, with income tax up 10% to £178bn and VAT up 7% to £150bn. Corporation tax receipts were up 18% to £76bn, partly reflecting the increase in the corporation tax rate from 19% to 25% from 1 April 2023, while national insurance receipts were up by just 1% to £132bn as the abolition of the short-lived health and social care levy in 2022/23 offset the effect of wage increases in the current financial year.
Council tax receipts were up 6% to £33bn, but stamp duty on properties was down by 27% to £10bn and the total for all other taxes was down by 3% to £112bn as economic activity slowed. Non-tax receipts were up 11% to £84bn, primarily driven by higher investment income and higher interest receivable on student loans.
Total managed expenditure of £895bn in the nine months to December 2023 can be analysed between current expenditure excluding interest of £761bn, interest of £97bn and net investment of £37bn, compared with £841bn in the same period in the previous year, comprising £722bn, £103bn and £16bn respectively.
The increase of £39bn or 5% in current expenditure excluding interest was driven by a £24bn increase in pension and other welfare benefits (including cost-of-living payments), £15bn in higher central government pay and £8bn in additional central government procurement spending, less £6bn in lower subsidy payments (principally relating to energy support schemes) and £2bn in net other changes.
The fall in interest costs for the nine months of £6bn to £97bn comprises an £18bn or 39% fall to £28bn for interest accrued on index-linked debt from a lower rate of inflation, partially offset by a £12bn or 21% increase to £69bn for interest not linked to inflation from higher interest rates.
The £21bn increase in net investment spending to £37bn in the first nine months of the current year is distorted by a one-off credit of £10bn arising from changes in interest rates and repayment terms of student loans recorded in December 2022. Adjusting for that credit, the increase of £11bn or 42% reflects high construction cost inflation, among other factors, which saw a £14bn or 20% increase in gross investment to £85bn, less a £3bn or 7% increase in depreciation to £48bn.
Public sector finance trends: December 2023
The cumulative deficit of £119bn for the first three-quarters of the financial year is £5bn below the Office for Budget Responsibility (OBR)’s November 2023 forecast of £124bn for the nine months to December 2023. The OBR is also forecasting a full year forecast of £124bn as it expects self-assessment tax receipts in January to offset projected deficits in February and March 2024.
Balance sheet metrics
Public sector net debt was £2,686bn at the end of December 2023, equivalent to 97.7% of GDP.
The debt movement since the start of the financial year is £146bn, comprising borrowing to fund the deficit for the nine months of £119bn plus £27bn in net cash outflows to fund lending to students, businesses and others, net of loan repayments and working capital movements.
Public sector net debt is £871bn more than the £1,815bn reported for 31 March 2020 at the start of the pandemic and £2,330bn more than the £538bn number as of 31 March 2007 before the financial crisis, reflecting the huge sums borrowed over the last couple of decades.
Public sector net worth, the new balance sheet metric launched by the ONS this year, was -£715bn on 31 December 2023, comprising £1,584bn in non-financial assets and £1,049bn in non-liquid financial assets minus £2,686bn of net debt (£296bn liquid financial assets – £2,982bn public sector gross debt) and other liabilities of £662bn. This is a £100bn deterioration from the -£615bn reported for 31 March 2023.
Revisions
Caution is needed with respect to the numbers published by the ONS, which are expected to be repeatedly revised as estimates are refined and gaps in the underlying data are filled.
The latest release saw the ONS revise the reported deficit for the eight months to November 2023 down by £5bn from £116bn to £111bn as estimates of tax receipts and expenditure were updated for better data, while the debt to GDP ratio at the end of November 2023 was revised down by 0.1 percentage points from 97.5% to 97.4%.
The ONS also revised its estimate for the deficit for the financial year to March 2023, down by £1bn to £130bn for 2022/23.
The section in which Martin was quoted reads as follows:
Martin Wheatcroft FCA, an external adviser on public finances to ICAEW, says it is not just badly run councils – that either speculated and lost or mismanaged funds – that now face the distinct possibility of financial failure: “Many ‘normal’ local authorities are now looking vulnerable too, as they struggle to balance their budgets in the face of rising demand, rising costs and constrained funding.”
In particular, Wheatcroft says adult social care is a significant challenge for many local authorities, as an ageing population sees demand increasing each year as the number of pensioners grows. Meanwhile, the knock-on impact of the minimum wage increase of 9.8% from April will further add to the challenges facing councils in the coming financial year.
“With local authority core funding only going up 6.5% in the coming financial year, local authorities are having to look for further cuts in other already ‘cut to the bone’ public services to try and balance their books,” Wheatcroft adds.
Last month, the Department for Levelling Up, Housing and Communities released a call for views on greater capital flexibilities that would allow councils to either use capital receipts to fund operational expenditure or to treat some operational expenditure as if it were capital, without the requirement to approach the government.
The intention is to encourage local authorities to invest in ways that reduce the cost of service delivery and provide more local levers to manage financial resources. The consultation is open until the end of January.
Under the current rules, councils are restricted from using money received from asset sales or from borrowing to fund operating costs due to capital receipts being considered a ‘one-off‘, while borrowing creates a liability that has to be repaid.
Wheatcroft adds: “The government’s announcement of greater capital flexibilities may help stave off some of the problems for a while but is likely to further weaken local authority balance sheets in doing so.”
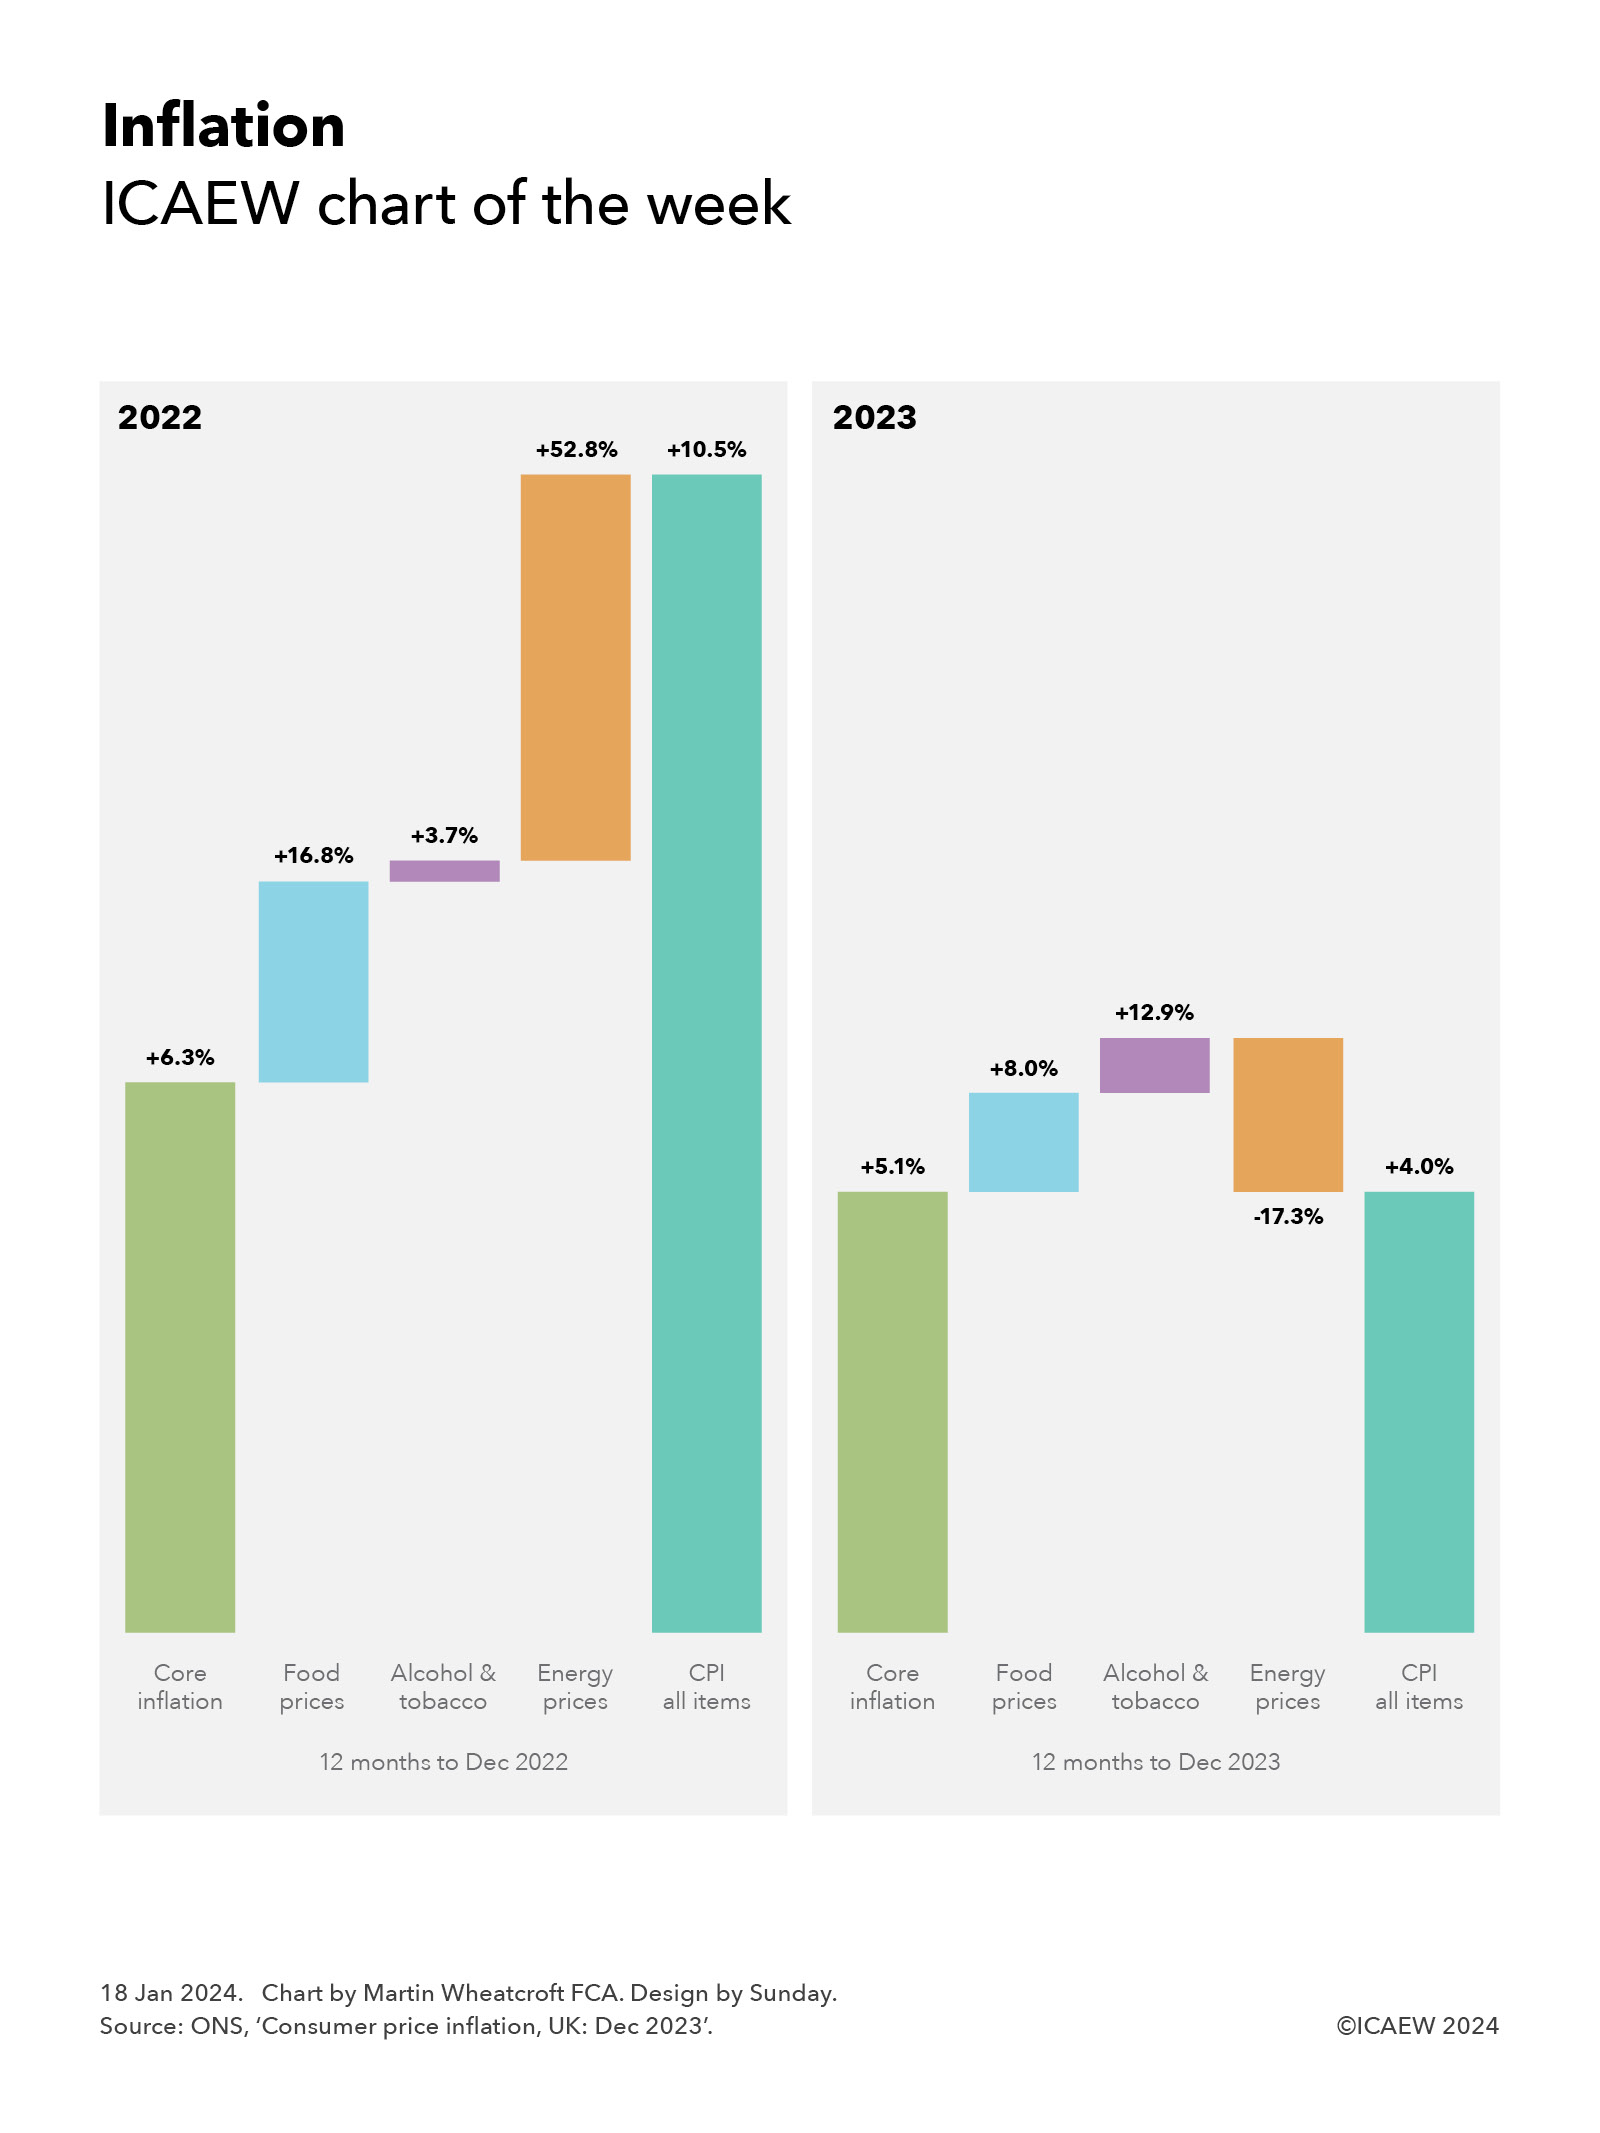
My chart for ICAEW this week illustrates how core inflation has only dropped from 6.3% in December 2022 to 5.1% in December 2023, even as the headline rate has come down from 10.5% to 4.0%.
On 17 January 2023, the Office for National Statistics (ONS) published its latest consumer price inflation (CPI) statistics for the 12 months to December 2023, reporting that headline inflation has fallen to an annual rate of 4.0% compared with 10.5% a year earlier – a more than halving of the annual rate of price growth.
This contrasts with CPI excluding energy, food, alcohol and tobacco (typically described as core inflation), which was 6.3% and 5.1% in the 12 months to December 2022 and 2023 respectively.
The left-hand side of my chart this week illustrates how core inflation in the 12 months to December 2022 of 6.3% contributed just under 5.0% to the weighted average total inflation rate of 10.5%, with food prices up 16.8%, alcohol and tobacco up 3.7%, and energy prices up 52.8% contributing a further 1.8%, 0.2% and 3.5% respectively.
The right-hand side shows the 12 months to December 2023, where core inflation of 5.1%, food price inflation of 8.0%, alcohol and tobacco inflation of 12.9%, and a fall in energy prices of 17.3% contributed approximately 4.0%, 0.9%, 0.5% and -1.4% respectively to the weighted average total rate of consumer price inflation of 4.0%
The relative weightings may explain why many people feel that inflation is still running faster than the headline rate. Food prices, up 8.0% in the past 12 months, have increased twice as fast as CPI of 4.0%, while alcohol (up 9.6%) and tobacco (up 16.0%) have gone up by even more. These may have been offset by energy prices coming down by 17.3% over the past 12 months, but this may not be perceived as that beneficial given how energy is still significantly more expensive than it was before the cost-of-living crisis started.
For policymakers, the bigger concern will be the stickiness in core inflation, which remains stubbornly higher than the Bank of England’s target for overall CPI of 2.0%. While the expectation is that both core and headline rates will come down further during the course of 2024, the Bank is likely to remain cautious about declaring victory in the fight against inflation despite worries about the effects of high interest rates on the struggling economy.
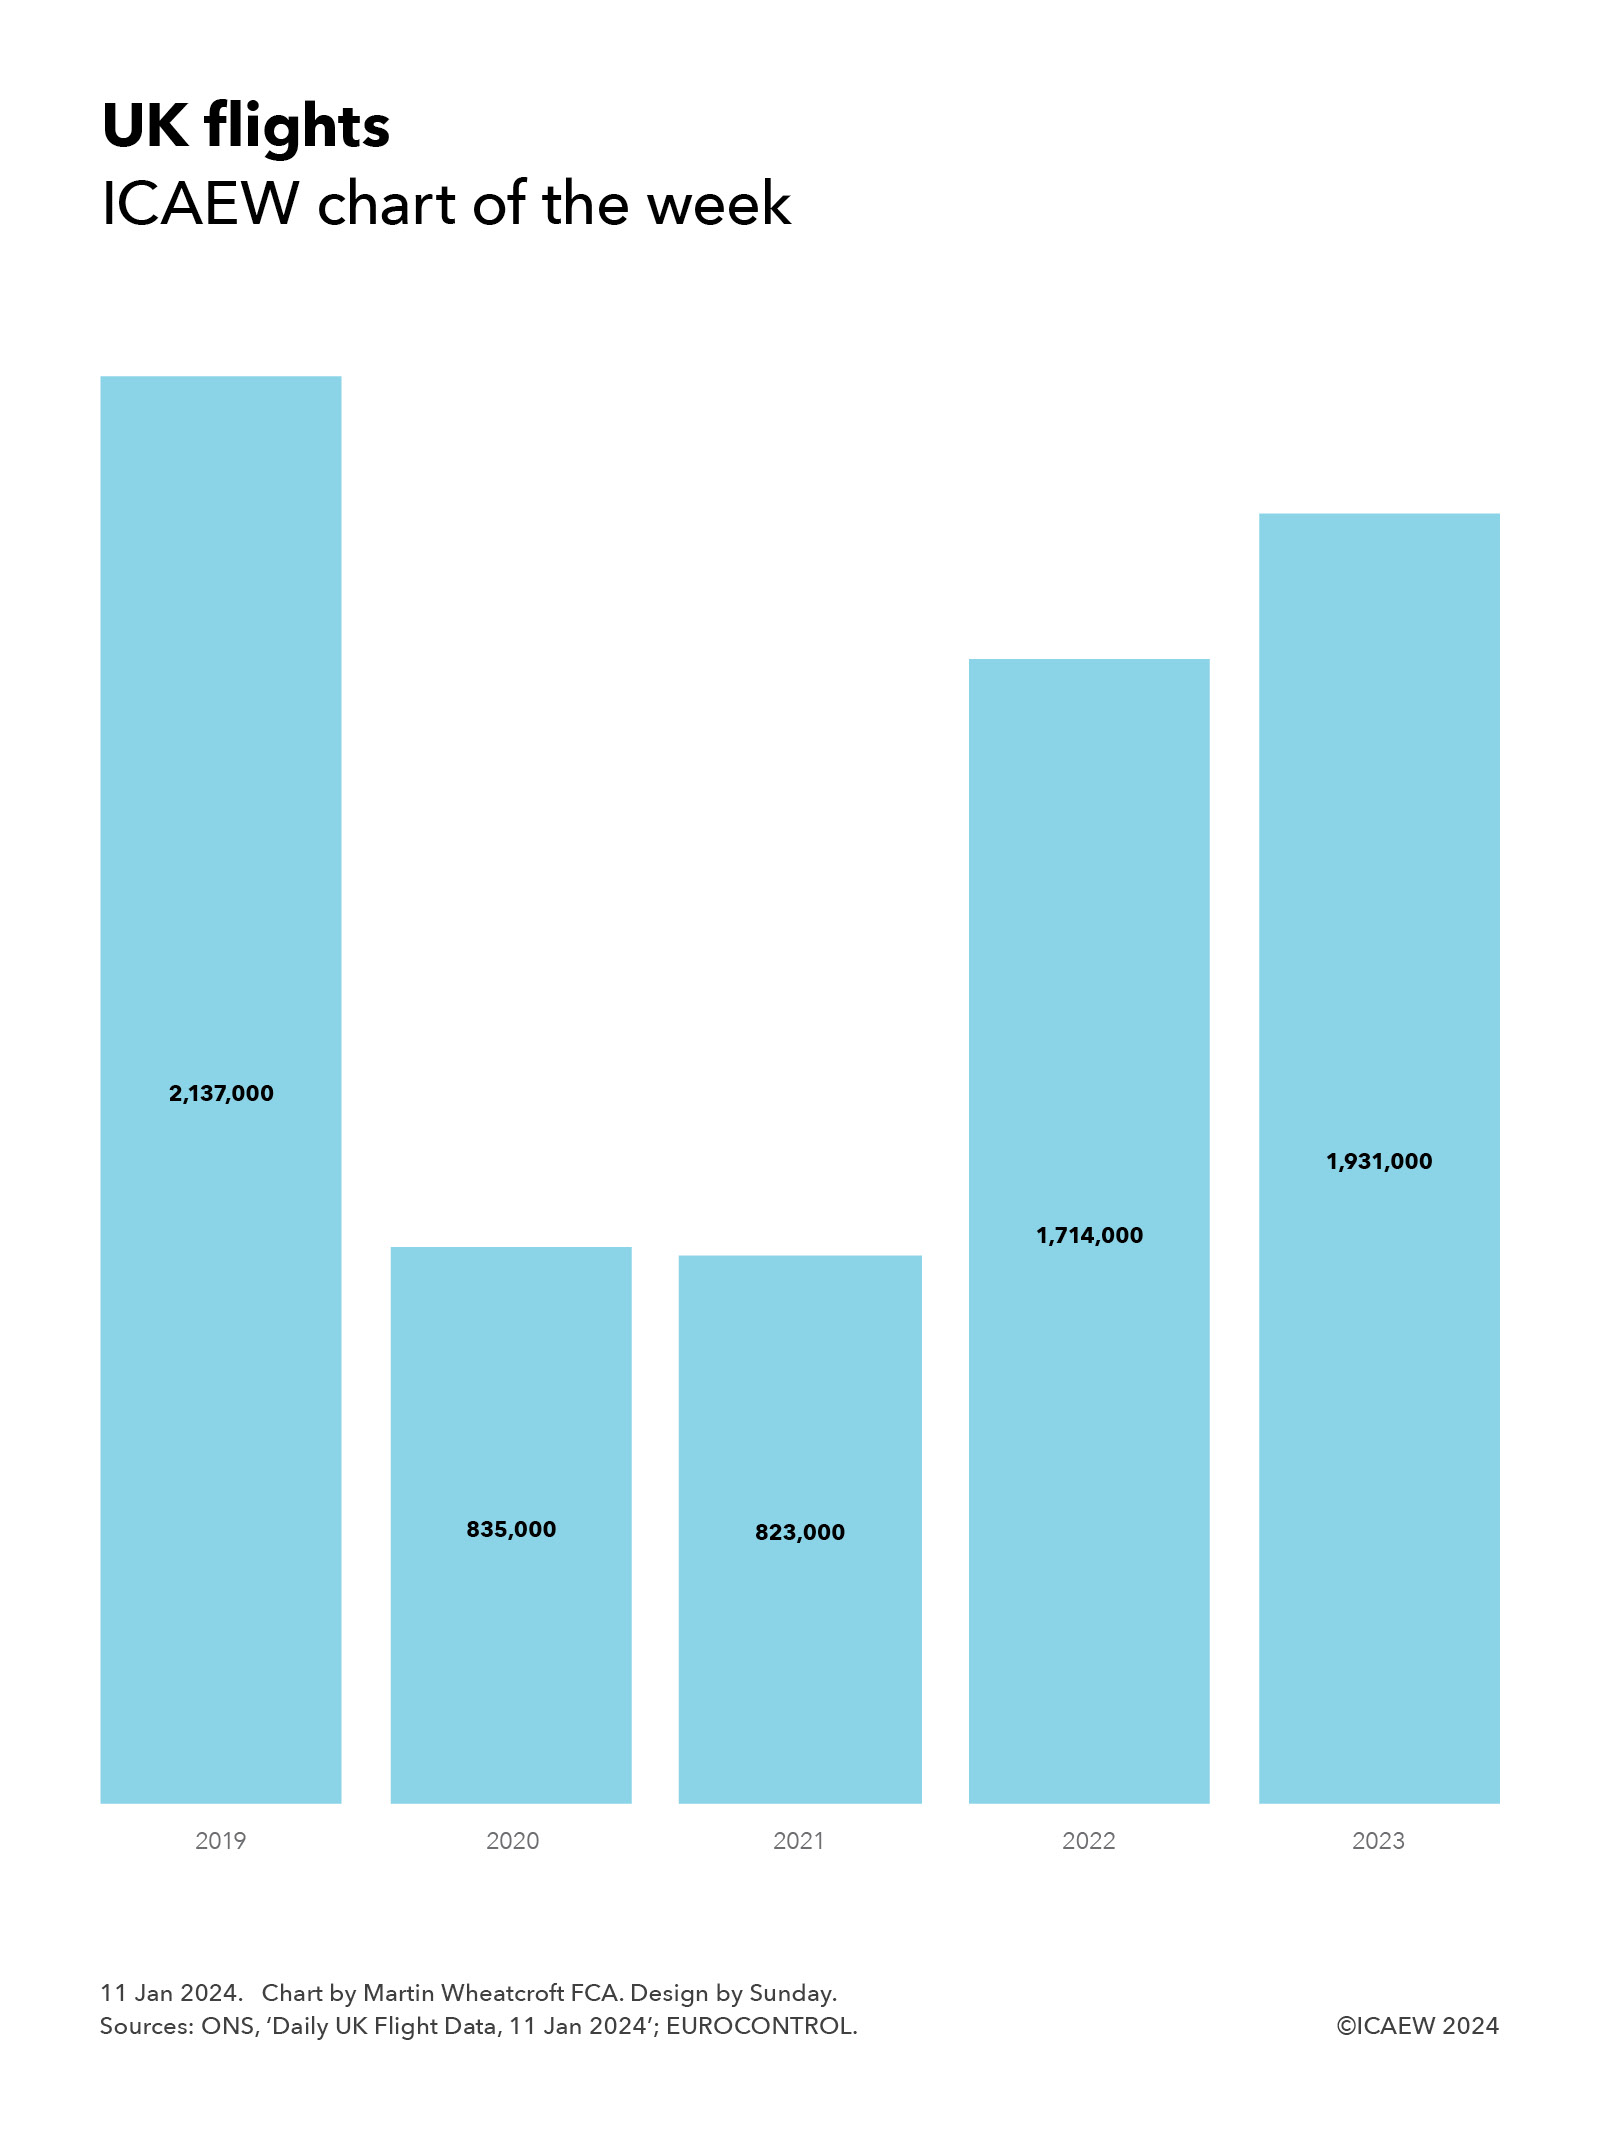
My chart for ICAEW this week illustrates how the number of flights to and from UK airports has not fully recovered since the pandemic.
Our chart this week looks at how the number of flights departing and arriving from UK airports (including internal flights) has changed over the past five years.
According to numbers published by the Office for National Statistics (ONS) – based on data from EUROCONTROL – there were approximately 2,137,000 flights in 2019, 835,000 in 2020, 823,000 in 2021, 1,714,000 in 2022 and 1,931,000 in 2023.
This was equivalent to daily averages of 5,870, 2,282, 2,254, 4,695 and 5,290 in 2019, 2020, 2021, 2022 and 2023 respectively.
Despite reports that consumer demand for air travel has recovered to (or potentially even exceeded) pre-pandemic levels, the number of flights in 2023 was only 90% of that seen in 2019. This is believed to reflect changing travel patterns among business travellers, where video conferencing, corporate carbon reduction targets and cost-saving initiatives are all thought to have contributed to a significant reduction in business trips compared with pre-pandemic times.
For the airline industry, the loss of businesses paying higher prices for flexible bookings has been a key challenge that has caused airlines to focus on improving passenger load factors (ie, seat utilisation), promoting premium tickets to leisure travellers and, in some cases, rebalancing towards the budget carrier market.
With the number of flights in the second half of 2023 around 9% more than in 2022, the industry will be hoping for further growth in demand during 2024.
My chart for ICAEW this week looks at how the pound appreciated in value against the euro, US dollar, yuan and yen respectively during 2023.
My first chart of the week of 2024 for ICAEW looks back at 2023 and how sterling strengthened against the euro, US dollar, yuan and yen – the currencies of the four largest economies in the world – based on exchange rates reported by the Bank of England.
The smallest increase was against the principal currency of the European Union, our largest trading partner, with the sterling to euro exchange rate up by just over 2% from £1:00:€1.128 to £1.00:€1.154 between 30 December 2022 and 29 December 2023.
This contrasted with a 6% rise in sterling against the US dollar during 2023 from £1.00:$1.204 at the end of 2022 to £1.00:$1.275 at the end of 2023, a 9% rise against the Chinese yuan renminbi from £1.00:¥8.31 to £1.00: ¥9.08. Sterling increased, and a 13% increase against the Japanese yen from £1.00:¥159 to £1.00:¥180.
Exchange rate movements can be attributed to multiple factors, including relative rates of inflation and economic growth, interest rates, trade and investment flows, and fiscal credibility among others – both actuals and sentiment about prospects for the future. In sterling’s case, expectations that interest rates in the UK are likely to stay higher for longer than in other major economies is a key contributor to the rise in sterling over 2023, although this is only part of the story.
While sterling has appreciated over the last year against these and many other currencies, the pound is still much lower in value than 10 years ago, being down 4% against the euro compared with £1.00:€1.200 at the end of 2013, down 23% against the US dollar from £1.00:$1.653, and down 9% against the Chinese yuan from £1.00:¥10.01. The exception is the Japanese yen, where the rise this year has more than offset falls over the previous decade to leave sterling 4% higher against the yen than the exchange rate £1.00:¥173 on 31 December 2013.
The Levelling Up, Housing and Communities Committee has delivered a landmark report that will transform local authority financial statements, says ICAEW’s Alison Ring.
While the focus for many of us at the moment is on a rather depressing English roulette game of guessing which local authority will be the next to issue a section 114 ‘bankruptcy’ notice, you may be forgiven for having missed the landmark nature of the House of Commons Levelling Up, Housing and Communities Committee report ‘Financial Reporting and Audit in Local Authorities’.
Admirably concise (for such reports) at 45 pages, the report has quite rightly attracted headlines for the elements focused on the local audit crisis in England – and the increasingly urgent actions that are needed to resolve it. We at ICAEW are equally frustrated at the slow pace of the response and continue to urge the government to prioritise getting local authority audits back on track as quickly as possible.
So far, so expected. The Committee adds to the chorus of voices already calling for the government to address and reduce the backlog of audited accounts, as well as to take action in the longer term to prevent backlogs from happening again. The report highlights delays in putting the new system leader for local audit onto a statutory basis and calls for enabling legislation to be brought forward as soon as possible.
What makes this report so important is that it has not stopped there, instead going under the hood of the local authority financial reporting and audit system to come up with transformational recommendations on how local authority accounts can be improved to properly support democracy and accountability in a way that they aren’t doing now.
Fundamental weaknesses
The principal focus of the report is on addressing: “… fundamental weaknesses in the accounts themselves that are hampering the efforts of members of the public and other stakeholders to use them in holding local authorities to account”.
The Committee highlights the impenetrability of local authority financial statements as being a core issue, commenting that stakeholders who might want to use the information in the accounts encounter significant challenges in finding and understanding the information they need. As a result, many stakeholders do not use the accounts at all. Local authority accounts and audit are therefore not adequately fulfilling their role in supporting local democracy and accountability.
The Committee also quotes Rob Whiteman, Chief Executive of the Chartered Institute of Public Finance and Accountancy (CIPFA), who commented in his evidence to the inquiry that if people do not understand the accounts, they may also believe the accounts to be opaque and untrustworthy. My boss Iain Wright, Managing Director for Reputation and Influence at ICAEW, also gave evidence to the inquiry in which he stated that council taxpayers want to know how their money is being spent, and ultimately local authority accounts are the best way of being able to distil that.
Five purposes of accounts
One of the key issues identified by the Committee is a lack of clarity around the purpose of accounts, with the report quoting evidence from Alison Scott, Shared Director of Finance for Three Rivers District Council and Watford Borough Council, who stated: “At the moment, the statement of accounts tries to be all things to all people and, in doing that, gains lots of complexity. It almost loses its focus as to who it is supposed to be being produced for and who its focus is on.”
The Committee answers that by setting out five purposes that it believes accounts should fulfil to adequately support local democracy and accountability:
To be a credible public record.
Provide accountability for spending.
Enable conclusions to be reached on value for money.
Provide information to run local authorities.
Alert stakeholders of actual and potential issues.
The Committee believes these purposes will ultimately focus local authority accounts on their role as vital tools for upholding local democracy and accountability.
ICAEW concurs in the need for clarity around the purposes of the accounts and believes these proposals will provide much needed clarity to government, standard setters, preparers and regulators in how financial statements should be designed and presented. A new foundation that will be critical in helping users understand what is going on so that stakeholders can read and use the accounts to hold local authorities to account.
The Committee makes some specific recommendations to align local authority accounts with the five purposes, including introducing a standardised statement of service information and costs (as recommended by the Redmond Review); decoupling pension statements from the accounts; ensuring that auditors consider and conclude on the value for money achieved by local authorities; and encouraging more consistent use of auditors’ existing powers to sound early warnings. It also called for the government to work with CIPFA to make the Accounting Code freely available to all possible users.
A much more significant recommendation is the Committee’s call for the Department of Levelling Up, Housing and Communities to undertake an immediate review into existing legislation that places requirements on the contents and format of local authority accounts (including statutory overrides), with a view to ensuring they align with the five purposes as set out above.
The report comments that not a single stakeholder, witness or piece of written evidence expressed to the inquiry that one of the purposes of the accounts was to provide a baseline for the council tax calculation. The Committee did not consider council tax setting to be one of the main purposes of the accounts, questioning whether this could be better done outside of the accounts as part of a separate process.
A landmark report
I believe this report marks a decisive turn in what local authority annual financial reports should look like and how they can be used much more effectively to hold local authorities to account, improve decision-making and governance, and ensure value for money provided by local and national taxpayers.
We can only hope that it will be as effective as the Public Administration and Constitutional Affairs Committee’s report ‘Accounting for Democracy’ was to making central government accounts much more accessible to parliamentarians and other users.
If I have one (or is that two?) quibble(s) it is that the report does not sufficiently emphasise the role of councillors in holding local authorities to account and the role of finance teams in helping them to do so effectively.
Despite that small caveat, this is a landmark report that sets a new direction for local authority accounts and audit to support local democracy and accountability. By establishing clarity around the purpose of accounts the Committee has provided a foundation on which the whole system can be rebuilt.
Alison Ring is Director Public Sector and Taxation, ICAEW.
Latest public sector finance numbers reveal a challenging fiscal backdrop for both government and opposition ahead of a general election.
The monthly public sector finances for November 2023 released by the Office for National Statistics (ONS) on Thursday 21 December 2023 reported a provisional deficit for the month of £14bn and revised the year-to-date deficit up by £4bn, bringing the cumulative deficit for the first two-thirds of the financial year to £116bn, £24bn more than in the same eight-month period last year.
Alison Ring OBE FCA, ICAEW Director for Public Sector and Taxation, said: “These numbers confirm that the government’s financial difficulties are continuing to mount, with the shortfall between income and public spending reaching an unsustainable £116bn for the first two-thirds of the financial year, surpassing the £100bn milestone and providing a challenging fiscal backdrop for both the government and the opposition ahead of a general election.
“While the Prime Minister and the Chancellor continue to search for cost savings to free up capacity for further pre-election tax cuts, the opposition will be concerned about the fiscal legacy it would inherit if it were to take power.
“The deteriorating state of the UK’s public services is a big concern for all politicians given that it implies a need for substantial tax rises after the general election, irrespective of who wins.”
Month of November 2023
The provisional shortfall in taxes and other receipts compared with total managed expenditure for the month of November 2023 was £14bn, made up of tax and other receipts of £86bn less total managed expenditure of £100bn, up 5% and 3% respectively compared with November 2022.
This was the fourth highest November deficit on record since monthly records began in 1997, following monthly deficits of £15bn, £22bn and £15bn in November 2010, 2020, and 2022 respectively.
Public sector net debt as of 30 November 2023 was £2,671bn or 97.5% of GDP, up £30bn during the month and £132bn higher than at the start of the financial year.
Eight months to November 2023
The provisional shortfall in taxes and other receipts compared with total managed expenditure for the first two thirds of the financial year to November 2023 was £116bn, £24bn more than the £92bn deficit reported for the first eight months of 2022/23. This reflected a year-to-date shortfall between tax and other receipts of £682bn and total managed expenditure of £798bn, up 5% and 8% respectively compared with April to November 2022.
Inflation benefited tax receipts for the first eight months compared with the same period in the previous year, with income tax up 10% to £156bn and VAT up 8% to £134bn. Corporation tax receipts were up 10% to £62bn, partly reflecting the increase in the corporation tax rate from 19% to 25% from 1 April 2023, while national insurance receipts were down by 3% to £114bn because of the abolition of the short-lived health and social care levy last year. Stamp duty on properties was down by 27% to £9bn and the total for all other taxes was up just 3% to £132bn, much less than inflation, as economic activity slowed. Non-tax receipts were up 11% to £75bn, primarily driven by higher investment income.
Total managed expenditure of £798bn in the eight months to November 2023 can be analysed between current expenditure excluding interest of £676bn, up £41bn or 6% over the same period in the previous year, interest of £90bn, up £7bn or 8%, and net investment of £32bn, up £10bn or 45%.
The increase of £41bn in current expenditure excluding interest was driven by a £21bn increase in pension and other welfare benefits (including cost-of-living payments), £14bn in higher central government pay and £7bn in additional central government procurement spending, less £1bn in net other changes.
The rise in interest costs for the eight months of £7bn to £90bn comprises a £20bn or 43% increase to £67bn for interest not linked to inflation as the Bank of England base rate rose, partially offset by an £13bn or 37% fall to £23bn for interest accrued on index-linked debt from lower inflation than last year.
The £10bn increase in net investment spending to £32bn in the first eight months of the current year reflects high construction cost inflation amongst other factors that saw a £13bn or 21% increase in gross investment to £75bn, less a £3bn or 8% increase in depreciation to £43bn.
The cumulative deficit of £116bn for the first two-thirds of the financial year is £8bn below the Office for Budget Responsibility (OBR)’s official forecast of £124bn for the full financial year as compiled in November 2023 for the Autumn Statement. The deficit for the last third of the financial year is normally much smaller than for the first two-thirds because of self assessment tax returns arriving in January that boost tax receipts.
Balance sheet metrics
Public sector net debt was £2,671bn at the end of November 2023, equivalent to 97.5% of GDP.
The debt movement since the start of the financial year was £131bn, comprising borrowing to fund the deficit for the eight months of £116bn plus £15bn in net cash outflows to fund lending to students, businesses and others net of loan repayments and working capital movements.
Public sector net debt is £856bn more than the £1,815bn reported for 31 March 2020 at the start of the pandemic and £2,133bn more than the £538bn number as of 31 March 2007 before the financial crisis, reflecting the huge sums borrowed over the last couple of decades.
Public sector net worth, the new balance sheet metric launched by the ONS this year, was -£715bn on 30 November 2023, comprising £1,565bn in non-financial assets and £1,054bn in non-liquid financial assets minus £2,671bn of net debt (£303bn liquid financial assets – £2,974bn public sector gross debt) and other liabilities of £663bn. This is a £100bn deterioration from the -£615bn reported for 31 March 2023.
Revisions
Caution is needed with respect to the numbers published by the ONS, which are expected to be repeatedly revised as estimates are refined and gaps in the underlying data are filled.
The latest release saw the ONS revise the reported deficit for the seven months to October 2023 up by £4bn from £98bn to £102bn as estimates of tax receipts and expenditure were updated for better data, while the debt to GDP ratio at the end of October 2023 was revised down by 1.2 percentage points from 97.8% to 96.6% as a consequence of updated estimates of GDP.
The ONS also revised up its estimates for the deficit for the financial years to March 2023 and 2022 respectively, by £3bn to £131bn for 2022/23 and by £2bn to £124bn for 2021/22.
My chart for ICAEW this week illustrates how the civil service has grown by 92,000 or 23% to 496,000 FTEs over the past five years.
The number of civil servants has increased by 92,000 or 23% from 404,000 full-time equivalents (FTEs) in September 2018 to 496,000 FTEs in September 2023, which may be surprising in the light of government rhetoric about cutting public spending.
As my chart for ICAEW this week illustrates, the size of the UK civil service has grown significantly over the past five years. FTEs in ministerial departments have grown by 38,000 or 21% from 179,000 to 217,000, in the Scottish and Welsh governments by 10,000 or 45% from 22,000 to 32,000, and in agencies and non-ministerial departments by 44,000 or 22% from 203,000 to 247,000.
The civil service is just one part of the public sector workforce, which has increased by 571,000 or 13% from 4,433,000 to 5,004,000 FTEs over the same period. 300,000 of the increase has been in the NHS (up 21% from 1,451,000 to 1,751,000 FTEs in September 2023), which after taking account of the 92,000 increase in the civil service means the rest of the public sector workforce (schools, police, army, local government and others) has grown by a relatively slower number of 179,000 or 7% from 2,578,000 to 2,757,000 over the same period.
The increases in the civil service reverse cuts in the austerity years that saw the civil service fall from 493,000 FTEs in September 2009 to 384,000 in June 2016, just before the Brexit referendum.
The UK’s departure from the EU Single Market and the EU Customs Union on 31 December 2020 has been a major driver in the increase, most prominently in the Home Office, which has grown by 15,000 from 29,000 to 44,000 FTEs. Machinery of government changes make it difficult to track the other impacts, but it is likely that another 20,000 of the increase is likely driven by Brexit, made up of small changes across Whitehall departments and individual agencies, such as the 80% increase in the size of the Rural Payments Agency (from 1,400 to 2,600),
The individual agency with the largest increase is HM Prisons and Probation Service, up 15,000 from 49,000 to 64,000 as the outsourced probation was re-absorbed back into the civil service.
The pandemic also had a small impact on the civil service (as opposed to the NHS) with the Department of Health and Social Security more than doubling in size from just under 1,500 FTEs in September 2018 to almost 3,200 in September 2023.
Some increases are more difficult to attribute, such as the 30% increase in the size of the National Crime Agency from 4,200 to 5,500 or the 9% increase in the size of HM Revenue and Customs from 57,100 to 62,000. Brexit is likely to be part of the story following the reversion of responsibilities from Brussels to London, but the growth of cybercrime (for example) in the past few years will also have been a factor.
The civil service numbers reported by the Office for National Statistics exclude civil servants working for the Northern Ireland Executive and its agencies, but do include both the Scottish and Welsh governments. Most of the growth in numbers from 22,000 to 32,000 has been in Scotland as more powers have been devolved to its devolved administration, with the 16,800 FTEs in September 2018 growing by 9,700 or 58% to 26,500 in September 2023. The size of the civil service in Wales has gone up by a much more modest 700 or 13% from 5,200 to 5,900 in the same period.
One possible driver for some of the other increases is that cuts in the civil service made during the austerity years were never sustainable in the longer-term, with the demands that drove those numbers never having gone away. Another is that governments tend to want to “get things done” and there is therefore a need to find people to do them.
Both of these factors may explain why both government departments and agencies have grown in size over the past half a decade.
While the civil service is less than 10% of the public sector workforce, it is often the first place that the government looks when it wants to find cost savings – and the current government is no different in seeking to cut the size of the civil service again. Whether those costs savings are sustainable in the long-term without more fundamental reform is another matter.
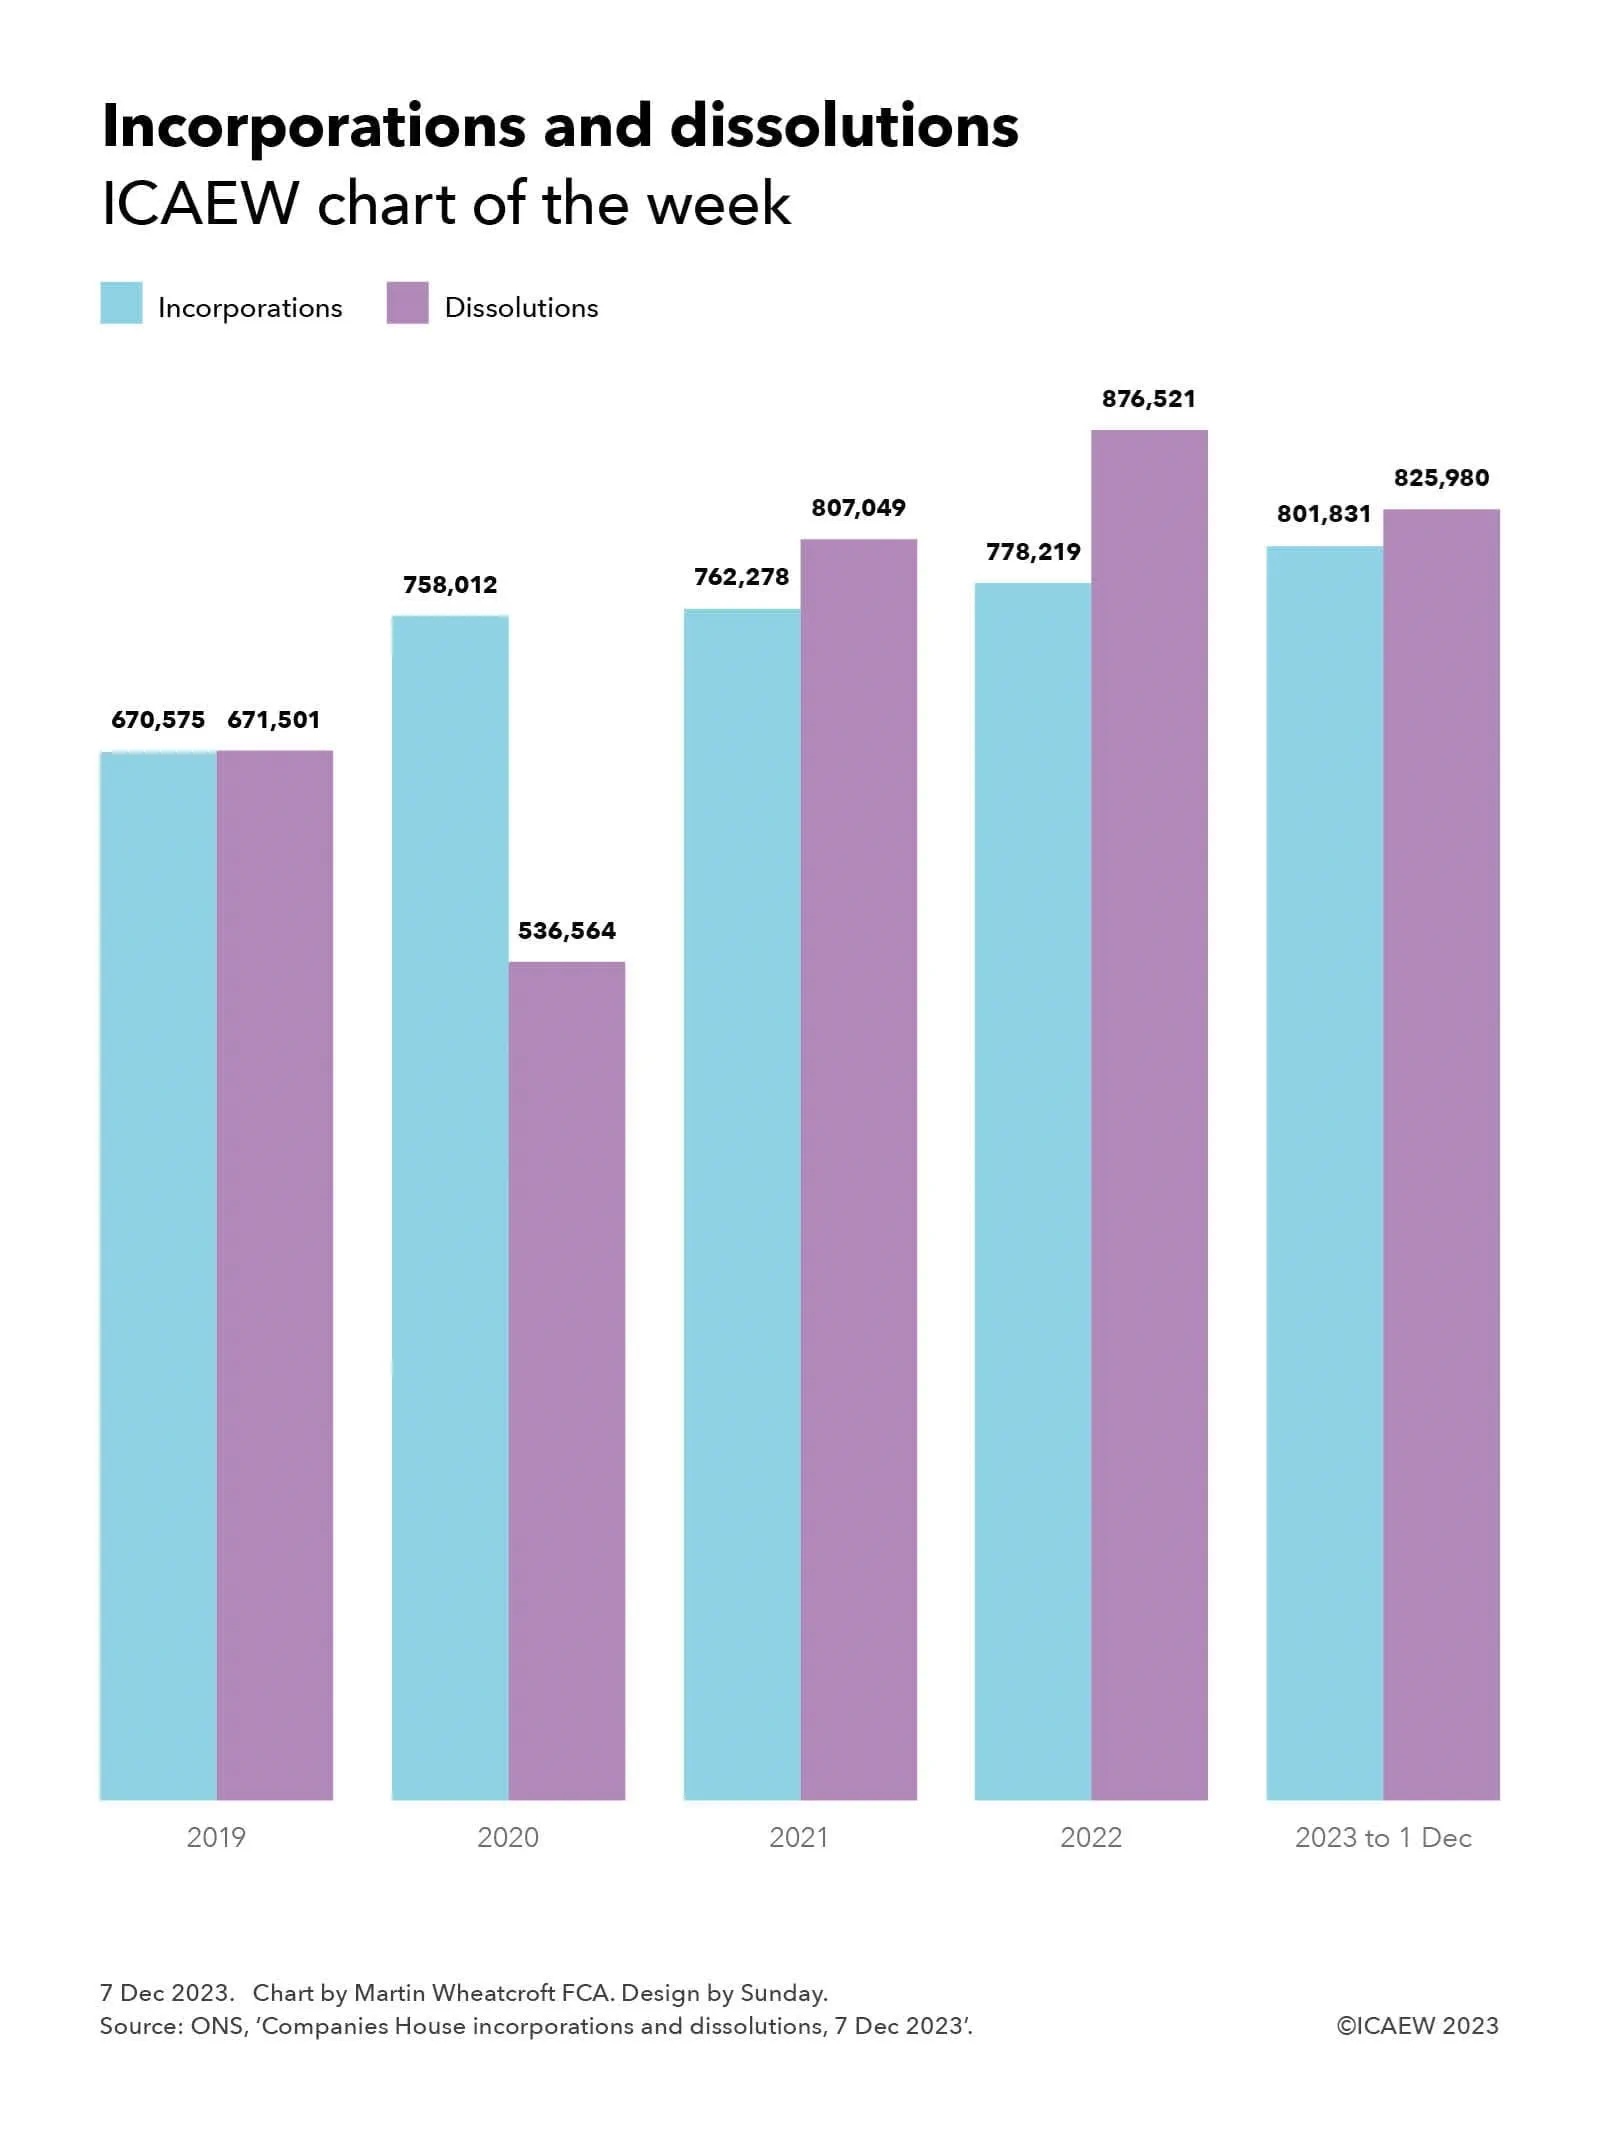
My chart for ICAEW this week illustrates how company dissolutions continue to outpace incorporations as the economy remains in first gear.
A key indicator for the health of the economy is the comparison between how many companies are created each year and the number that are dissolved, and our chart this week illustrates how these compare over the last four years up until 1 December 2023.
In 2019 there were 670,575 company incorporations and 671,501 dissolutions (391,066 compulsorily and 280,435 voluntarily), a net contraction in the number of companies of 926, consistent with the rather tepid economy we were experiencing in the year before the pandemic.
The numbers for 2020 were distorted by the pandemic, with incorporations rising to 758,012 and dissolutions falling to 536,564 (275,933 compulsorily and 260,631 voluntarily) – a net increase of 221,448. The rise in incorporations was no doubt contributed to by people deciding to start new businesses during lockdown, although bulk incorporations may also have been a factor. The significant fall in companies dissolved in 2020 compared with the previous year reflects government support on offer during the pandemic that propped up many companies that would otherwise have failed during 2020.
Incorporations rose further to 762,278 in 2021 and 778,219 in 2022, but these gains were more than offset by a sharp rise in dissolutions, which jumped to 807,049 (508,448 compulsorily and 289,604 voluntarily) in 2021 and 876,521 (572,646 compulsorily and 304,875 voluntarily) in 2022 as government support was withdrawn and reality caught up with many companies. Extremely high energy costs and high inflation were key factors in the demise of many businesses over this period. The net decrease in the number of companies was 44,771 in 2021 and 98,202 in 2022.
The number of companies incorporated during the first 11 months of 2023 was 801,831, a 9% rise on the equivalent period last year, while 825,980 companies were dissolved (539,643 compulsorily and 286,337 voluntarily), a rise of less than 1%. This has narrowed the gap to a contraction of 24,149 companies in the first 11 months of 2023.
While these numbers may be accurate to the nearest digit (unlike most sample-based statistics), their meaning for the economy is much less precise. Many companies are incorporated but never go on to trade, while some incorporations are merely a corporate wrapper around an existing business, or with personal service companies they can be a conversion of economic activity from one legal form to another. Unfortunately, companies are also sometimes incorporated for fraudulent purposes. Similarly, companies are wound up for a range of reasons and not just because they are all the consequence of failing businesses.
Despite that, they do provide a helpful indicator on what is going on with the economy, as the ‘cycle of business life’ is played out. For example, in theory it should be positive that even after a post-pandemic ‘shakeout’ the total number of companies over the period from 2019 to 1 December 2023 has grown by 53,300.
This may also be a statistic worth watching in 2024 as Companies House uses its new powers to weed out companies in the register. Just how significant will the introduction of new verification procedures and more active enforcement activity be to numbers of companies being incorporated and dissolved each year?

![Table showing fiscal numbers for the nine months to Dec 2019, 2020, 2021, 2022 and 2023.
Receipts: 597 | 560 | 653 | 733 | 776
Expenditure: (588) | (746) | (686) | (722) | (761)
Interest: (44) | (33) | (55) | (103) | (97)
Net investment: (26) | (51) | (35) | (16) | (37)
[subtotal] Deficit: (61) | (270) | (123) | (108) | (119)
Other borrowing: 3 | (67) | (85) | (8) | (27)
[total] Debt movement: (58) | (337) | (208) | (116) | (146)
Net debt: 1,835 | 2,152 | 2,360 | 2,497 | 2,686
Net debt / GDP: 84.8% | 98.7% | 97.9% | 95.8% | 97.7%](https://martinwheatcroft.com/wp-content/uploads/2024/02/Public-sector-finance-trends-2023-12.jpg)