As 2021 draws to a close, our chart this week looks back on a rocky couple of years for UK international trade which has endured Brexit complications and the global COVID-19 pandemic.
Our chart of the week illustrates how Brexit and COVID-19 have combined to create a rocky couple of years for UK exports and imports of goods and services, reflecting the trials and tribulations of the Brexit process as well as the impact of the coronavirus pandemic on trade since the first lockdown last year.
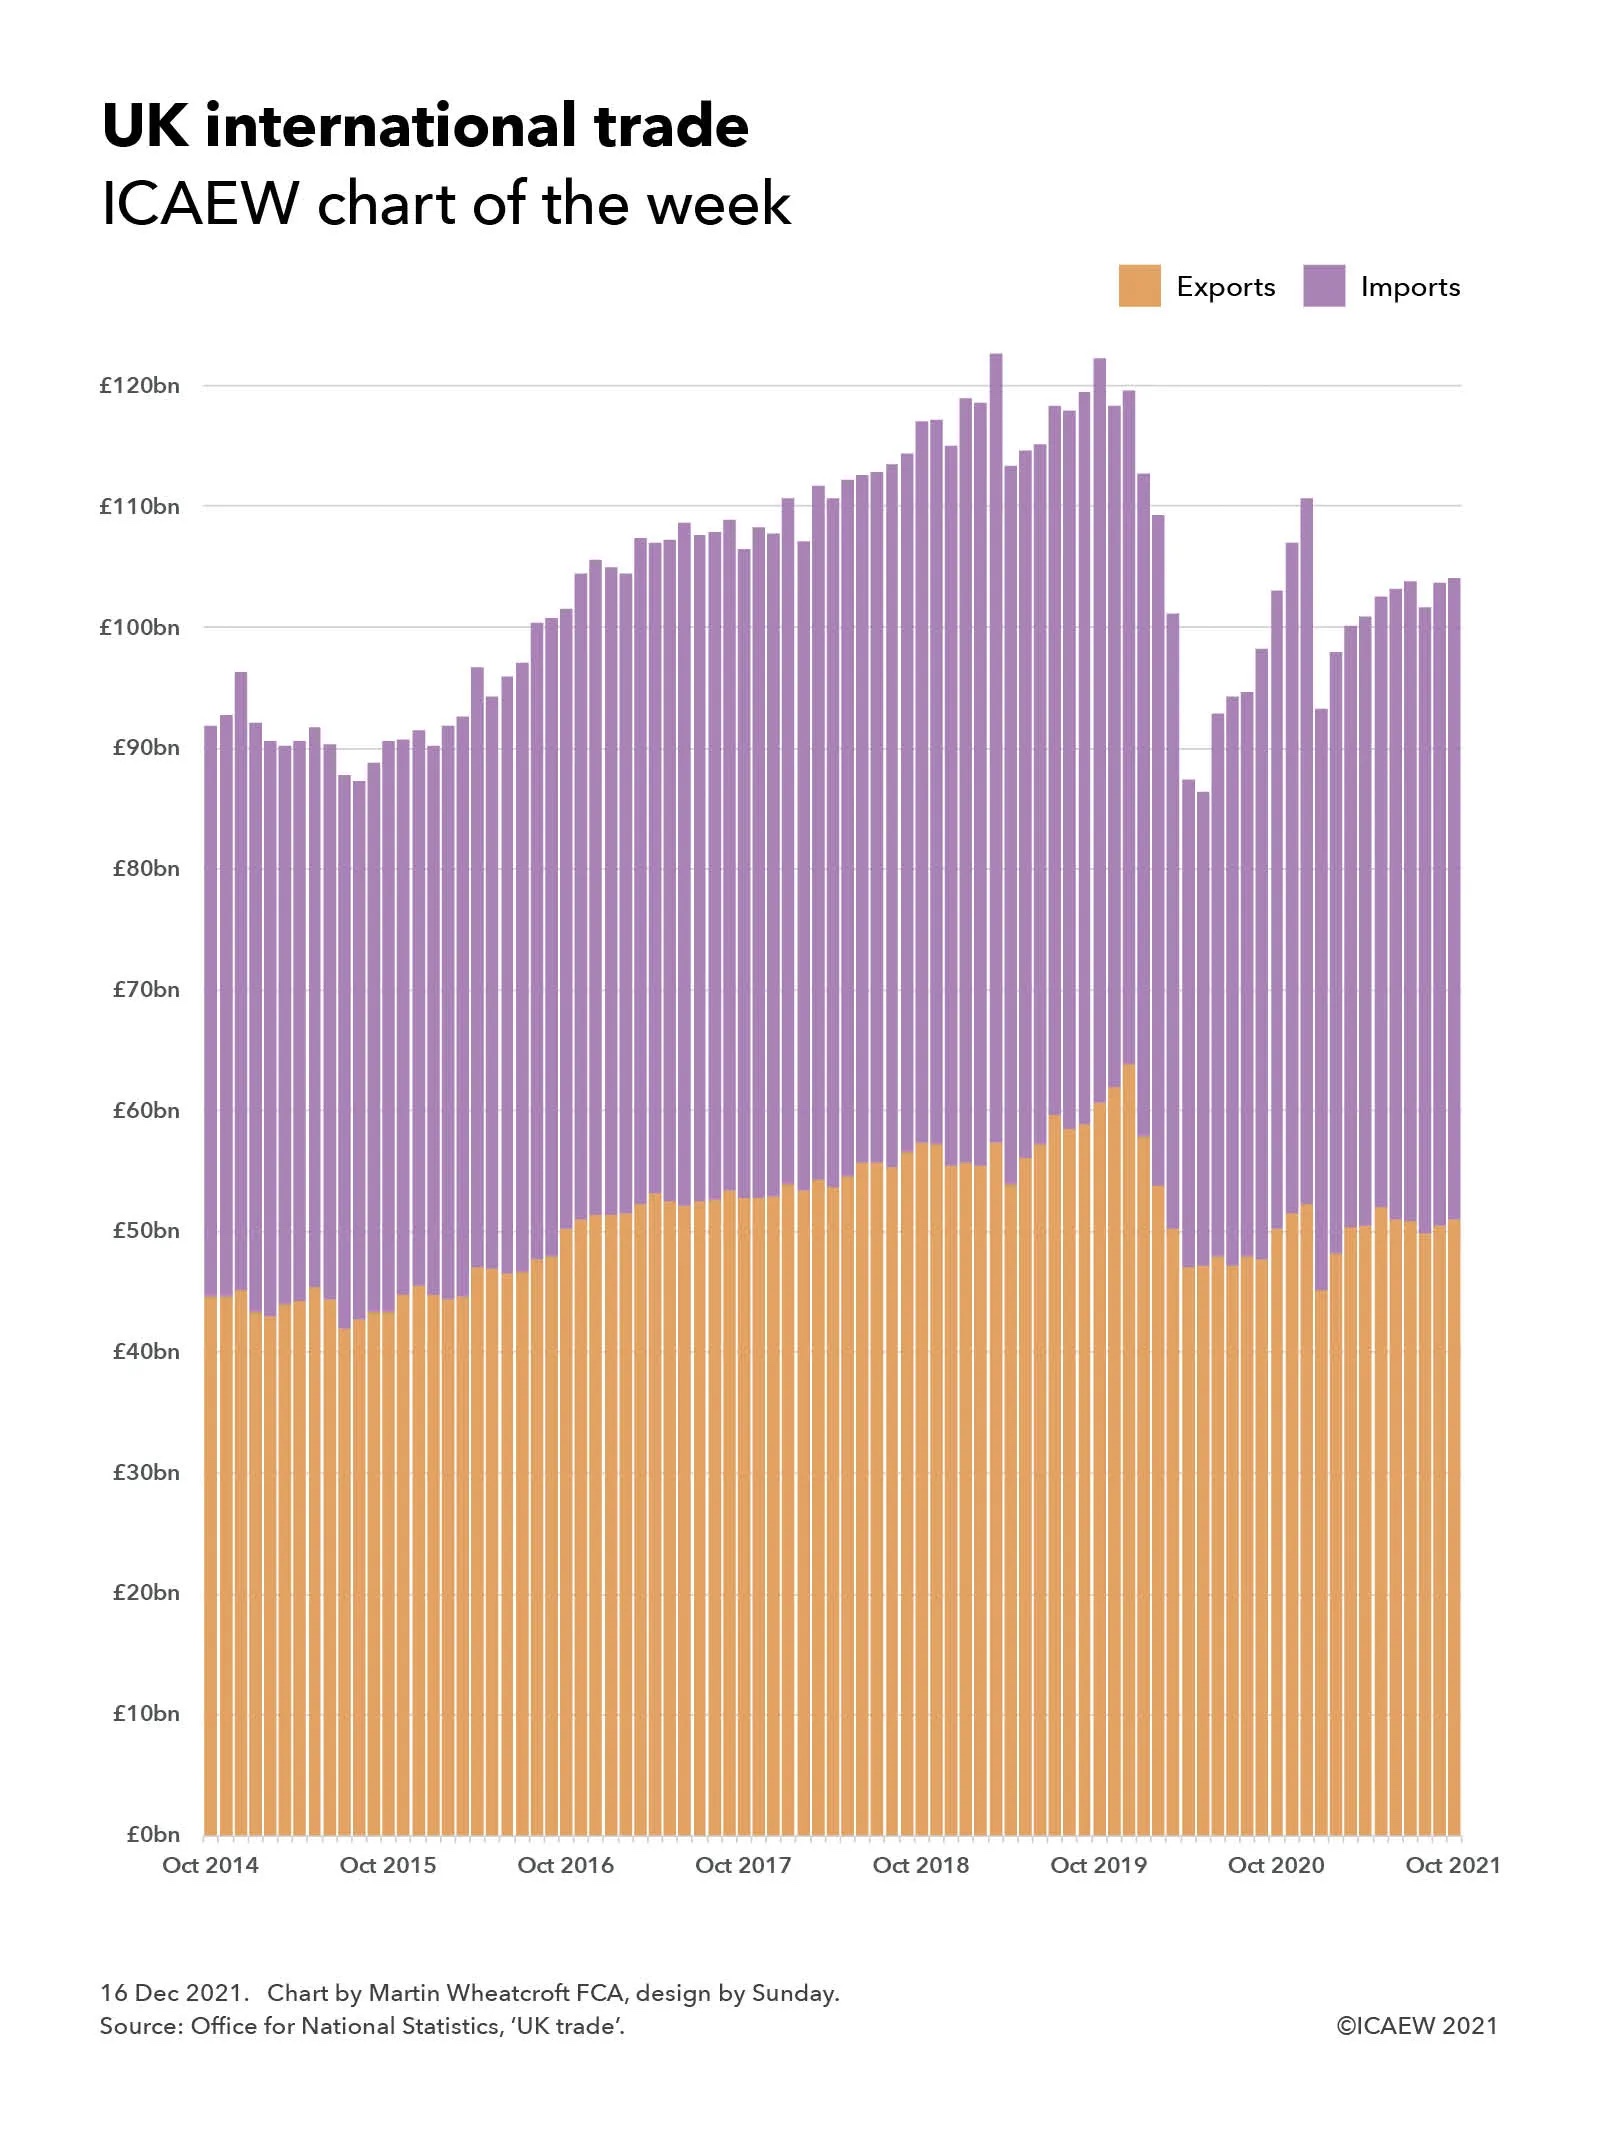
The monthly trade total (exports + imports) increased from £92bn (£45bn + £47bn) in October 2014 to a peak of £123bn (£57bn + £65bn) in March 2019 at the height of Brexit ‘no deal’ preparations before falling back to £113bn (£54bn + £59bn) the following month before peaking again at £122bn (£61bn + £62bn) in October 2020 ahead of the end of the transition period. Following the introduction of new trading arrangements and the run-down of inventories, trade fell to a low of £86bn (£47bn + £39bn) in May 2020 during the first lockdown before recovering to £111bn (£52bn + £59bn) in December 2020. Trade fell back to £93bn (£45bn + £48bn) in January 2020 before growing back to £104bn (£51bn + £53bn) in July 2021 where it has appeared to stabilise with similar monthly totals in September and October 2021.
The chart provides only a hint of the challenges that have faced both importers and exporters over the past couple of years as they have had to navigate new trading arrangements with our European neighbours just as the pandemic has caused massive disruption across the planet. Imports and exports to EU countries have both fallen, but the EU still remains the UK’s principal trading partner, comprising almost half of the UK’s trade in goods for example.
The stabilisation in trade flows in the last few months for which statistics are available may be a hopeful sign, but with greater customs checks on the imports of goods from the UK coming into force in January, and the continuing evolution of the pandemic, the position is still very uncertain.
This is our last chart of the week for 2021 and so we would like to take this opportunity to wish you all the best for a safe and enjoyable Christmas break and for a healthy and prosperous 2022. We look forward to seeing you again in the new year.