This week’s chart takes a look at the rebound in UK gross domestic product in March 2021, despite the country remaining in lockdown.
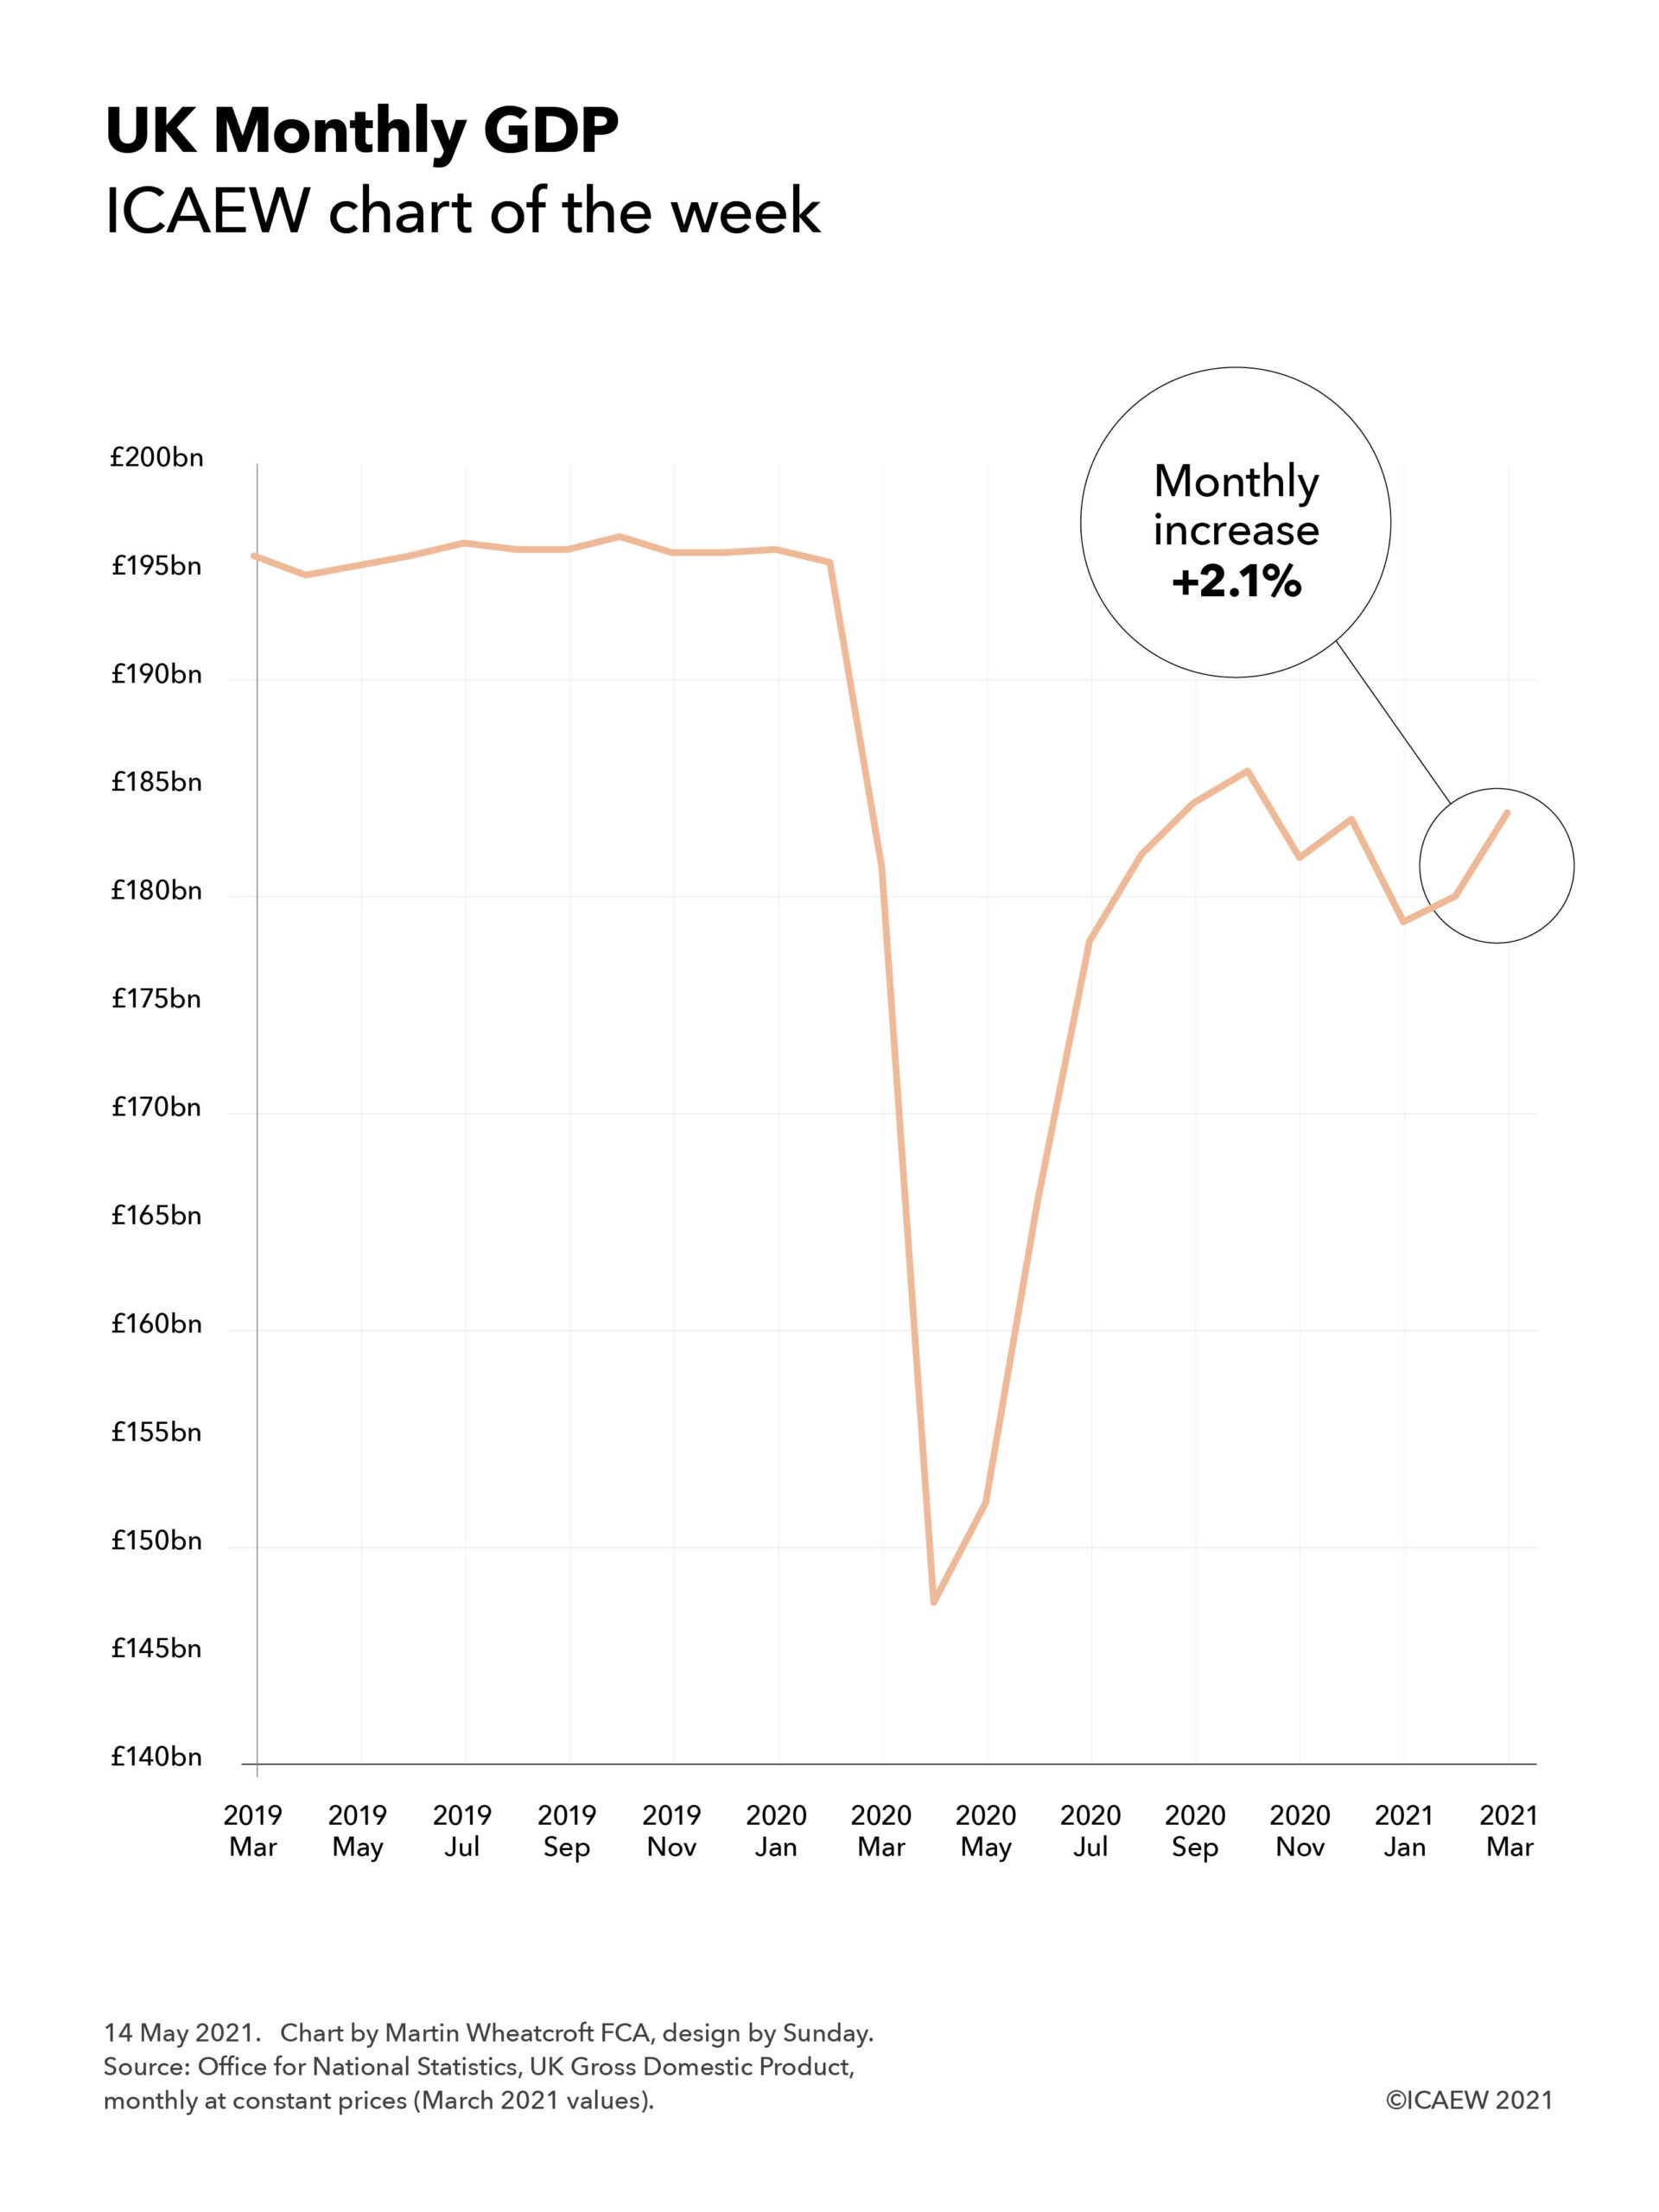
UK GDP jumped 2.1% in March 2021 according to the Office for National Statistics. A positive sign but, as our chart of the week illustrates, there is still a long way to go to get back to pre-pandemic levels of economic activity.
The #icaewchartoftheweek is on the economy this week, taking a look at how the latest economic statistics from the Office for National Statistics indicate a rebound in GDP in March 2021 even as the country remained in lockdown. This is a positive sign as the UK starts to emerge from the pandemic and people start to return to ‘normality’, albeit a new normal that is likely to be different to what came before.
However, the chart also makes clear how far the UK still has to go to return to pre-pandemic levels of economic activity, with the anticipated square-root shaped recovery stopped in its tracks in the last quarter of 2020 as COVID-19 resurged and restrictions on daily life were reimposed. The 2.1% real-terms growth in GDP in March follows a pattern of ups and downs in recent months with a fall of 2.2% in November, an increase of 1.0% in December, a fall of 2.5% in January, and an increase of 0.7% in February.
With the progress made in combating the virus over the last few months enabling lockdown restrictions to be progressively lifted across the UK, the hope is that March will be the second month on a more sustainable upward curve.