The Bank of England Monetary Policy Committee held interest rates constant at its latest meeting, despite CPI falling to 3.4% in February and core inflation dropping to 4.5%.
The Office for National Statistics reported its latest estimates for inflation on Wednesday 20 March 2024, with both annual consumer price inflation (CPI) and annual consumer price inflation excluding food, alcohol, tobacco and energy (core inflation) in February falling by 0.6 percentage points to 3.4% and 4.5% respectively.
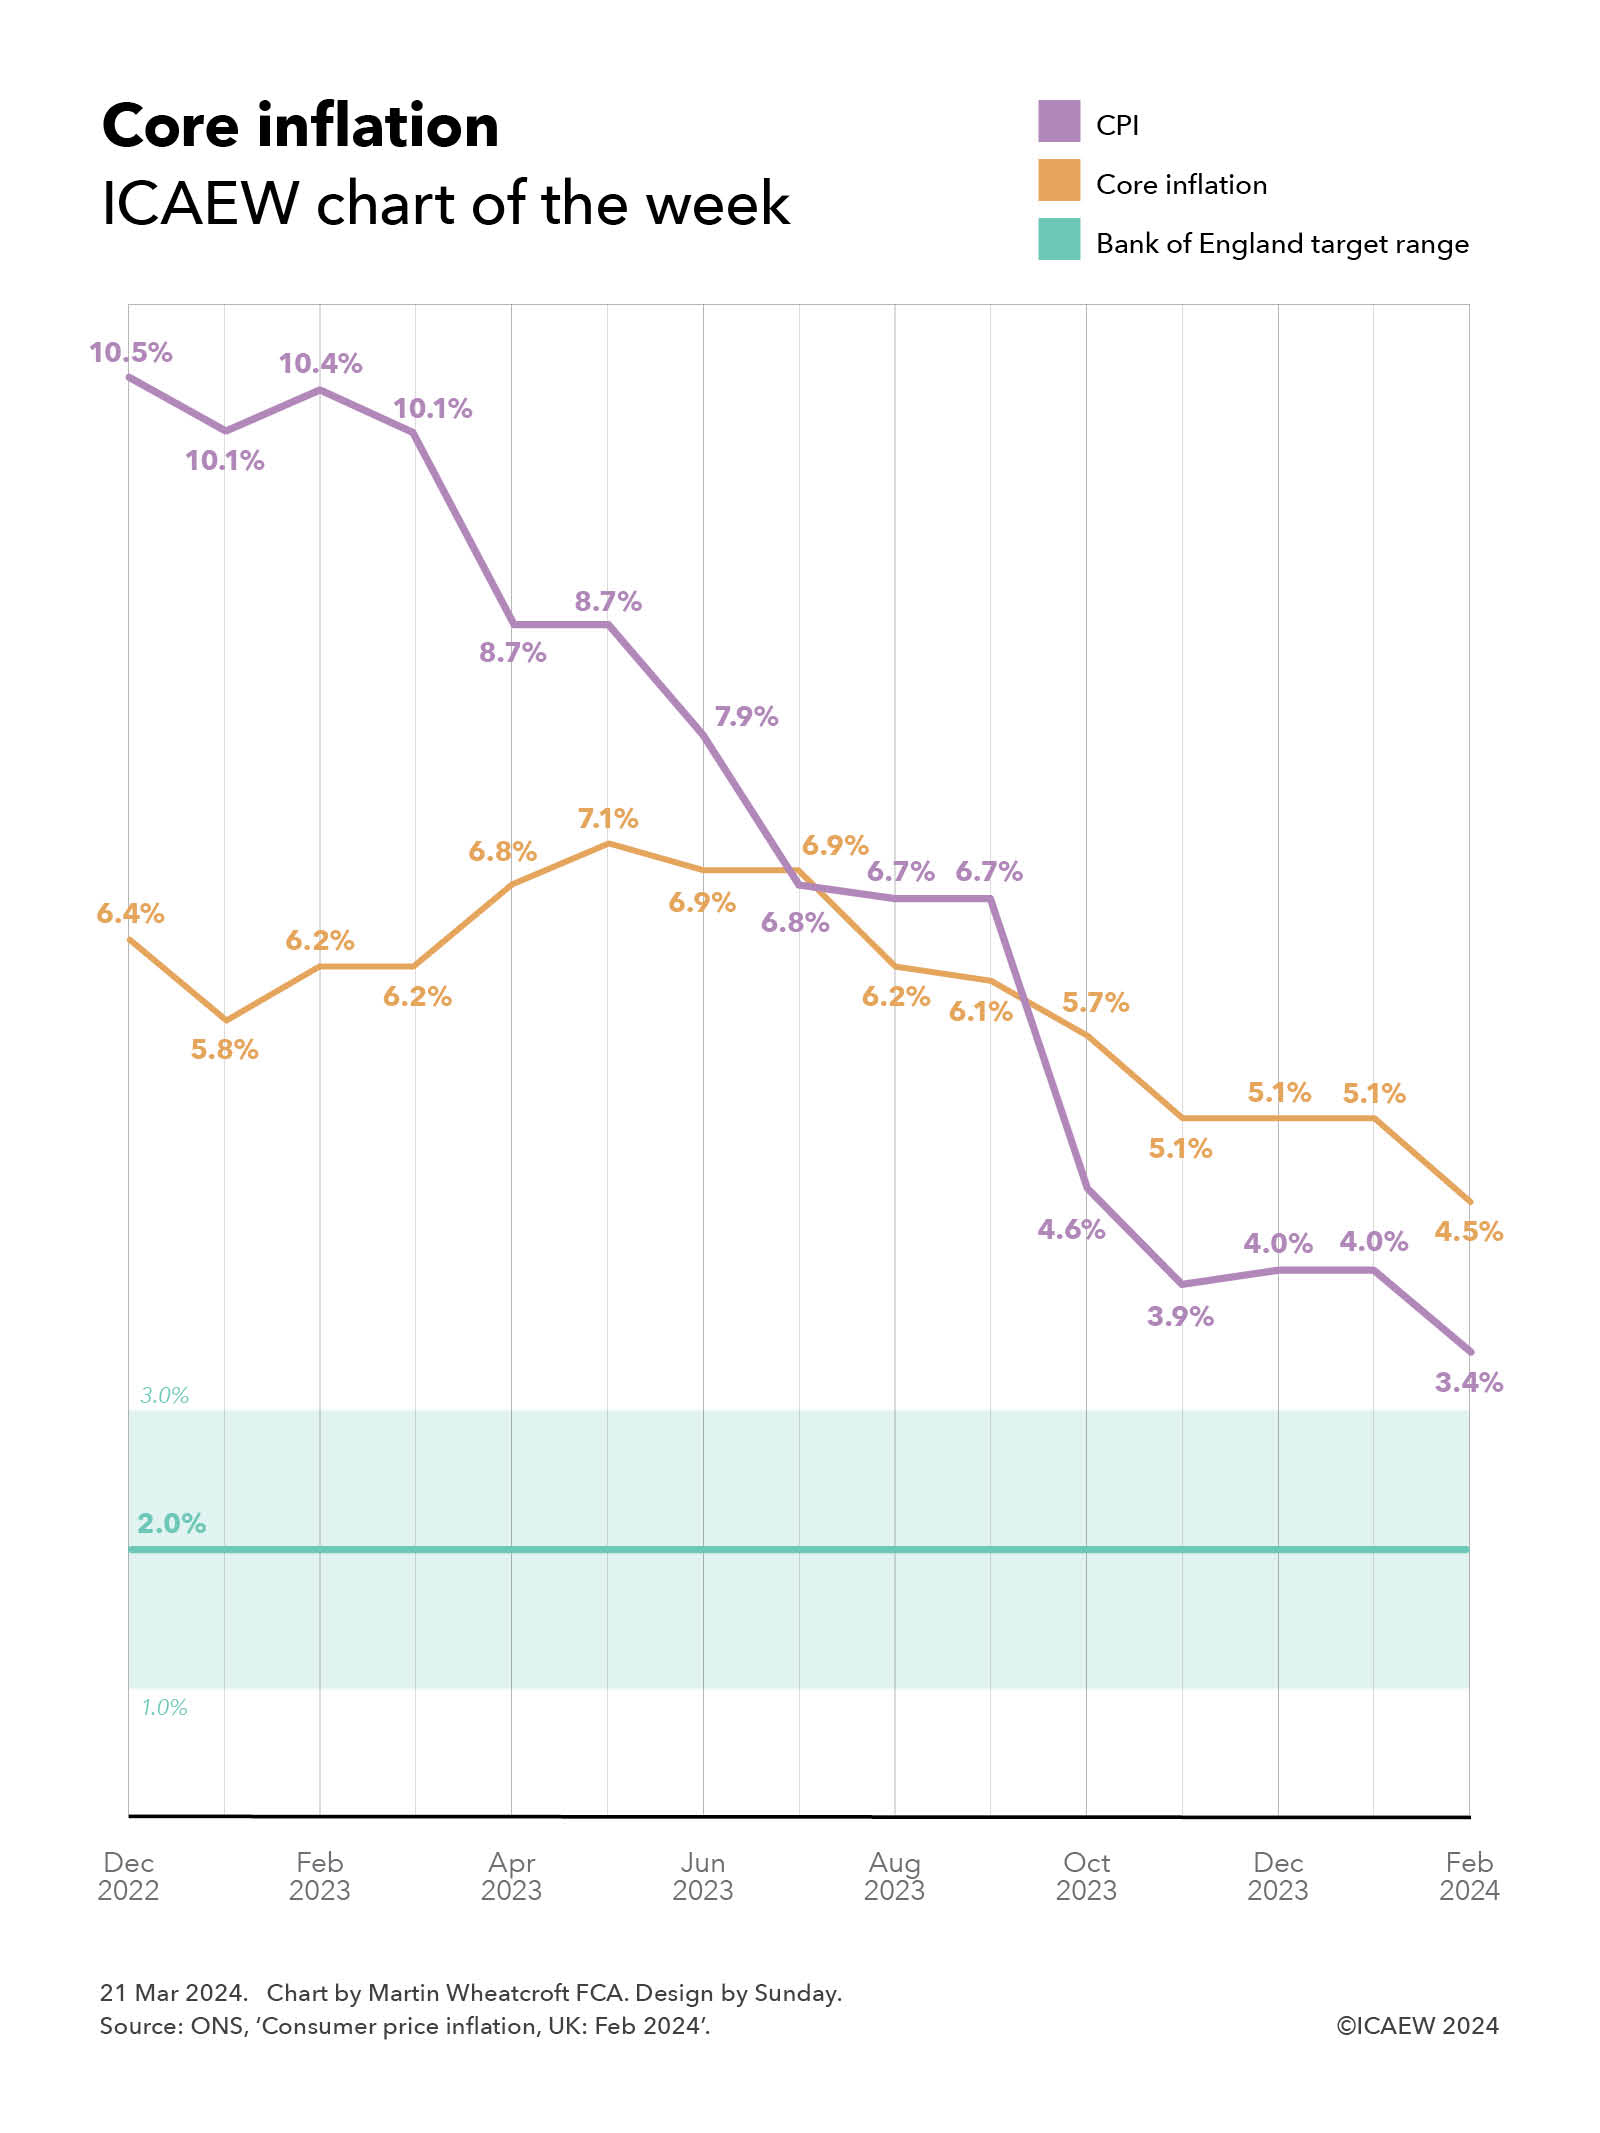
Our chart this week illustrates how CPI fell from 10.5% in the year to December 2022 to 4% in December 2023 and to 3.4% in February 2024, a rapid decline in the headline measure. This contrasts with the annual rate of core inflation, which increased from 6.4% in December 2022 to a peak of 7.1% in May 2023, before declining more gradually to 5.1% in December 2023 and to 4.5% in February 2024.
Annual food price inflation (5% in February 2024), alcohol and tobacco (11.9%), and energy prices (-13.8%) are of course many of the prices that we as consumers notice the most – what we buy in the supermarket, off-licence, at the fuel pump, or pay to heat and power our homes. However, food, alcohol, tobacco and energy prices are often very volatile and so core inflation allows us to understand what is happening to the (generally less volatile) prices of the other 78% of the things we buy as measured by the CPI Index.
The drop in core inflation to 4.5% is a positive sign for the Monetary Policy Committee, even if it didn’t reduce interest rates at its most recent meeting on Thursday 21 March 2024. The headline measure of CPI is coming down, and is expected to fall further over the next few months as large food price increases a year ago drop out of the annual comparison, a factor that won’t affect core inflation directly.
Policymakers are expected to remain cautious about cutting interest rates for several more months, as they will want to see how inflationary the scheduled increases in April of 9.8% in the minimum wage, 8.5% in the state pension and 6.7% in universal credit and other welfare benefits will be. Salaries are a significant input cost for the majority of businesses and it is likely that many will seek to pass on higher salary costs to their customers, while higher spending by pensioners and those in receipt of benefits could start to push up prices again just at the point that the Bank of England hopes to have brought inflation under control.
While there is likely to be much celebration and declaration of victory once the headline CPI measure drops into the target range over the next few months, how long it takes to bring down core inflation to within the target range is likely to be a better indicator of whether inflation has actually been tamed.
For more ICAEW analysis on the economy, click here.