ICAEW chart of the week: NATO defence spending

Our chart this week looks at how much NATO members would need to spend to meet President Trump’s proposed new target of 5% of GDP for defence and defence-related expenditure.

A two column chart showing NATO defence spending. 

Left hand column - USA: £732bn defence spending in 2024, £67bn defence spending to 3.5% of GDP, and £342bn defence-related spending to 5.0% of GDP = £1,141bn total. 

Right hand column - Europe and Canada: £408bn defence spending in 2024, £36bn defence spending to 2.0% of GDP, £271bn defence spending to 3.5% of GDP, and £301bn defence-related spending to 5.0% of GDP. 

6 June 2025. Chart by Martin Wheatcroft FCA. Design by Sunday.  Sources: NATO, 'Annual Report 2024'; ICAEW calculations.

According to NATO, the US and other NATO members spent 3.2% and 2.0% of GDP respectively on defence and security in 2024, with 21 countries meeting NATO’s target of a minimum spend of 2.0%, 10 countries falling short and one (Iceland) for which the guideline does not apply.

Our chart this week illustrates how those 10 countries falling short would need to have spent an additional £36bn in 2024 to reach the 2% of GDP minimum, while the US and NATO Europe and Canada members (including Türkiye) would have needed to spend a further £67bn and £271bn respectively to reach President Trump’s proposed new minimum of 3.5% of GDP.

The chart also shows how the US and other NATO members would need to spend £342bn and £301bn respectively on defence-related expenditure to reach a headline percentage of 5% of GDP. The definition of this spending has yet to be clarified and so it is difficult to know how much of this will be incremental and how much will be met by existing expenditure on infrastructure, security, law enforcement and other public services.

The consequence of a 5% headline target would have been total defence and defence-related expenditure of £2,157bn in 2024 numbers, comprising £1,141bn of spending by the US and £1,016bn of spending by other NATO members.

The 10 countries that would need to have spent more to meet the existing 2% NATO minimum in 2024 are Spain (£10bn), Canada (£9bn), Italy (£9bn), Belgium (£4bn), Netherlands (£2bn), Portugal (£1bn), Slovenia (£0.4bn), Luxembourg (£0.3bn), Croatia (£0.1bn) and Montenegro (£18m).

To reach a 3.5% defence expenditure target would require a substantial expansion in defence budgets with defence expenditure in the US going up by £67bn, Germany by £51bn, France by £37bn, the UK by £33bn, Italy by a further £28bn, Canada by a further £26bn, Türkiye by £15bn, Netherlands by a further £14bn, and Belgium by a further £8bn, with most other countries needing to increase their defence budget, too. 

The sole exception is Poland, which already spends more than 3.5% of GDP on defence (4.1% in 2024), while Estonia (3.4%), Latvia (3.4%), Lithuania (3.1%) and Greece (3.0%) each have much less far to go to reach a 3.5% of GDP target than most other NATO members.

According to NATO, the UK spent £66bn or 2.3% of GDP on defence and security in 2024, but this includes expenditure on the security services, counter-terrorism policing and war pensions in addition to ‘pure’ defence expenditure of £57bn or 2.0% of GDP. Whether, and to what extent, these extra elements will end up being reclassified from defence to defence-related expenditure is unclear, but if all of it was then that would add £9bn to the £33bn a year that the UK would need to find to meet a 3.5% defence expenditure target.

The key question will be how long NATO members are given to meet their new targets. The 2.0% minimum guideline was set in 2014 and provided 10 years for members to reach their new targets. Even then, not all of them achieved it.

It is likely to take years to recruit and train significant numbers of new soldiers, sailors and aircrew and procure major items of equipment such as tanks, ships, submarines and aircraft that would be commensurate with such a new target, so even if the money was available immediately (which it won’t be in most cases) most NATO members are likely to resist calls by the US to adopt a new target with effect from 2026.

Whatever happens, it is clear that most NATO members, including the UK, are going to need to increase spending on defence significantly over the next few years – and at a much faster pace than most of them have budgeted for. 

Tax rises and more borrowing are therefore likely to be on the agenda in many more countries than the UK alone.

This chart was originally published by ICAEW.

ICAEW chart of the week: Gold

With President Trump planning to visit Fort Knox to check up on the US government’s gold reserves, my chart for ICAEW this week looks at just how much gold is owned by governments around the world.

According to the latest statistics from the World Gold Council, sourced principally from the International Monetary Fund (IMF), governments and international financial institutions around the world own 35,864 tonnes of gold. Much of this gold sits in the Bank of England, Fort Knox and in central bank vaults around the world.

At a price of around £74 per gram, the total value of ‘government gold’ adds up to somewhere in the region of £2.7trn. This is estimated to be around one-sixth of the total above-ground stock of gold in the world.

While the US is the largest individual holder of official gold reserves with 8,133 tonnes of gold worth around £600bn, the 27 countries of the EU and the European Central Bank collectively own a total of 11,719 tonnes of gold worth approximately £870bn. This includes Germany with 3,352 tonnes, Italy 2,452 tonnes, France 2,437 tonnes, Netherlands 615 tonnes, the European Central Bank 507 tonnes, Poland 448 tonnes, Portugal 383 tonnes, Spain 282 tonnes, Austria 280 tonnes, Belgium 227 tonnes, Sweden 126 tonnes, Greece 115 tonnes, Hungary 110 tonnes, Romania 104 tonnes and other EU member states with 281 tonnes.

The next biggest holder of gold is the IMF with 2,814 tonnes (worth around £210bn), followed by Russia with 2,336 tonnes (£175bn), China 2,280 tonnes (£170bn), Switzerland 1,040 tonnes (£77bn), India 876 tonnes (£65bn), Japan 846 tonnes (£63bn), Türkiye 615 tonnes (£46bn), Taiwan 424 tonnes (£31bn), Uzbekistan 383 tonnes (£28bn), Saudi Arabia 323 tonnes (£24bn), the UK 310 tonnes (£23bn), Lebanon 287 tonnes (£21bn) and Kazakhstan 284 tonnes (£21bn).

The total for other countries adds up to 3,194 tonnes worth, or around £235bn or so, including Thailand 235 tonnes, Singapore 220 tonnes, Algeria 174 tonnes, Iraq 163 tonnes, Venezuela 161 tonnes, Libya 147 tonnes, Brazil 130 tonnes, Philippines 130 tonnes, Egypt 127 tonnes, South Africa 125 tonnes, Mexico 120 tonnes, Qatar 111 tonnes, South Korea 104 tonnes and the Bank for International Settlements 102 tonnes. 

While the level of official gold holdings is partly driven by the economic size of the countries concerned, it also depends on their reserve strategies, with US, German, French and Italian gold holdings making up around 75%, 74%, 72% and 71% of their official reserves respectively, in contrast with 6%, 9%, 11% and 15% for China, Switzerland, India and the UK, for example. 

President Trump’s plan to visit Fort Knox to personally inspect his nation’s gold holdings reflects one of the benefits of investing in a physical commodity such as gold – you can count gold bars, weigh them and check their purity, as well as admire its shiny quality. He may have a less satisfying experience in verifying any future strategic crypto-currency reserve, where entries in a ledger are somewhat more ephemeral.

This chart was originally published by ICAEW.


ICAEW chart of the week: UN budget contributions 2025

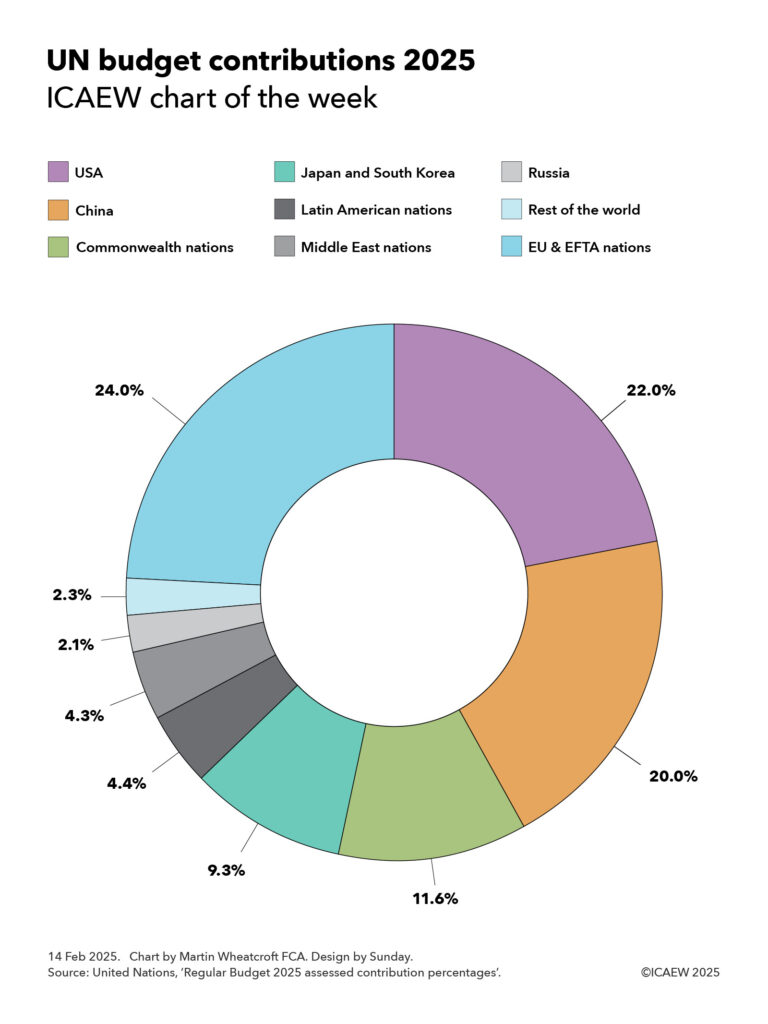
My chart for ICAEW this week looks at the assessed contributions of member states to the United Nations Regular Budget for 2025.

Pie chart showing proportion of contribution to the UN regular budget. 

EU & EFTA nations 24.0%, USA 22.0%, China 20.0%, Commonwealth nations 11.6%, Japan and South Korea: 9.3%, Latin American nations 4.4%, Middle East nations 4.3%, Russia 2.1%, Rest of the world 2.3%. 

14 Feb 2025. Chart by Martin Wheatcroft FCA. Design by Sunday. Source: United Nations, 'Regular Budget 2025 assessed contribution percentages'.

The United Nations is funded through a mix of assessed contributions from member states, voluntary contributions from both member states and others, and revenue generated from operations.

In 2023, total revenue for all UN entities comprised $67.6bn, of which $13.8bn was from assessed contributions, $46.8bn from voluntary contributions ($41.0bn earmarked and $5.8bn non-earmarked), and $7.0bn in revenue from operations.

Of the $13.8bn in assessed contributions from member states, $3.3bn in 2023 was for the core activities of the UN itself and our chart this week illustrates the assessed contribution percentages for 2025 for the $3.4bn UN Regular Budget set for 2025.

This highlights how European Union (EU) and European Free Trade Area (EFTA) nations have been assessed to pay 24.0% of the core budget in 2025, followed by the USA (22.0%), China (20.0%), Commonwealth nations (11.6%), Japan and South Korea (9.3%), Latin American nations (4.4%), Middle East nations (4.3%), Russia (2.1%), and the rest of the world (2.3%).

EU and EFTA national contributions are led by Germany (5.7%), France (3.9%), Italy (2.8%), Spain (1.9%), Netherlands (1.3%), Switzerland (1.0%), Poland (0.8%), Sweden (0.8%), Belgium (0.8%), Norway (0.7%), Austria (0.6%), Denmark (0.5%) and Ireland (0.5%). The remaining 18 EU and EFTA members (and three microstates) are expected to contribute a further 2.7% in 2025.

Of the Commonwealth nations, the UK (4.0%), Canada (2.5%), Australia (2.0%), India (1.1%) and Singapore (0.5%) contributed the most, with the remaining 49 members not including Cyprus and Malta (who are included in the EU in this chart) contributing a further 1.5%.

Japan (6.9%) and Korea (2.4%) are assessed to contribute 9.3% between them, while Latin American nations are down to contribute 4.4%, led by Brazil (1.4%), Mexico (1.1%) and Argentina (0.5%) with 1.4% coming from the rest.

Middle East countries are expected to contribute 4.3% between them, with Saudi Arabia (1.2%), Türkiye (0.7%), Israel (0.6%) and UAE (0.6%) being the largest. Another 11 Middle Eastern nations are down to contribute a further 1.2%.

Russia has been assessed to contribute 2.1%, while countries in the rest of the world are expected to put in a further 2.3%, of which Indonesia (0.6%) is the only one to contribute more than half a percent of the total assessment, with the remaining 68 member states collectively contributing a further 1.7% in total.

The assessed contributions for UN agencies and other activities vary from the percentages shown in the chart as they depend on which countries participate in each agency or activity and several other factors. For example, the US has been assessed to pay 26.2% of the UN peacekeeping budget in 2025 (higher than their 22% regular budget contribution), although the US is expected to pay only 25% because of a cap of 25% set by Congress. The UK and France are expected to pay 4.7% and 4.6% respectively (higher than their 4.0% and 3.9% regular budget contributions), while China has been assessed to pay 18.7% (lower than its 20.0% regular budget contribution).

Another example is the World Trade Organisation (WTO) where the US and China are assessed to contribute 11.4% and 11.2% respectively and most other nations contribute a larger share.

One big question for the UN in 2025 will be the extent to which the new US administration reduces the amount it pays to the UN compared with previous years. The total paid by the US was $13bn in 2023, comprising $3.2bn in assessed contributions and $9.7bn in voluntary contributions. 

In theory, if the US leaves a UN agency, such as already announced departures from the World Health Organisation and the UN Human Rights Council, then the assessed contributions for the remaining members can be increased to compensate. 

The White House has also announced that it is reviewing its membership of the UN Educational, Scientific and Cultural Organisation and that it will withhold a proportionate share of its regular budget contribution that goes towards the UN Relief and Works Agency for Palestinian Refugees in the Near East.

A bigger question will be the extent to which the US cuts its voluntary contributions to UN programmes. A substantial proportion of these voluntary contributions have traditionally come through the US Agency for International Development, where payments have recently been suspended.

This chart was originally published by ICAEW.

ICAEW chart of the week: Eurozone government bond yields

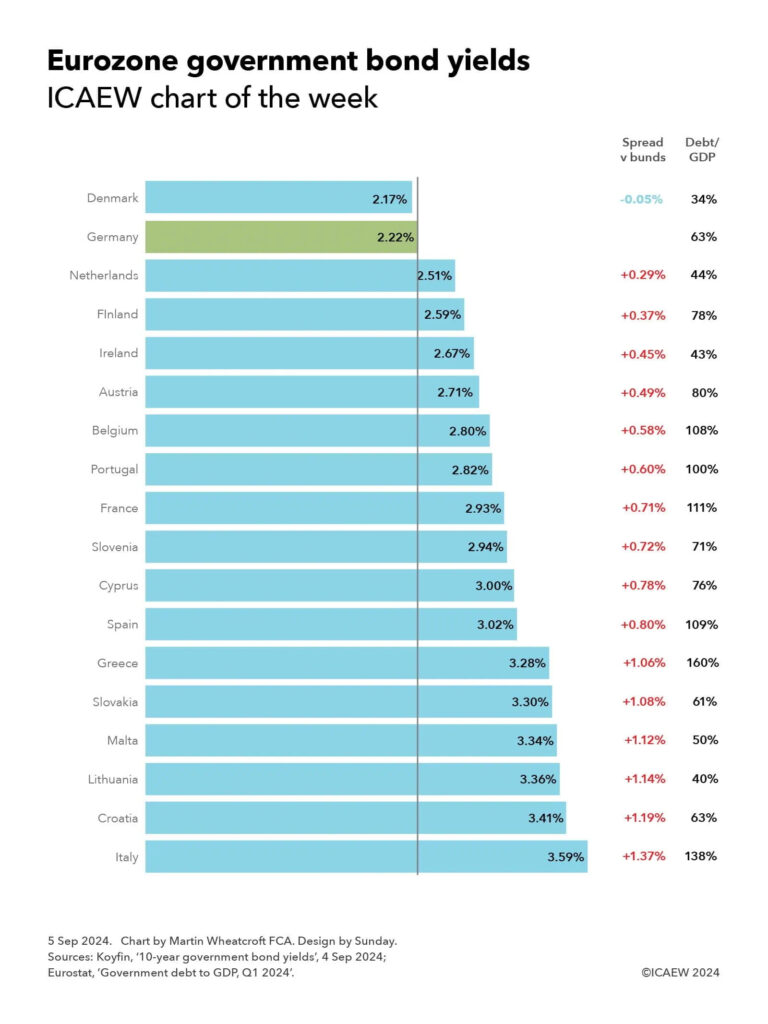
My chart for ICAEW this week is on the cost of government borrowing in the Eurozone, which on 4 September ranged from 2.17% for Danish 10-year bonds up to 3.59% for their Italian equivalents.

ICAEW chart of the week: Eurozone government bond yields. 
 
Bar chart showing the yields on 10-year government bonds on 4 September 2024, the spread versus German bunds, and each countries’ debt to GDP at the end of the first quarter of 2024. 

Denmark: 2.17% yield, -0.05% spread, 34% debt/GDP. 
Germany: 2.22%, -, 63%. 
Netherlands: 2.51%, +0.29%, 44%. 
Finland: 2.59%, +0.37%, 78%. 
Ireland: 2.67%, +0.45%, 43%. 
Austria: 2.71%, +0.49%, 80%. 
Belgium: 2.90%, +0.58%, 108%. 
Portugal: 2.82%, +0.60%, 100%. 
France: 2.93%, +0.71%, 111%. 
Slovenia: 2.94%, +0.72%, 71%. 
Cyprus: 3.00%, +0.78%, 76%. 
Spain: 3.02%, +0.80%, 109%. 
Greece: 3.28%, +1.06%, 160%. 
Slovakia: 3.30%, +1.08%, 61%. 
Malta: 3.34%, +1.12%, 50%. 
Lithuania: 3.36%, +1.14%, 40%. 
Croatia: 3.41%, +1.19%, 63%. 
Italy: 3.59%, +1.37%, 138%. 

5 Sep 2024.   Chart by Martin Wheatcroft FCA. Design by Sunday. 

Source: Koyfin, ’10-year government bond yields’, 4 Sep 2024; Eurostat, ‘Government debt to GDP, Q1 2024’.  

© ICAEW 2024.

My chart this week is on the range of yields payable on 10-year government bonds by 18 out of the 20 countries in the Eurozone for which data is available.

The chart illustrates how investors in German 10-year government bonds (known as ‘bunds’) would have received a yield to maturity of 2.22% – or conversely the German government could have borrowed at an effective interest rate of 2.22% if issuing fresh debt at that point in time. Yields on German bunds are used as benchmark rates for government debt not just in the Eurozone, but globally.

Just one country in the Eurozone has a lower 10-year bond yield than Germany, which is Denmark at 2.17% on 4 September, which is a 0.05 percentage points or 5 basis points (bp) ‘spread’ below the benchmark bund rate. 

While quoted yields move up and down all the time, sometimes by quite large amounts, spreads are much less volatile, providing an insight into how debt investors perceive the relative risks of investing in different countries’ sovereign debt.

The next lowest yields were the Netherlands at 2.51%, with a spread of 0.29 percentage points above bunds, and Finland at 2.59% (+0.37%). This is then followed by Ireland on 2.67% (+0.45%), Austria on 2.71% (+0.49%), Belgium on 2.80% (+0.58%), Portugal on 2.82% (+0.60%), France on 2.93% (+0.71%), Slovenia on 2.94% (+0.72%), Cyprus on 3.00% (0.78%) and Spain on 3.02% (+0.80%). There is then a small jump to Greece on 3.28% (+1.06%), Slovakia on 3.30% (+1.08%), Malta on 3.34% (+1.12%), Lithuania on 3.36% (+1.14%) and Croatia on 3.41% (+1.19%). 

The highest yield for investors among Eurozone countries – and hence the highest borrowing cost for its government – is Italy with 3.59%, which is 1.37 percentage points above the effective interest rate at which Germany could in theory borrow.

Comparing the bond yields in the Eurozone provides an insight into the relative strengths and weaknesses of these countries’ public finances and economies given that they all share a currency, a central bank base interest rate (currently 3.75%), and are all in the EU Single Market and Customs Union. Comparing yields with other currencies, such as the UK’s 3.95% for example (not shown in the chart), needs to take other factors into account, such as the UK’s much higher central bank base rate of 5%.

The chart also reports the government debt to GDP levels of each country for the second quarter of 2024 according to Eurostat, which may help explain why Denmark (with debt/GDP of 34%) pays a significantly lower borrowing cost than Spain (109%). 

However, debt/GDP doesn’t explain all of the differences, with the 10-year yield on Greek government debt (debt/GDP 160%) of 3.28% for example being significantly lower than the 10-year yield on Italian government debt (debt/GDP 138%) of 3.59%. 

Not shown in the chart are Estonia (debt/GDP 24%) and Latvia (45%), both of which tend to borrow at shorter maturities.

The lack of a firm correlation between debt/GDP and bond spreads should not be surprising as debt/GDP is a relatively crude measure of public finance strength or weakness. It excludes most government assets and non-debt liabilities, the funded or unfunded nature of their social security systems, as well as a country’s medium- and longer-term economic prospects and the perceived stability of that country’s government. These are all factors debt investors take into account when deciding the level of risk that they are willing to accept when investing.

This chart was originally published by ICAEW.

ICAEW chart of the week: EU Budget 2024

My chart for ICAEW this week illustrates how Ireland has displaced Luxembourg in contributing the most to the EU Budget on a per capita basis.

EU Budget 2024
ICAEW chart of the week

Vertical bar chart showing contributions per person per month to the EU budget for 2024 by country (blue bars) and the EU average (purple bar).

Ireland: €53.20
Luxembourg: €50.70
Belgium: €44.10
Netherlands: €39.00
Denmark: €37.80
Finland: €31.30
Germany: €29.70
Slovenia: €28.90
France: €28.60
Austria: €28.50
Sweden: €25.20
EU average: €25.20
Italy: €24.40
Malta: €23.20
Spain: €21.80
Estonia: €21.70
Cyprus: €20.70
Czechia: €20.30
Lithuania: €20.00
Portugal: €17.80
Latvia: €16.90
Hungary: €16.20
Poland: €15.70
Greece: €15.40
Slovakia: €15.00
Croatia: €13.10
Romania: €12.00
Bulgaria: €10.50

25 Jan 2024.
Chart by Martin Wheatcroft FCA. Design by Sunday.
Sources: European Union, 'EU Budget 2024'; Eurostat, 'Population projections'; ICAEW calculations.

(c) ICAEW 2024

The European Union’s Budget for the 2024 calendar year amounts to €143bn, with national governments contributing €137bn and EU institutions generating the balance of €6bn. At a current exchange rate of £1:€1.17 this is equivalent to a budget of £122bn comprising national contributions of £117bn and other income of £5bn.

My chart illustrates how much national governments contribute to the EU budget on a per capita basis, ranging from Ireland contributing the most to Bulgaria the least. Ireland’s recent economic success has seen it overtake Luxembourg as the country with the highest GDP per capita, and hence the highest per capita contributor to the EU Budget. 

The average contribution for the EU’s population works out at just over €302 (£258) per person per year or €25.20 (£21.50) per person per month, based on a total population of 453m living in the 27 EU member countries.

The chart shows how Ireland’s contributions are equivalent to €53.20 per person per month, followed by Luxembourg on €50.70, Belgium on €44.10, Netherlands on €39.00, Denmark on €37.80, Finland on €31.30, Germany on €29.70, Slovenia on €28.90, France on €28.60, Austria on €28.50, Sweden on €25.20, Italy on €24.40, Malta on €23.20, Spain on €21.80, Estonia on €21.70, Cyprus on €20.70, Czechia on €20.30, Lithuania on €20.00, Portugal on €17.80, Latvia on €16.90, Hungary on €16.20, Poland on €15.70, Greece on €15.40, Slovakia on €15.00, Croatia on €13.10, Romania on €12.00, and Bulgaria on €10.50.

Total contributions of €137bn amount to approximately 0.8% of the EU’s gross national income of €17.7trn. They comprise €25bn from 75% of customs duties and sugar sector levies, a €24bn share of VAT receipts, €7bn based on plastic packaging that is not recycled (providing countries with an economic incentive to reduce it), and €82bn calculated as a proportion of gross national income. 

While the UK ‘rebate’ no longer exists, these numbers in the chart are net of the equivalent but proportionately smaller ‘rebate’ totalling €9bn that continues to go to Germany, Netherlands, Sweden, Austria and Denmark. The EU Commission had proposed removing it during the negotiations for the 2021 to 2027 multi-year financial framework but was unsuccessful in persuading these five countries to give it up.

The chart only shows the gross contributions paid by national governments – it doesn’t show the amount that comes back to each country through EU spending, whether in the form of economic development funding and agricultural subsidies, through science, technology, educational or other programmes, or through the economic benefits of hosting EU institutions. This will reduce the effective net contribution for most of the richer nations, while poorer member states will benefit by more coming from the EU than they are paying in.

The numbers also do not include €113bn (£97bn) of spending through the NextGenerationEU programme that is funded by direct borrowing by the EU. This is equivalent to additional spending of €20.80 per person per month that will need to be repaid over the next few decades – hopefully through the benefits of higher economic growth.

This chart was originally published by ICAEW.