Our chart this week compares the UK public finances for the current fiscal year with the overall size of the economy, illustrating how taxes are expected to amount to 36% of GDP and expenditure 47% of GDP.
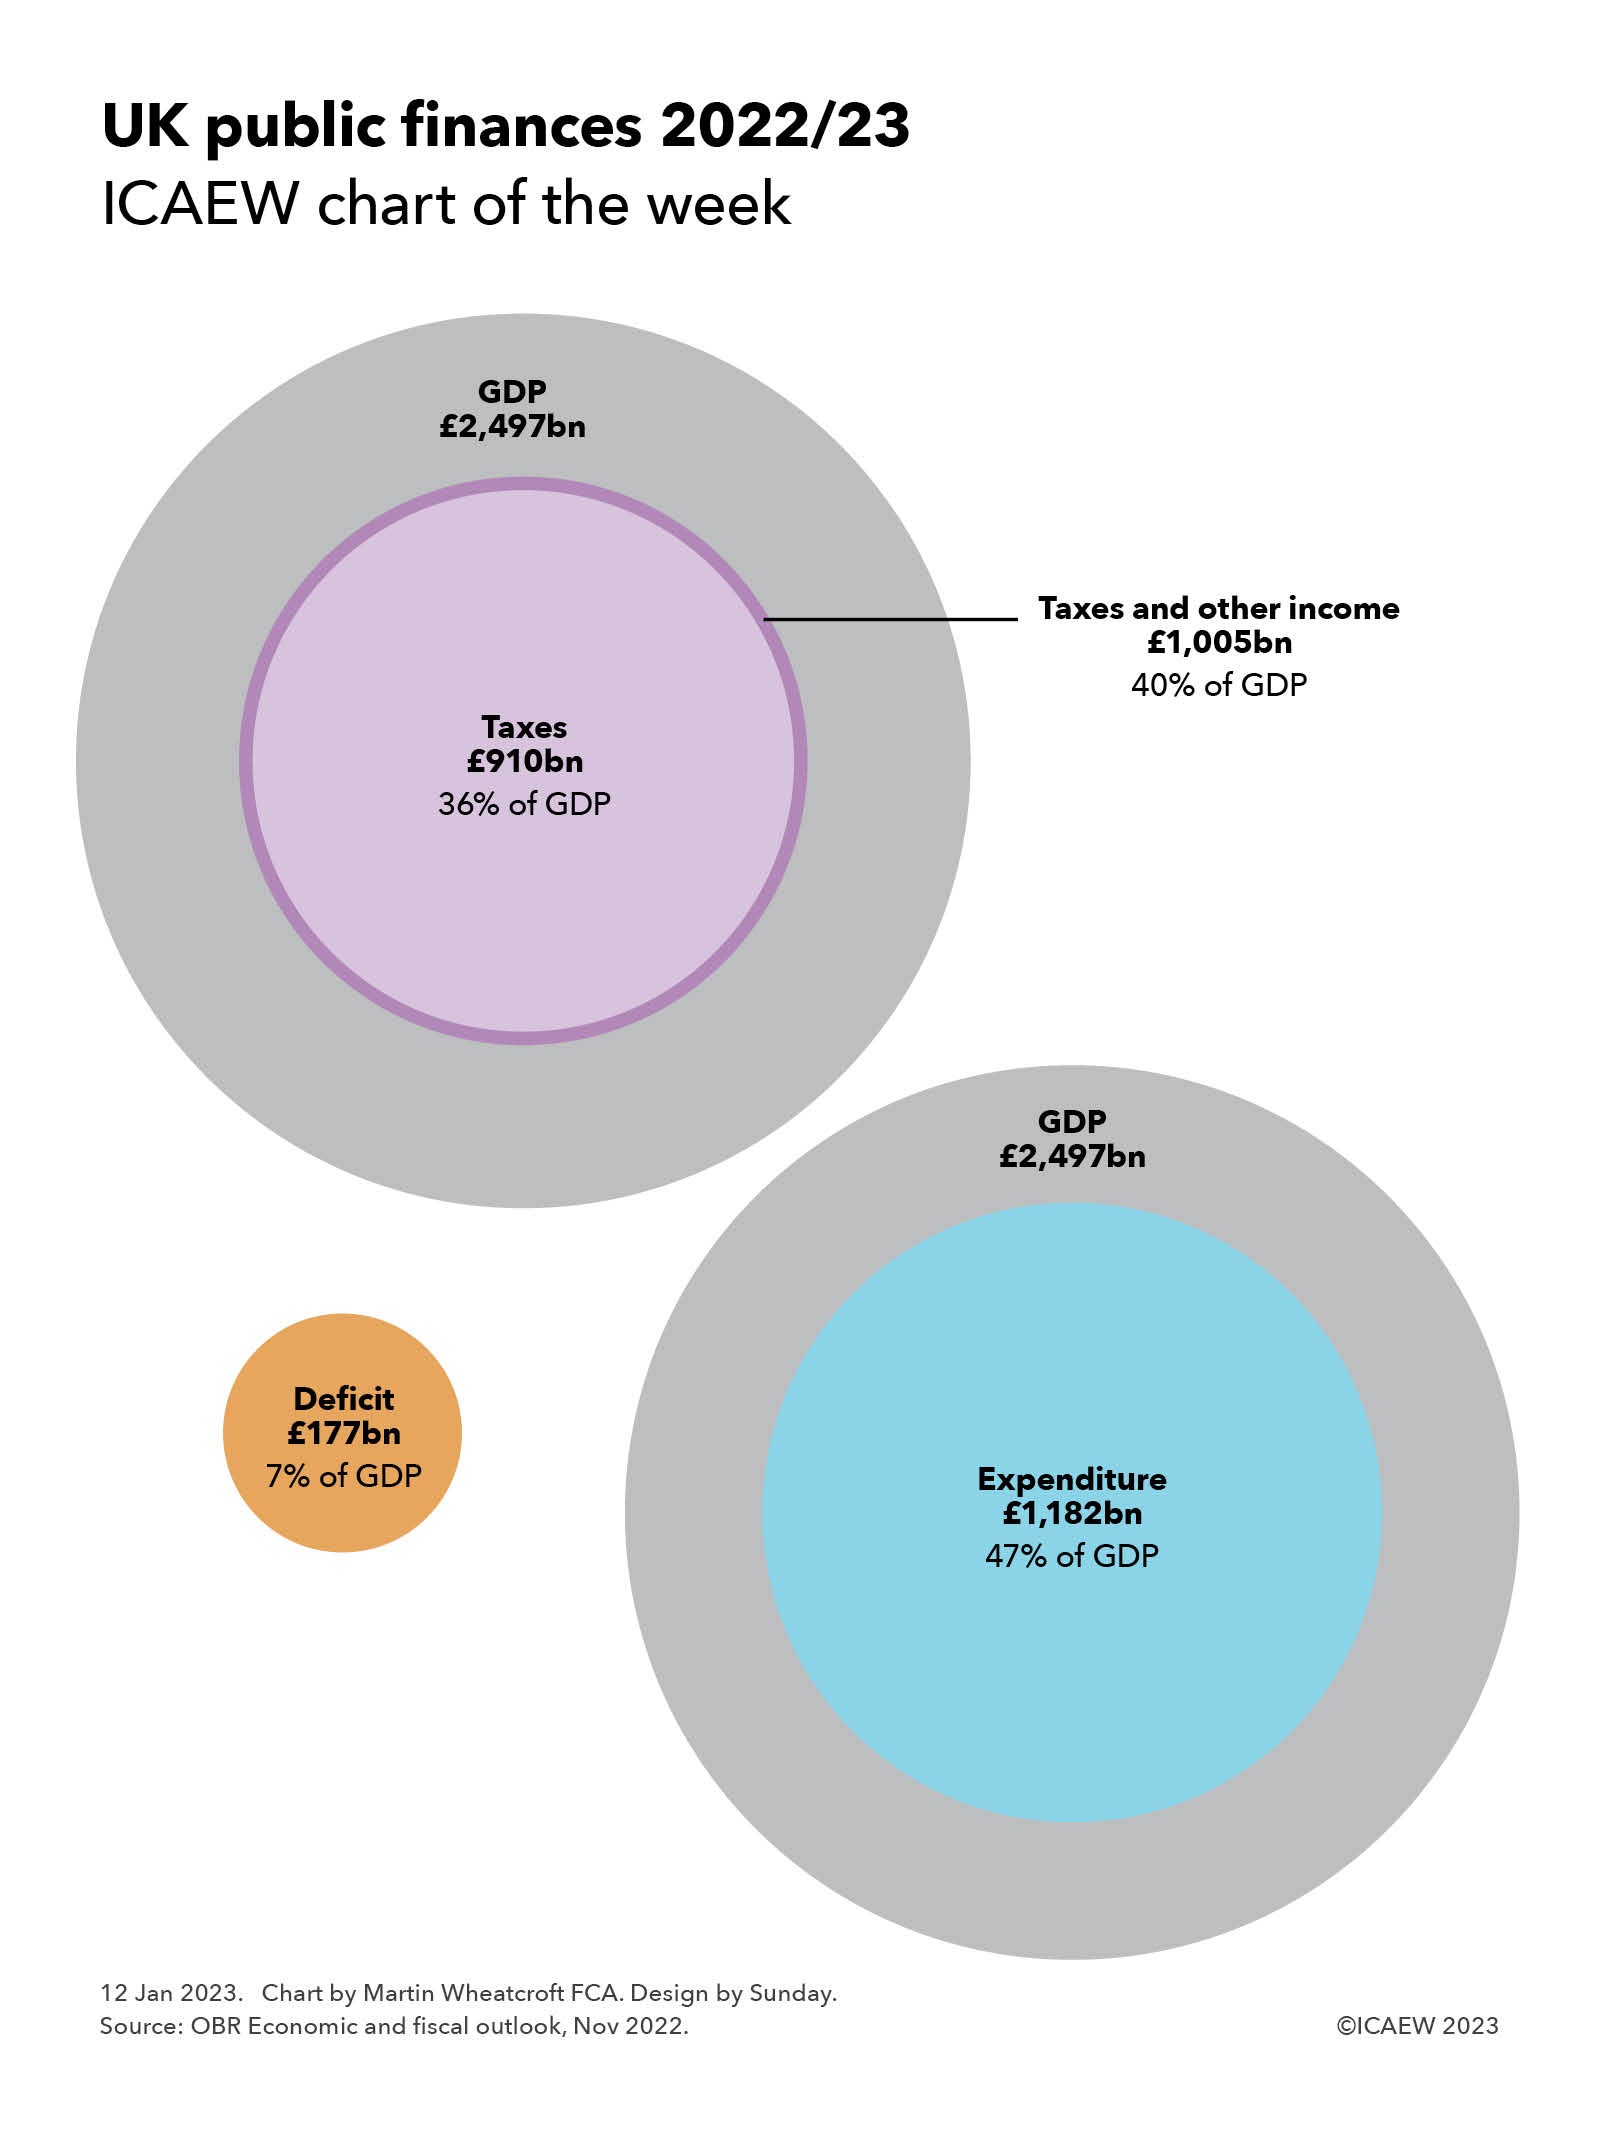
The latest official forecast from the Office for Budget Responsibility (OBR) for the current fiscal year ending 31 March 2023 is for a shortfall (or ‘deficit’) of £177bn between receipts of £1,005bn and expenditure of £1,182bn. The largest component of receipts is taxation, which is forecast to amount to £910bn.
Our chart puts these numbers into context by comparing them with the forecast for Gross Domestic Product (GDP) of £2,497bn in 2022/23, highlighting how taxes are expected to amount to 36% of GDP, receipts including other income to 40% of GDP, and expenditure to 47% of GDP, resulting in a deficit amounting to 7% of GDP.
As many commentators have noted, taxes are at a historically high level, with taxation at its highest level as a share of economic activity since 1949. This is unsurprising given the combination of many more people living longer lives and the financial commitments made by successive governments to pay for pensions, health and (to an extent) social care.
Expenditure is also at historically high levels, with energy support packages adding to recurring expenditure of around 43% or 44% of GDP. This is below the peak of 53% of GDP a couple of years ago at the height of the pandemic.
As a consequence, the shortfall between receipts and expenditure of 7% of GDP is elevated compared with the 2% to 3% of GDP ‘normal’ range, although still below the 15% of GDP seen in 2020/21 during the pandemic and 10% of GDP in 2009/10 during the financial crisis.
The increase in the corporation tax rate to 25% from April means that receipts are expected to increase to 37% of GDP over the next few years, leading to the total of taxes and other receipts rising to 41%. At the same time total expenditure is expected to stay at 47% of GDP in 2023/24 before falling back to 45% in 2024/25, 44% in 2025/26 and 2026/27, and 43% in 2027/28.
Unlike in previous generations, the government is restricted in its ability to cut other areas of spending to cover expected further rises in spending on pensions, health and social care as the number of pensioners continues to grow. Savings in the defence and security budgets are no longer possible now that spending has fallen to not much more than the NATO minimum of 2% of GDP, down from in excess of 10% back in the day, while pressures across many other areas of the public sector will make achieving the cost savings already assumed in the forecasts a significant challenge.