My chart this week looks at the changes in the numbers of people between 16 and 64 who are employed, unemployed or economically inactive over the past three years.
According to the Office for National Statistics, on a seasonally adjusted basis the working-age population (ages 16 to 64) comprised 31,366,000 people in employment, 1,297,000 unemployed and 8,675,000 economically inactive in the quarter from June to August 2019.
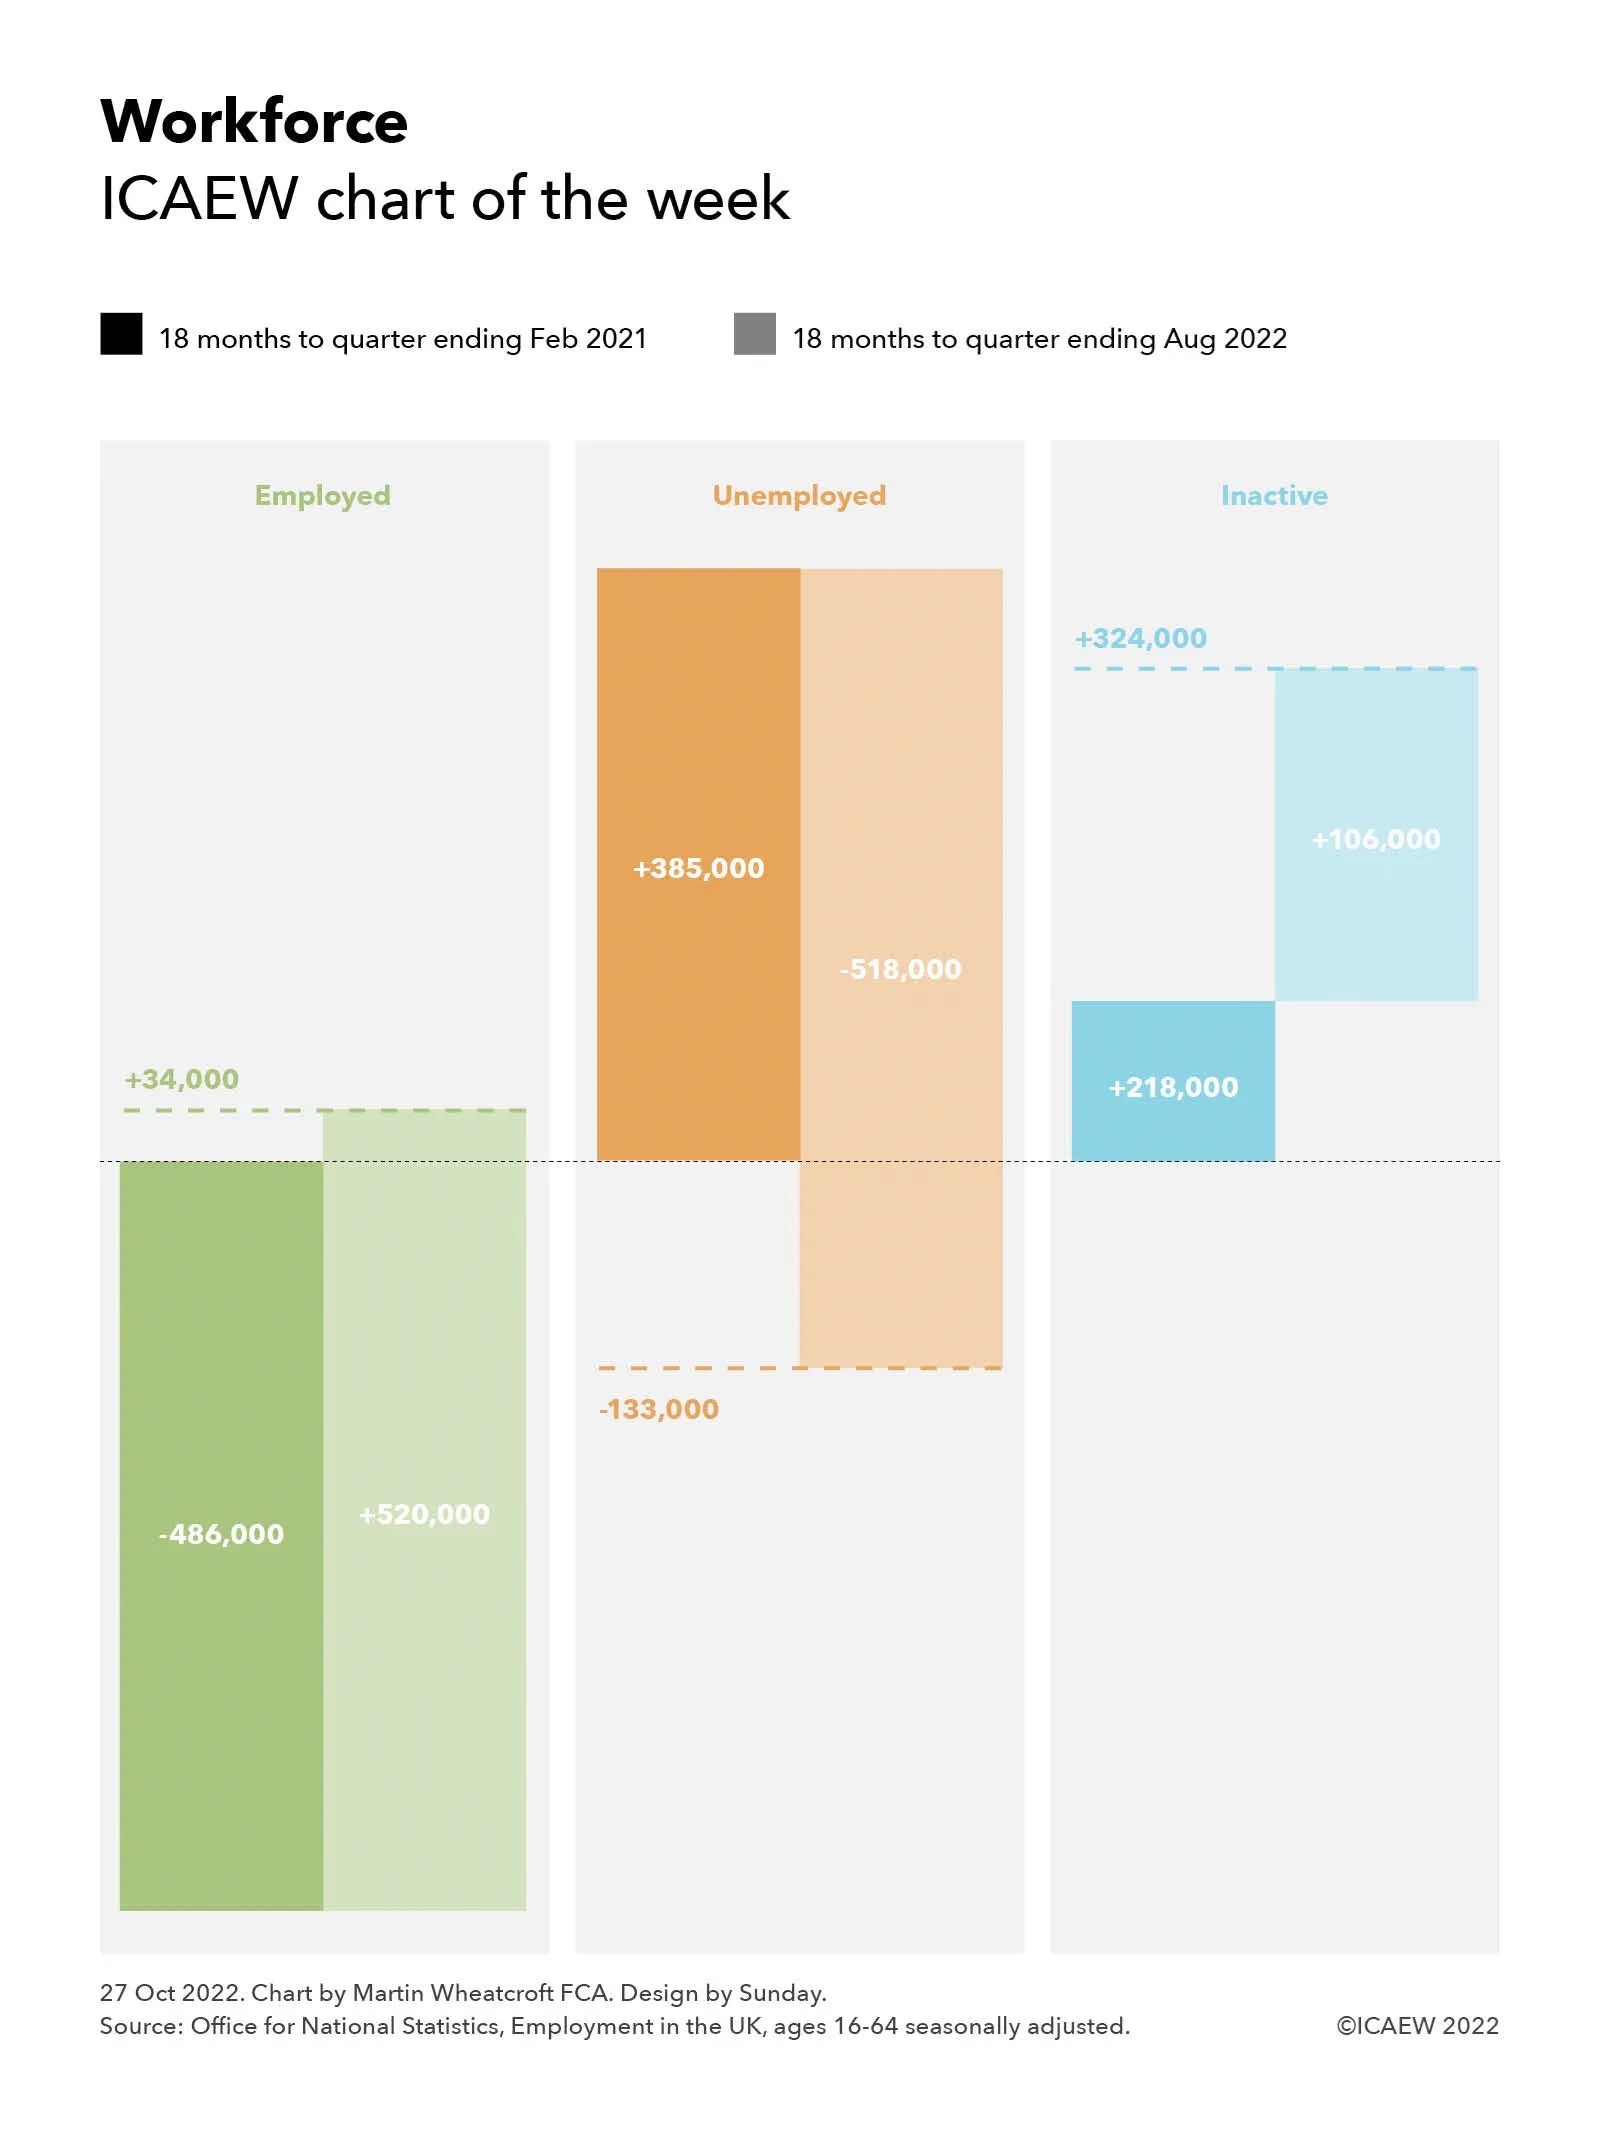
As our chart this week illustrates, the numbers in employment fell by 486,000 over the following 18 months to the quarter from December 2019 to February 2021. Over the same period, there were 385,000 more people aged 16 to 64 recorded as being unemployed and 106,000 more as economically inactive. This was a net increase of just 5,000 as the normal growth in population was offset by migrants returning home at the start of the pandemic and a higher death rate than normal as a consequence of the pandemic.
Over the subsequent 18 months to the quarter from June to August 2022, employment of those between the ages of 16 and 64 recovered as the economy reopened, growing by 520,000, while unemployment fell by 518,000. However, the number economically inactive continued to grow, increasing by a further 218,000.
This resulted in a net movement over the three years of 225,000, comprising 34,000 more people in employment (to 31,400,000 in the quarter ended August 2022), 133,000 fewer unemployed (to 1,164,000), and 324,000 more who were economically active (to 8,999,000).
The numbers who were economically inactive in the June to August 2022 quarter comprised 2,419,000 students (up 103,000 from three years previously), 1,726,000 homemakers (down 254,000), 2,662,000 who were sick (up 424,000), 1,181,000 in early retirement (up 61,000) and 1,011,000 others (down 10,000).
This is not the total workforce, which in the quarter to August 2022 also includes 1,355,000 aged 65 or over in employment (up 27,000 from three years previously), 24,000 who were registered as unemployed (up 7,000) and 10,994,000 economically inactive (up 355,000), the majority of whom were retired.
Not shown in the chart is the change in the number of vacancies, which fell by 188,000 in the 18-month period from 812,000 in the quarter from June to August 2019 to 624,000 in the quarter from December 2020 to February 2021 and then rose by 635,000 over the following 18 months to 1,259,000 in the quarter from June to August 2022, a net movement of +447,000 over three years.
There has been much debate about the rise in the number of people who are categorised as long-term sick, which is believed to be down to a combination of ‘long Covid’ and NHS treatment backlogs.
The big jump in vacancies over the last three years – to a point where there are now more vacancies than the number of people recorded as unemployed – is putting significant pressure on businesses that are struggling to recruit new workers.
This position could change rapidly, however, with many commentators concerned that the cost-of-doing business crisis could result in a sharp rise in unemployment and a fall in vacancies over the next six months as consumers reign back spending in response to energy costs, rapidly rising prices, higher mortgage payments and an increasingly uncertain economic outlook.