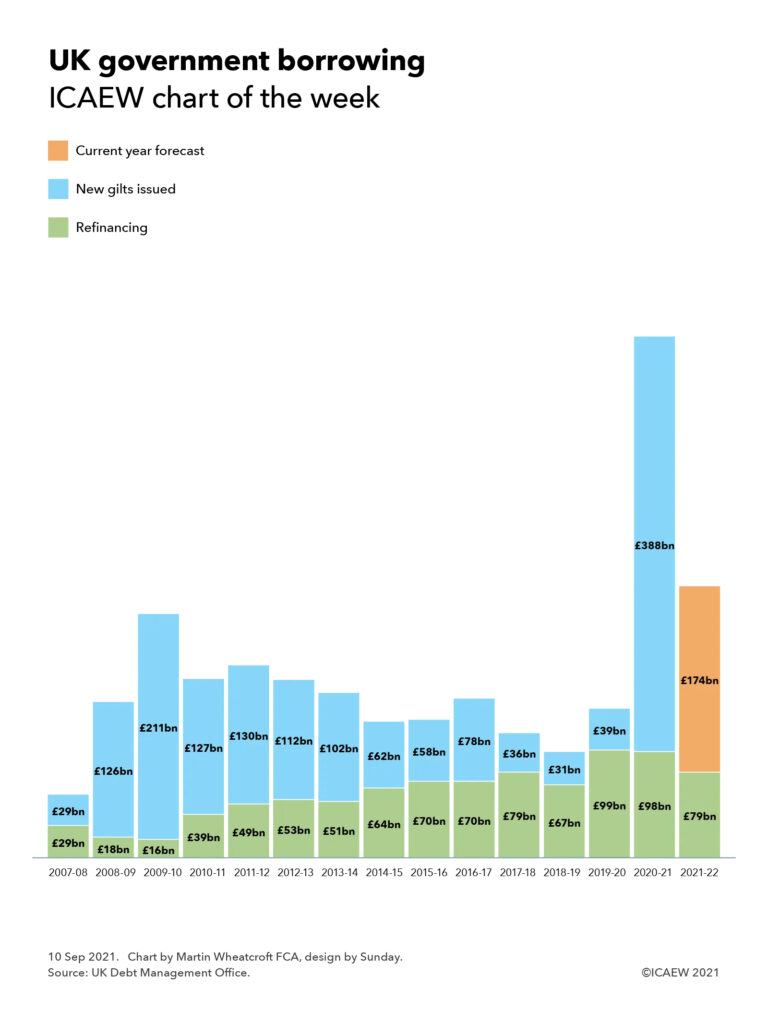
While government borrowing requirements have almost halved from its peak in the last financial year, it is still higher than the financial crisis a decade ago.

Our chart this week is on the topic of government borrowing, which continues at an astonishing pace compared with pre-pandemic times. The UK Debt Management Office has been tasked with raising £253bn from the sale of government securities, comprising £174bn in new finance and £79bn to cover the repayment of existing debts as they fall due. That’s an average of £21bn a month, more than twice the £9.4bn raised in IPOs on the London Stock Exchange in the whole of 2020.
Admittedly, this is a slower pace than the even more astonishing fundraising in 2020-21 that saw £486bn in gilts issued (almost half a trillion pounds), with £98bn raised to repay existing debts and £388bn used to cover the costs of the pandemic and the shortfall in tax receipts it caused.
Despite that, the £253bn needed from the sale of gilts this year is still more than was raised in the 2009-10 financial year during the depths of the financial crisis, the previous peacetime peak. This partly reflects a higher refinancing requirement than a decade ago, one of the legacies of the financial crisis. The legacy of the pandemic will be even higher refinancing requirements into the future, keeping the debt markets busy for decades to come.
The chart does not provide the full story of the UK’s public debt raising, as the Bank of England purchased £450bn of fixed-interest gilts in the market over the last couple of years as part of its quantitative easing operations, in effect swapping the fixed rates of interest payable on the government bonds concerned for the variable rate that is payable on central bank deposits. This has arguably helped the gilt market finance the purchase of such large amounts of government debt and helped keep the cost of government borrowing at extremely low levels but at the cost of significantly increasing the exposure of the public finances to changes in interest rates.
While the government’s financing requirements should be lower in the next few years as the economy recovers, substantial sums will still need to be raised, potentially in much less favourable market conditions. Rising inflation, higher interest rates, and potentially the unwinding of QE, would all combine to increase the cost of borrowing substantially. The days of issuing 30-year gilts at yields of less than 1% may not be with us for much longer.
For more information about the UK’s public debt portfolio, visit the Debt Management Office.
Government gilt sales in 2007-08: £29bn in new gilts + £29 for refinancing; 2008-09: £126bn + £18bn; 2009-10: £211bn + £16bn; 2010-11: £127bn + £39bn; 2011-12: £130bn + £49bn; 2012-13: £112bn + £53bn; 2013-14: £102bn + £51bn; 2014-15: £62bn + £64bn; 2015-16: £58bn + £70bn; 2016-17: £78bn + £70bn; 2017-18: £36bn + £79bn; 2018-19: £31bn + £67bn; 2019-20: £39bn + £99bn; 2020-21: £388bn + £98bn; 2021-22: £174bn (forecast) + £79bn.