Public spend as a share of the economy must fall over the next five years to make the sums add up – a big challenge for the next government.
My recently published in-depth Fiscal Insight into the Spring Budget 2024 highlights how the UK’s public finances are in a weak position, with difficult choices on spending deferred and post-election tax rises likely, irrespective of who wins the general election.
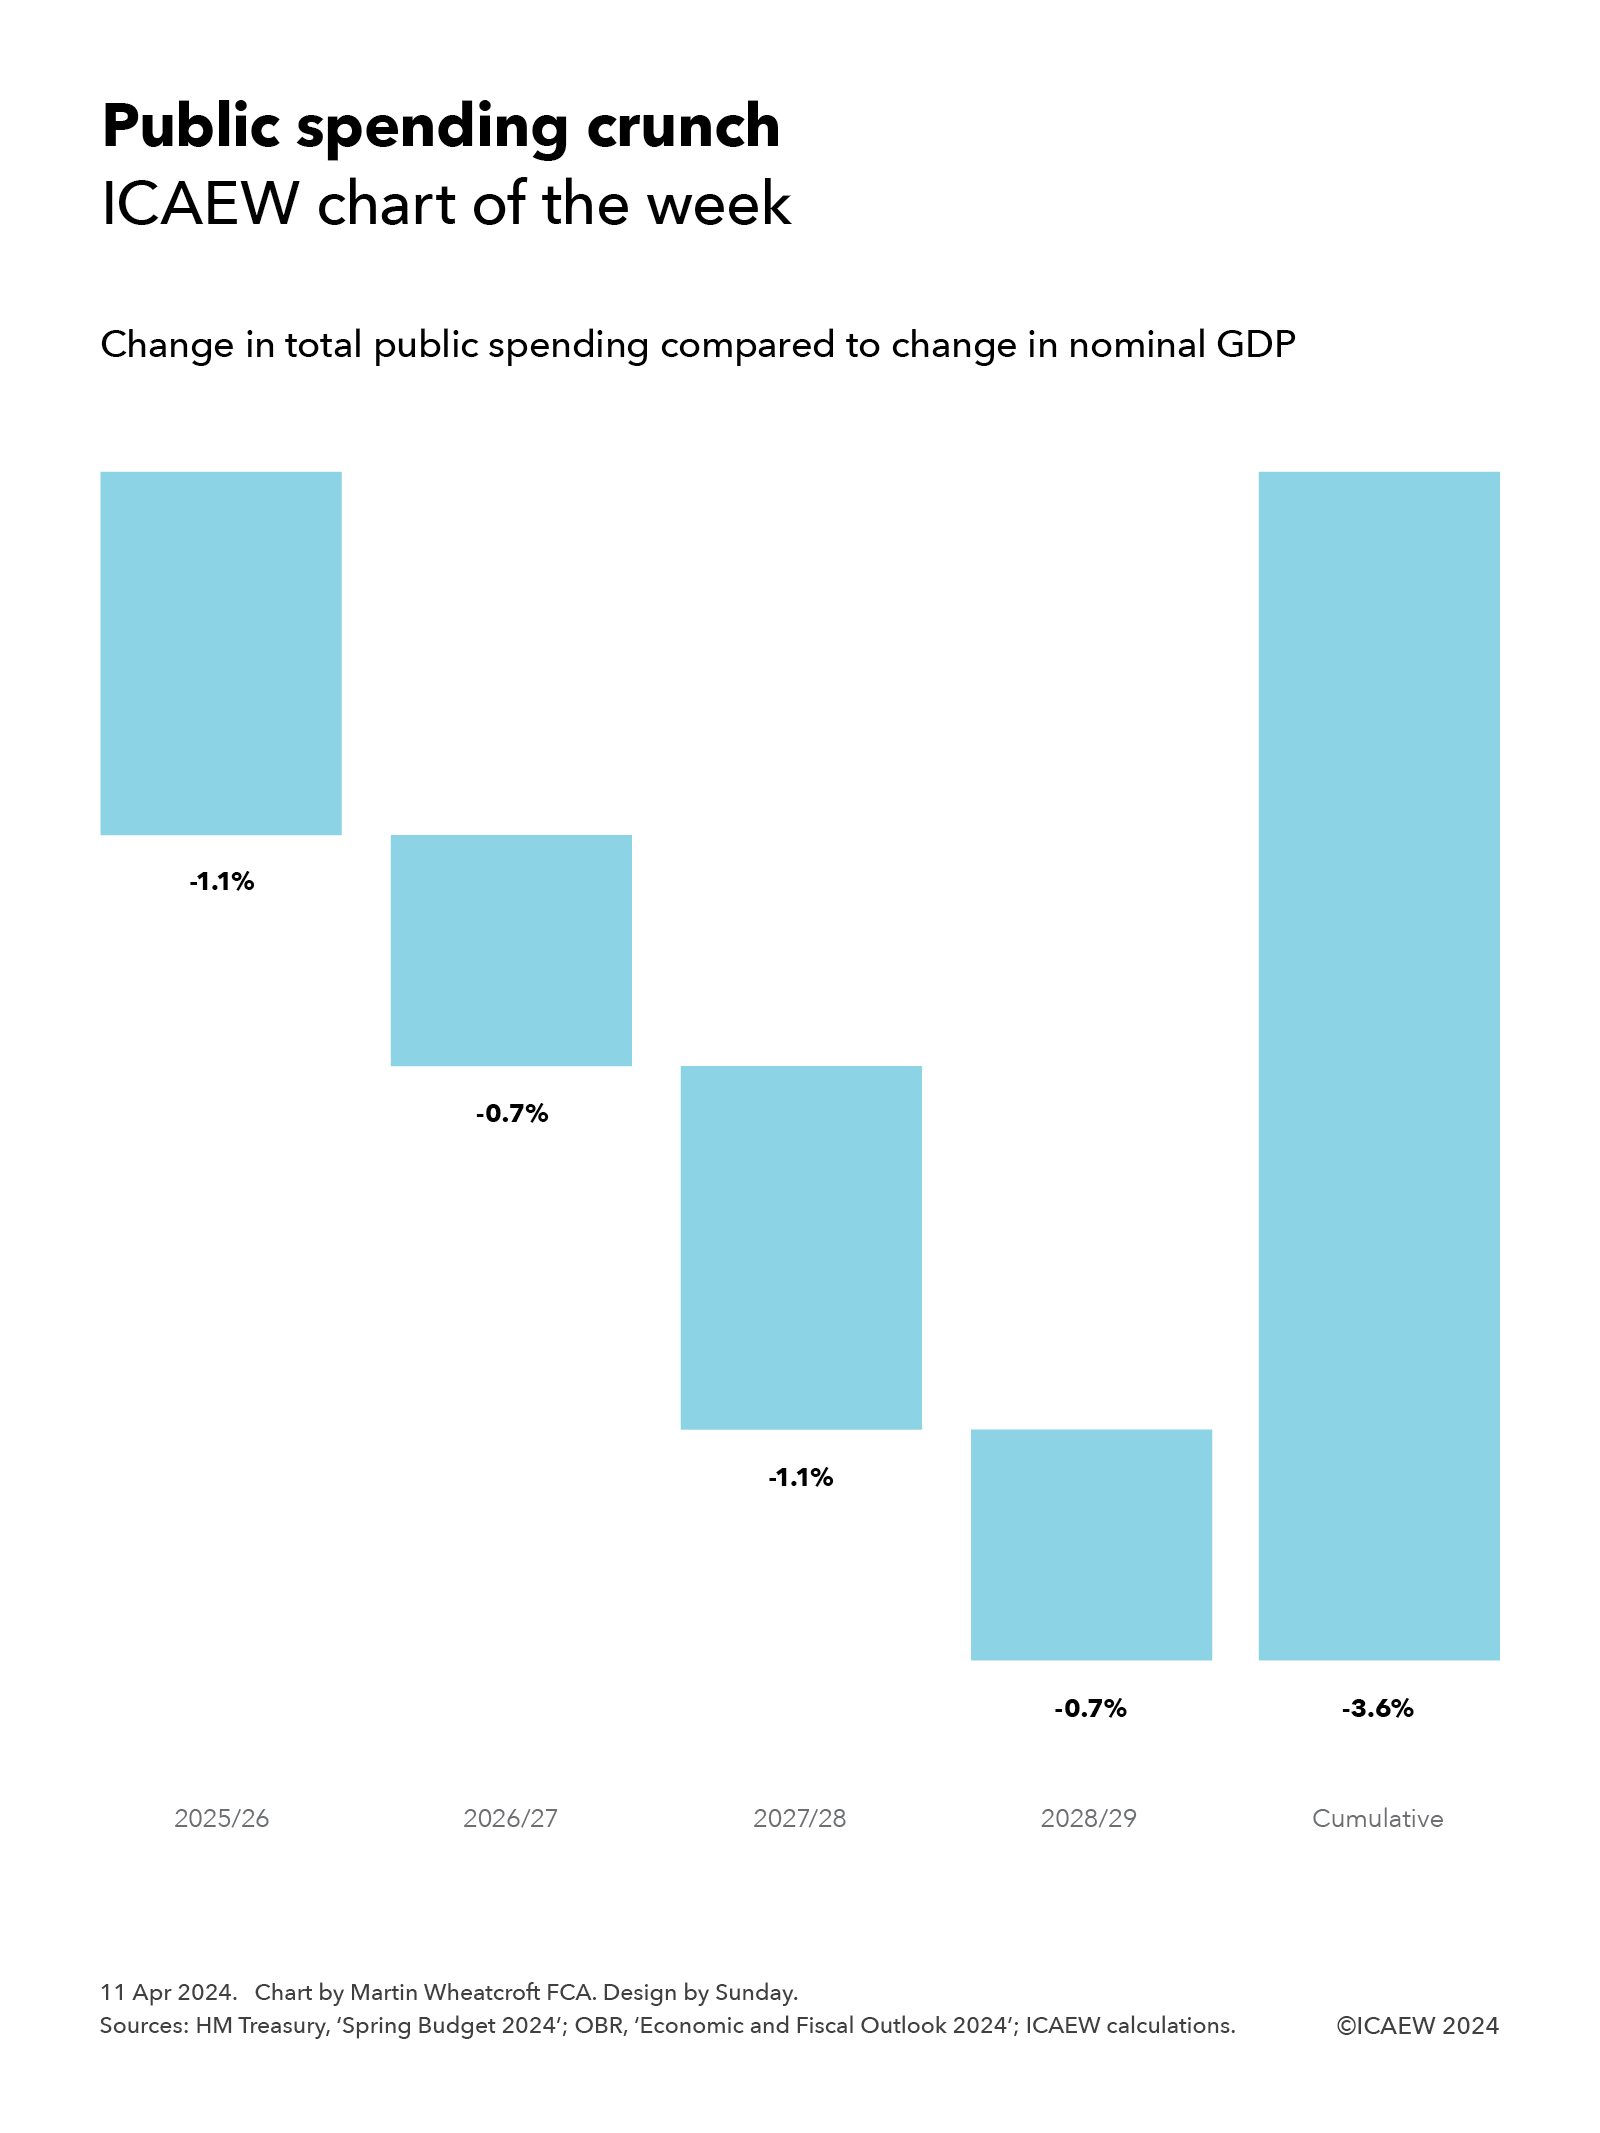
My chart for ICAEW this week illustrates how total public spending is forecast to fall by 3.6% as a share of national income between the first and final year of the fiscal forecast. This is equivalent to a 1.6 percentage point reduction in total managed expenditure from a budget of 44% of GDP in 2024/25 to a forecast of 42.4% of GDP in 2028/29.
At a reduction of 1.1% in 2025/26, 0.7% in 2026/27, 1.1% in 2027/28 and 0.7% in 2028/29, this may not sound that large – after all surely there must be some efficiencies that can be found in a budget of £1.2trn, or £1.4trn by 2028/29?
However, this doesn’t take account of the fact that around half of public spending goes on welfare, health and social care spending, where costs are principally driven by people living longer, the triple-lock state pension guarantee, and increasing levels of ill-health. And another 10% or so goes on interest, where costs are driven by no-longer-very-low interest rates on a growing level of debt.
Nor does it allow for the significant pressures facing many public services that are likely to need additional funding to address. This includes the deteriorating international security situation that has prompted recent calls for defence and security spending to increase from 2% to 3% of GDP, underperformance across a range of public services from the criminal justice system to potholes to HMRC service standards, local authorities that are struggling financially, and crumbling infrastructure (in some cases literally) – among many others. There is also little sign of the scale of investment that would be needed to transform the delivery of public services to achieve sustainable cost reductions while maintaining or improving service quality.
It is perhaps unsurprising that the government decided to postpone the three-year Spending Review scheduled for 2024 until after the general election, given how the Office for Budget Responsibility has highlighted how the 2021 Spending Review led to a departmental spending increase of £32bn a year, or around 1.2% of GDP. A similar revision to current spending plans would have more than absorbed the amounts used for tax cuts in the Autumn Statement 2023 and the Spring Budget 2024, or pushed up borrowing levels even higher than are currently planned.
If we are lucky, there will be more detail on each party’s tax and spending plans in their manifesto documents. Then again…
Now that the dust has settled on last month’s Spring Budget, ICAEW has published a more detailed analysis on the implications for the public finances.
ICAEW’s Fiscal Insight on the Spring Budget 2024 provides an analysis of the key numbers, risks to the Office for Budget Responsibility forecast, tax measures, forecast revisions since the 2023 Autumn Statement, the fiscal position in the 2024/25 Budget year, borrowing over the next five years, the calculation of underlying debt, the £1.2trn that HM Treasury needs to raise from debt investors, and our conclusions on what the numbers mean for the public finances.
Key points highlighted in the report include:
Headlines
Modest improvement in forecasts and small tax increases ‘pay for’ national insurance cut.
Headroom of £9bn against the Chancellor’s primary fiscal rule is tiny compared with risks.
End of low-cost borrowing is hampering investment in infrastructure and public services.
Weak economy, high debt, demographic challenges, underperforming public services.
No long-term fiscal strategy.
Key numbers
Tax and other receipts of £1,139bn in 2024/25, equivalent to £1,375 per person per month.
Public spending of £1,226bn in 2024/25, equivalent to £1,480 per person per month.
Deficit projected to fall by a quarter to £87bn in 2024/25 and gradually to £39bn in 2028/29.
Headline debt expected to reach £2.8trn by March 2025 and £3.0trn by March 2029.
Underlying debt/GDP forecast to increase from 88.8% to 93.2% and then fall to 92.9%.
Conclusions
Difficult choices on spending deferred until after the general election.
Post-election tax increases likely, irrespective of who wins the general election.
A badly designed fiscal rule driving poor decisions and unrealistic spending forecasts.
Predicted reduction in the deficit to below 2% of GDP by 2027/28 is unlikely to occur.
Further pre-election tax cuts could affect credibility with debt markets.
Alison Ring OBE FCA, ICAEW Director for Public Sector and Taxation, is quoted in the Fiscal Insight as follows:
“The principal story of the Spring Budget has been how the Chancellor was able to find room for tax cuts while still meeting his fiscal targets to ‘bring down debt and the deficit’.
“This is a frustrating narrative as it misses the bigger picture of public finances that are on an unsustainable path, with little sign of a long-term fiscal strategy to address demographic change, growing balance sheet liabilities, underperforming public services, rising debt interest, or resilience against future economic shocks.
“Debt is high and projected to be even higher in five years’ time than it is today. ‘Headroom’ is tiny in context of trillions of pounds of tax receipts and public spending over the next five years and forecasts that don’t reflect government practice in freezing fuel duties nor likely spending increases from the now postponed Spending Review.
“And we have a fiscal target that discourages essential infrastructure investment while at the same time never needing to be achieved as it is rolled forward each year.
“All of our fiscal eggs are now in a basket labelled ‘hope’ [for economic growth].”
Fiscal Insight
Read the full Fiscal Insight report, which provides detailed analysis on the Spring Budget’s implications for the public finances.
My chart for ICAEW this week looks at how liabilities in the UK’s public balance sheet have risen significantly over the five years to March 2022.
HM Treasury published the Whole of Government Accounts (WGA) 2021/22 on 26 March 2024, just under two years after the balance sheet date. This is a significant improvement from the 27 months it took to publish the 2020/21 edition, but is still a lot longer than the nine or 10 months HM Treasury is aiming for in the medium term, or the four months or less that it generally takes listed companies to publish their consolidated financial statements.
WGA are consolidated financial statements for more than 10,000 or so organisations in the UK public sector, including central government departments, devolved administrations, regional and local authorities, the Bank of England and other public corporations, government agencies, schools, hospitals, police and fire services, transport authorities and other public bodies. They are prepared in line with international generally accepted accounting practice – International Financial Reporting Standards – different to the statistical standards used by governments to report fiscal numbers in National Accounts.
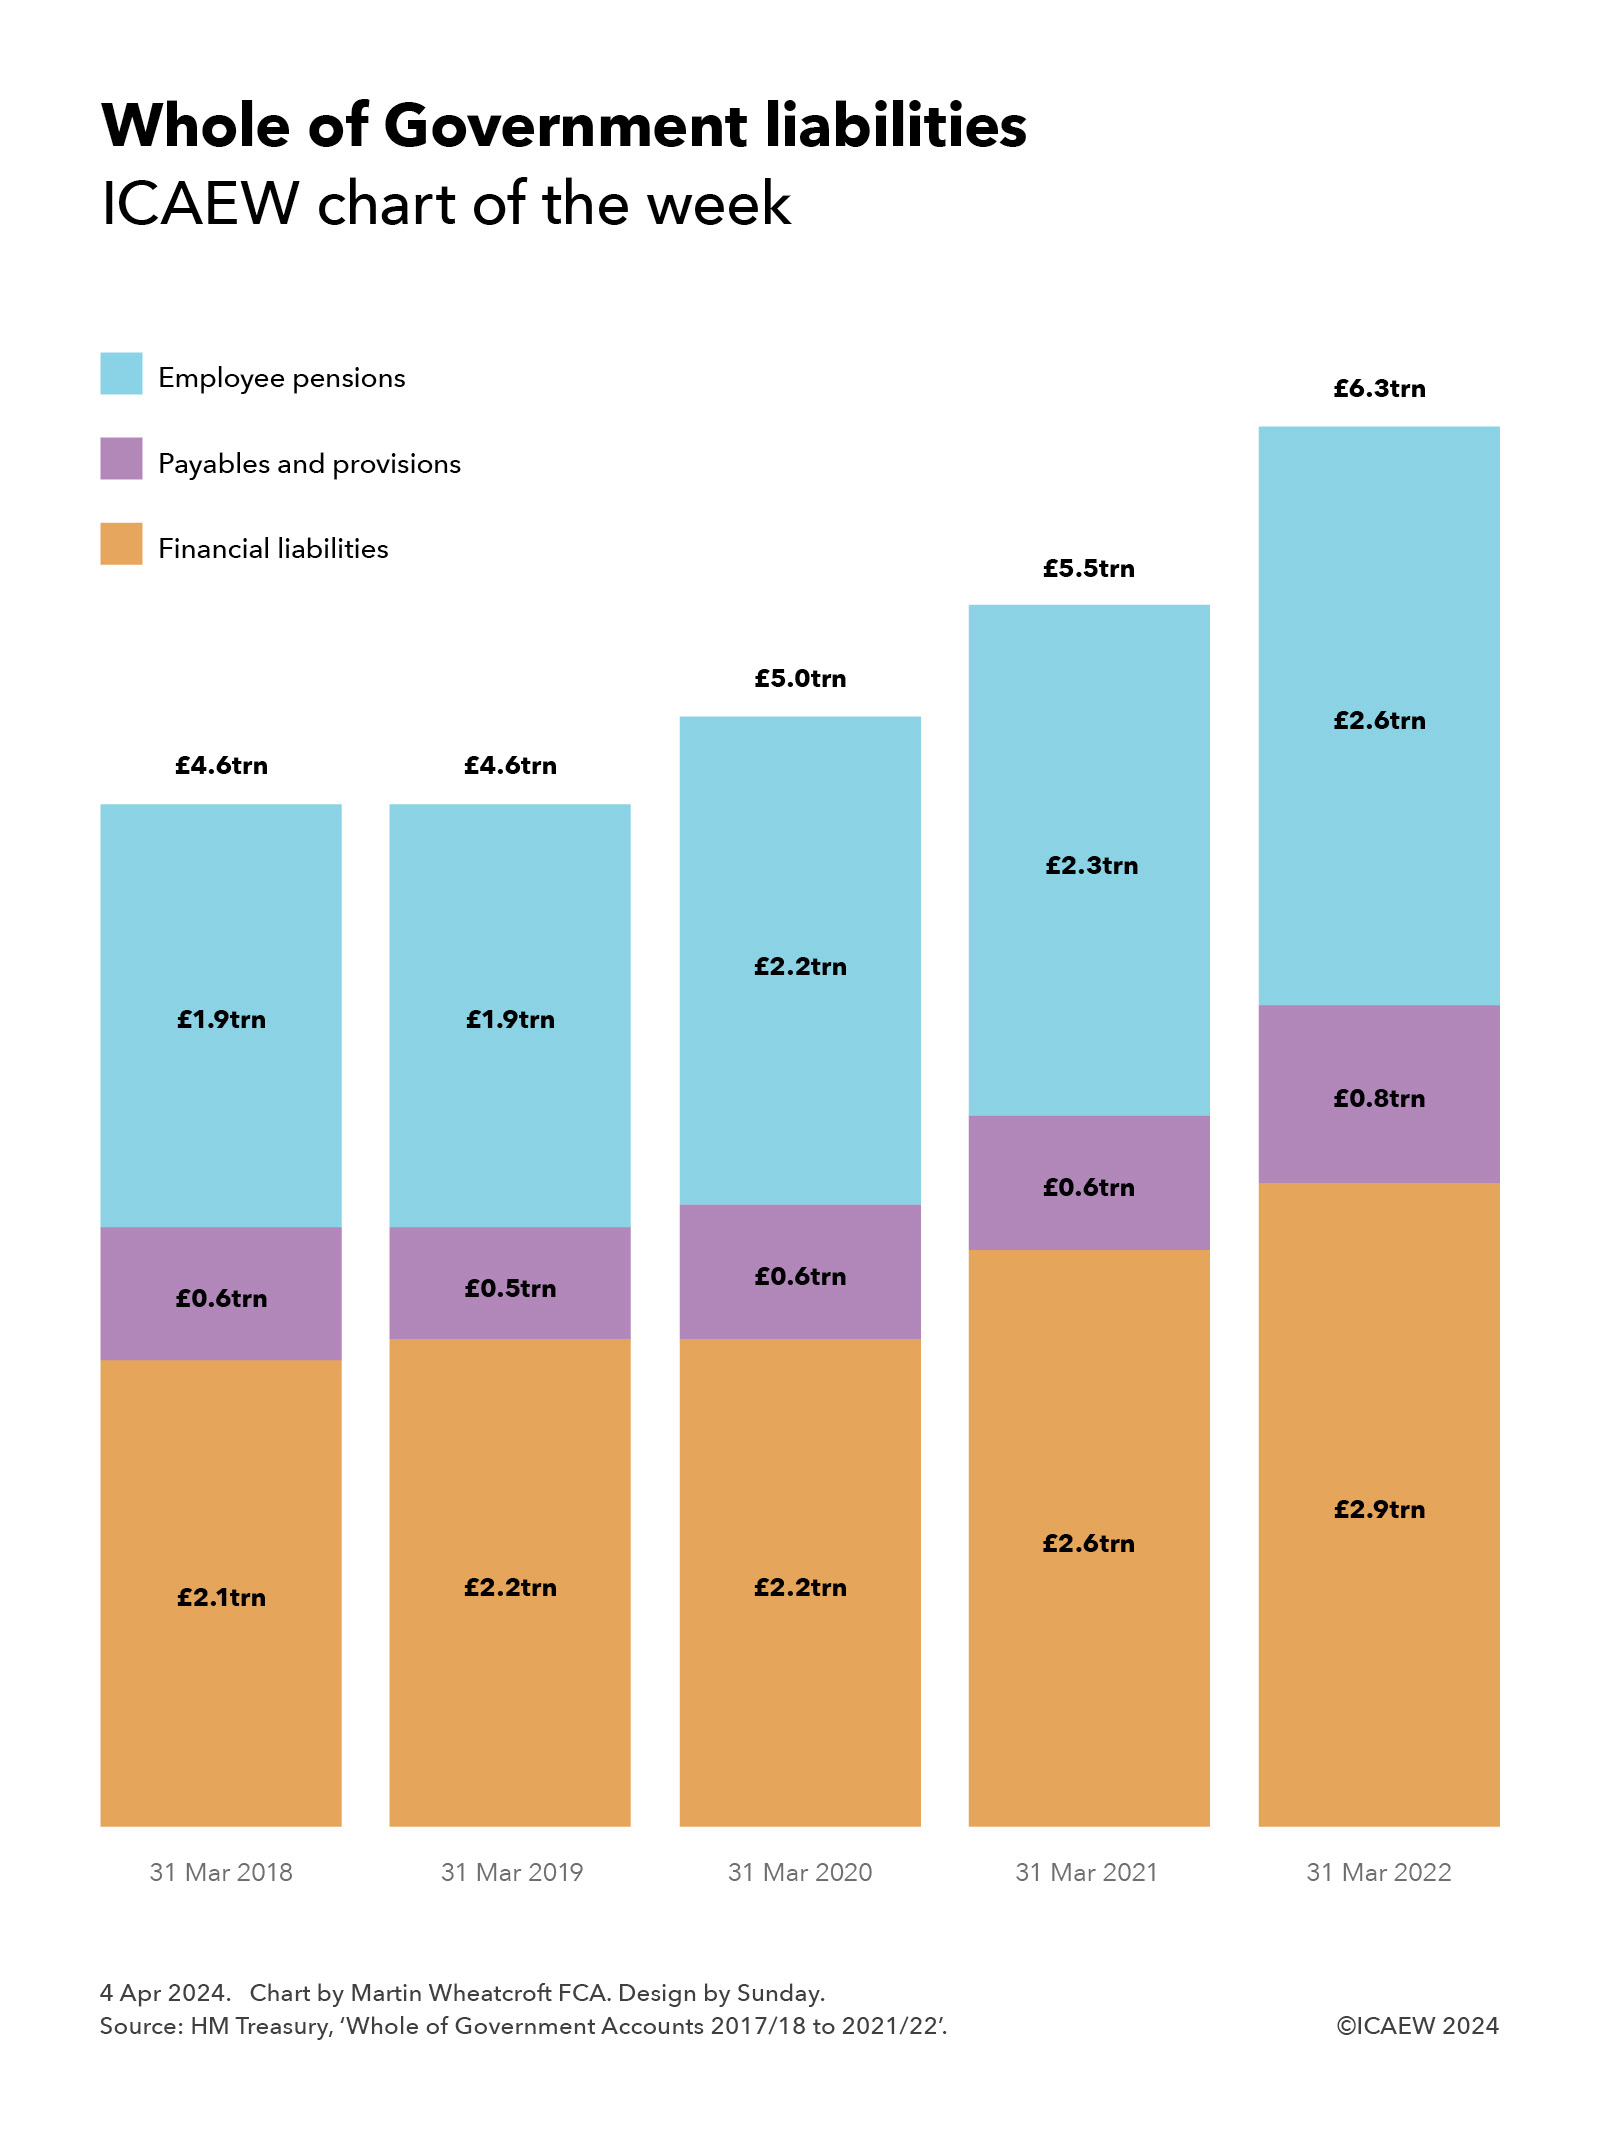
My chart for ICAEW illustrates how the liability side of the balance sheet has grown over the five-year period, from £4.6trn on 31 March 2018 and 2019 to £5trn on 31 March 2020, £5.5trn on 31 March 2021 and £6.3trn on 31 March 2022.
This reflects how debt liabilities increased from £2.1trn to £2.9trn over that time, with huge sums borrowed in 2020/21 and 2021/22 during the coronavirus pandemic.
The other big liability in the balance sheet is the net pension obligation for public sector employees, which was £1.9trn on 31 March 2018 but had risen to £2.6trn by 31 March 2022, with falling discount rates a key factor in that rise. The latter comprises liabilities of £2.5trn for unfunded pension schemes and net liabilities of £0.1trn (£0.5trn liabilities less £0.4trn in assets) for local government and other funded pension schemes.
The balance sheet does not include the much larger commitment to pay the state pension, which as a welfare benefit is accounted for when incurred.
Total liabilities of £6.3trn on 31 March 2022 are equivalent to £93,000 per person in the UK, comprising £43,000 in financial liabilities, £11,000 in payables and provisions, and £39,000 in for public sector employee pensions.
Not shown in the chart is the asset side of the balance sheet, with assets of £2.4trn on 31 March 2022 or £36,000 per person, comprising fixed assets of £1.4trn (£20,500 per person), investments of £0.5trn (£7,000), receivables and other of £0.2trn (£3,500) and cash and other financial assets of £0.3trn (£5,000). This results in an overall net liability position of £3.9trn or £57,000 per person on 31 March 2022.
The good news is that HM Treasury is working hard to reduce the delays in producing the WGA, which means it shouldn’t be too long before we discover what is in the 31 March 2023 balance sheet. This is expected to show an improvement, as although the government has continued to borrow, pushing up financial liabilities, the net present value of pension obligations and provisions should fall significantly as discount rates have risen sharply since March 2022.
My chart for ICAEW this week looks at how retail sales have increased by 19.5% over the past five years, comprising a 1.4% fall in volumes and a 21.2% increase in prices.
The latest statistics from the Office for National Statistics (ONS) up to February 2024 highlight how retail sales in Great Britain (England, Wales and Scotland) have been on a rollercoaster ride over the past five years as the pandemic, then the cost-of-living crisis, battered the economy.
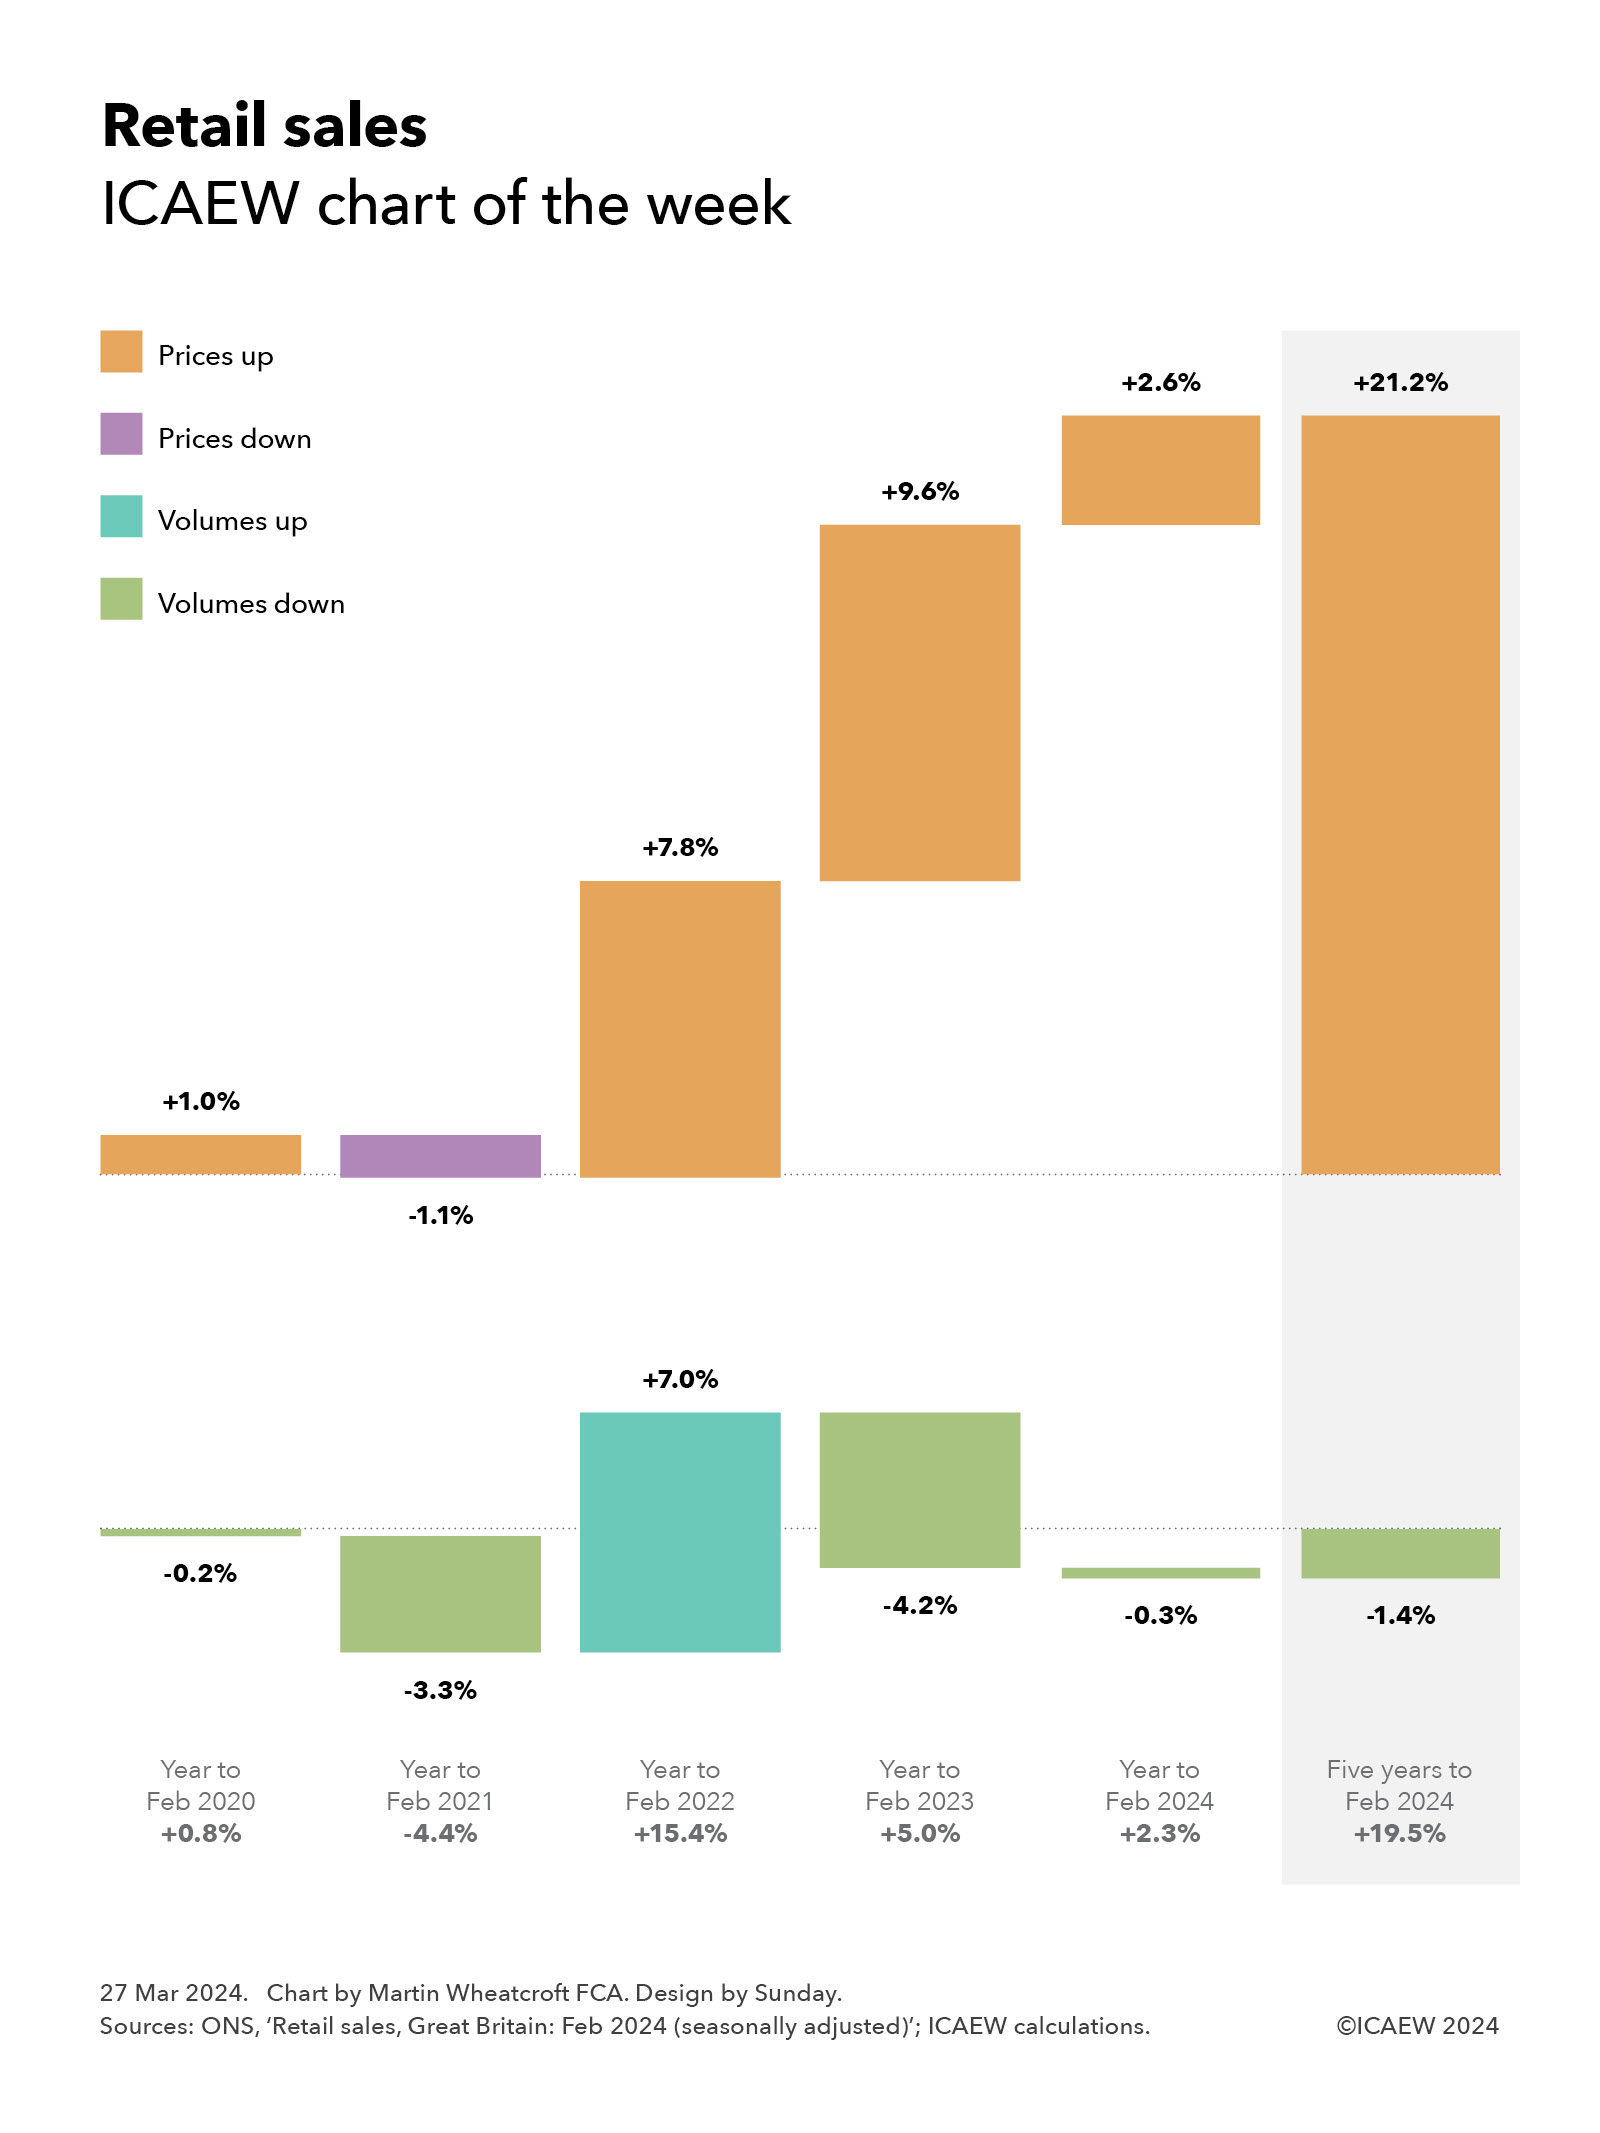
As our chart of the week illustrates, changes in retail sales can be split between volumes and prices, with growth in retail sales of 19.5% over the five years to February 2024 consisting of a 1.4% fall in volumes and a 21.2% increase in prices.
Our chart also shows how retail sales have increased by year, starting with a 0.8% increase in retail sales in the year to February 2020 (from a 0.2% fall in volumes and a 1% increase in prices) before the first pandemic lockdown the following month. That first year of the pandemic to February 2021 resulted in a 4.4% decline in sales (a 3.3% fall in volumes and a 1.1% reduction in prices) as we cut back on spending, followed by a massive 15.4% jump in retail sales in the year to February 2022 (7% from higher volumes and 7.8% from higher prices) as the nation emerged and started to spend heavily.
The cost-of-living crisis was behind a 5% increase in retail sales in the year to February 2023, as although prices rose 9.6% as inflation accelerated, households cut back on what they bought in response to drive a 4.2% fall in retail volumes.
Retail sales were up by a more modest 2.3% in the year to February 2024, comprising a 0.3% fall in volumes and a 2.6% increase in prices as inflation moderated.
Evening out the ups and downs gives an average increase in retail sales of 3.6% a year over the last five years, comprising an average fall of 0.3% a year in volumes and an average increase of 3.9% in prices.
This is not as positive a picture for retail business as the numbers might imply. Although it appears that retailers are selling slightly less overall at much higher prices, our chart doesn’t reflect the substantial increases many have seen in their input costs over the same period.
For more ICAEW analysis on the economy, click here.
Only a small improvement in the year-to-date deficit of £107bn reported in the penultimate monthly public finance release for 2023/24 over the same period a year ago.
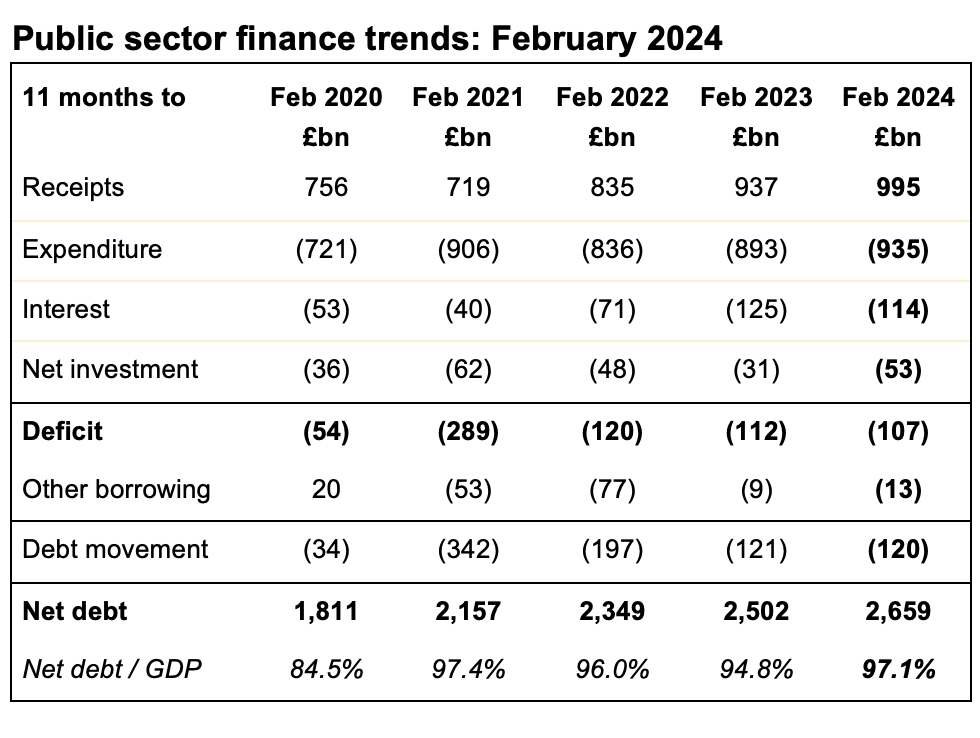
The monthly public sector finances for February 2024 released by the Office for National Statistics (ONS) on Thursday 21 March 2024 reported a provisional deficit for the month of £8bn, while at the same time revising the year-to-date deficit up by £2bn. This increased the cumulative deficit for the first 11 months of the financial year to £107bn, £5bn less than in the same period last year.
The deficit for the first 11 months of 2023/24 is slightly ahead of the £114bn full-year estimate made by the Office for Budget Responsibility (OBR) in its latest fiscal forecasts that accompanied the Spring Budget 2024 earlier this month.
Alison Ring OBE FCA, ICAEW Director of Public Sector and Taxation, said: “The numbers for February saw the public finances return to deficit following January’s self-assessment-driven surplus, bringing the cumulative deficit to £107bn for the first 11 months of the financial year. This is a £5bn improvement on the same period last year, with lower cost of living support payments and lower interest on index-linked debt as inflation has fallen, but it is still higher than is comfortable.
“Chancellor Jeremy Hunt’s aim to cut the deficit by a quarter to £87bn in the coming financial year will be challenging to achieve given much-higher-than-inflation rises to the state pension, benefits and the minimum wage, while pressure to find extra money for defence, local government and public services is only likely to grow as the general election approaches.”
Month of February 2024
The fiscal deficit of £8bn for the month was £3bn lower than in February 2023, but slightly higher than some predictions.
Taxes and other receipts amounted to £95bn, up 8% compared with the same month last year, while total managed expenditure was 4% higher at £103bn.
Public sector net debt as of 31 January 2024 was £2,659bn or 97.1% of GDP, £12bn higher than at the start of the month and £120bn higher than at the start of the financial year.
Eleven months to February 2024
The provisional shortfall in taxes and other receipts compared with total managed expenditure for the first 11 months of the 2023/24 financial year to February 2024 was £107bn, £5bn less than the amount reported for the first 11 months of 2022/23.
This reflected a year-to-date shortfall between tax and other receipts of £995bn and total managed expenditure of £1,102bn, each up 6% compared with the corresponding numbers for April 2022 to February 2023.
Inflation benefited tax receipts for the first 11 months compared with the same period in the previous year, with income tax up 11% to £249bn and VAT up 6% to £181bn. Corporation tax receipts were up 18% to £93bn, partly reflecting the increase in the corporation tax rate from 19% to 25% from 1 April 2023, while national insurance receipts were up by just 1% to £163bn as the abolition of the short-lived health and social care levy in 2022/23 offset the effect of wage increases in the current financial year, in addition to the cut in employee national insurance implemented in January. Council tax receipts were up 6% to £39bn, but stamp duty on properties was down by 24% to £12bn, while the total for all other taxes was up by just 1% at £153bn as economic activity slowed. Non-tax receipts were up 10% to £105bn, primarily driven by higher investment income and higher interest charged on student loans.
Total managed expenditure of £1,102bn in the 11 months to February 2024 can be analysed between current expenditure excluding interest of £935bn, interest of £114bn and net investment of £53bn, compared with £1,049bn in the same period in the previous year, comprising £893bn, £125bn and £31bn respectively.
The increase of £42bn or 5% in current expenditure excluding interest was driven by a £33bn increase in pension and other welfare benefits (including cost-of-living payments), £19bn in higher central government pay, and £11bn in additional central government procurement spending, less £18bn in lower subsidy payments (principally relating to energy support schemes) and £3bn in net other changes.
The fall in interest costs for the 11 months of £11bn or 9% to £114bn comprises a £23bn or 46% reduction to £27bn for interest accrued on index-linked debt as the rate of inflation fell, partially offset by a £12bn or 16% increase to £87bn from higher interest rates on variable-rate debt and new and refinanced fixed-rate debt.
The £22bn increase in net investment spending to £53bn in the first 11 months of the current financial year is distorted by a one-off credit of £10bn arising from changes in interest rates and repayment terms of student loans recorded in December 2022. Adjusting for that credit, the increase of £12bn reflects high construction cost inflation amongst other factors that saw a £16bn or 17% increase in gross investment to £112bn, less a £4bn or 7% increase in depreciation to £59bn.
Screenshot
The cumulative deficit of £107bn for the first 11 months of the financial year is £5bn below the OBR’s November 2023 forecast of £112bn for the same period but slightly higher than it should be to be consistent with the updated £114bn full year estimate for 2023/24 in its March 2024 forecast.
The OBR’s March 2024 forecast predicts an £87bn deficit in the next financial year commencing in April (2024/25) a reduction of approximately a quarter compared with the current financial year.
Balance sheet metrics
Public sector net debt was £2,659bn at the end of February 2024, equivalent to 97.1% of GDP.
This is an increase since the start of the financial year of £120bn, comprising borrowing to fund the deficit for the 11 months of £107bn plus an additional £13bn of borrowing to fund lending to students, businesses and others, net of loan repayments and working capital movements.
Public sector net debt is £844bn more than the £1,815bn reported for 31 March 2020 at the start of the pandemic and £2,124bn more than the £535bn number as of 31 March 2007 before the financial crisis, reflecting the huge sums borrowed over the last couple of decades.
Public sector net worth, the new balance sheet metric launched by the ONS this year, was -£668bn on 29 February 2024, comprising £1,596bn in non-financial assets and £1,062bn in non-liquid financial assets minus £2,659bn of net debt (£319bn liquid financial assets – £2,977bn public sector gross debt) and other liabilities of £667bn. This is a £65bn deterioration from the -£613bn reported for 31 March 2023.
Revisions
Caution is needed with respect to the numbers published by the ONS, which are expected to be repeatedly revised as estimates are refined and gaps in the underlying data are filled.
The latest release saw the ONS revise the reported deficit for the 10 months to January 2024 up by £2bn as estimates of tax receipts and expenditure were updated for better data, as well as revise the calculation of the public sector net debt to GDP ratio at 31 January 2024 from 96.5% to 96.8% as GDP estimates were updated in line with the latest OBR forecasts.
The ONS also revised its estimate for the deficit for the financial year to March 2023 (2022/23), down by £1bn to £128bn.
The Bank of England Monetary Policy Committee held interest rates constant at its latest meeting, despite CPI falling to 3.4% in February and core inflation dropping to 4.5%.
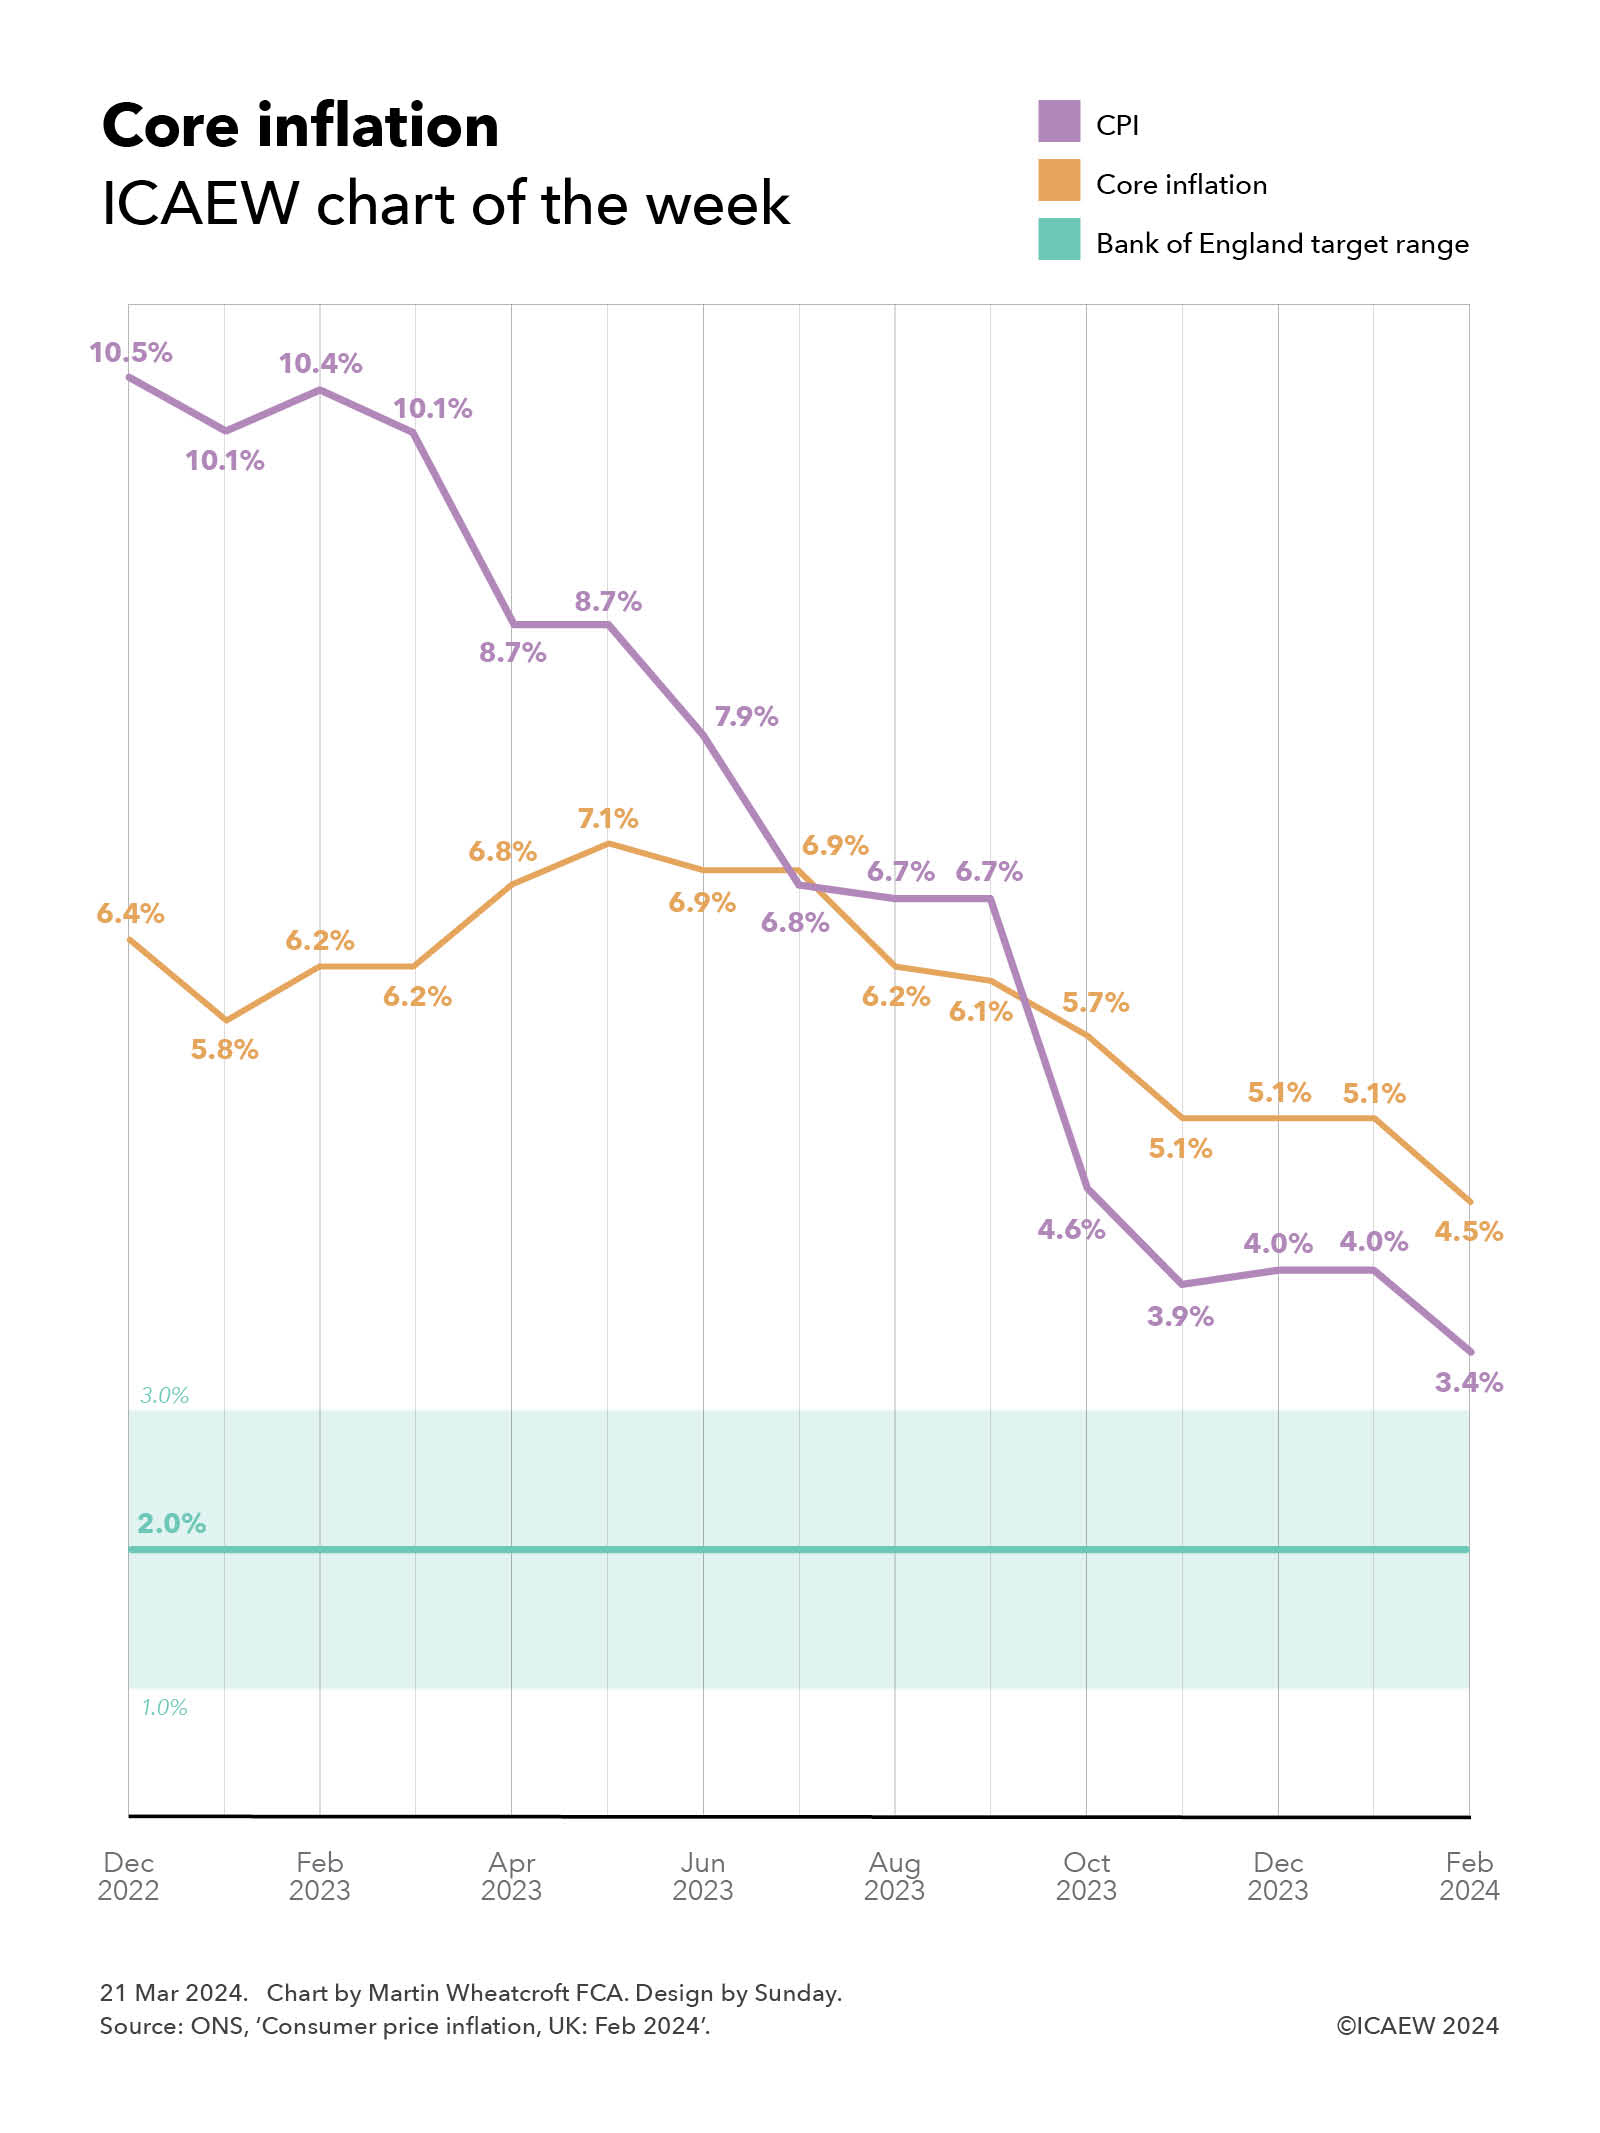
The Office for National Statistics reported its latest estimates for inflation on Wednesday 20 March 2024, with both annual consumer price inflation (CPI) and annual consumer price inflation excluding food, alcohol, tobacco and energy (core inflation) in February falling by 0.6 percentage points to 3.4% and 4.5% respectively.
Our chart this week illustrates how CPI fell from 10.5% in the year to December 2022 to 4% in December 2023 and to 3.4% in February 2024, a rapid decline in the headline measure. This contrasts with the annual rate of core inflation, which increased from 6.4% in December 2022 to a peak of 7.1% in May 2023, before declining more gradually to 5.1% in December 2023 and to 4.5% in February 2024.
Annual food price inflation (5% in February 2024), alcohol and tobacco (11.9%), and energy prices (-13.8%) are of course many of the prices that we as consumers notice the most – what we buy in the supermarket, off-licence, at the fuel pump, or pay to heat and power our homes. However, food, alcohol, tobacco and energy prices are often very volatile and so core inflation allows us to understand what is happening to the (generally less volatile) prices of the other 78% of the things we buy as measured by the CPI Index.
The drop in core inflation to 4.5% is a positive sign for the Monetary Policy Committee, even if it didn’t reduce interest rates at its most recent meeting on Thursday 21 March 2024. The headline measure of CPI is coming down, and is expected to fall further over the next few months as large food price increases a year ago drop out of the annual comparison, a factor that won’t affect core inflation directly.
Policymakers are expected to remain cautious about cutting interest rates for several more months, as they will want to see how inflationary the scheduled increases in April of 9.8% in the minimum wage, 8.5% in the state pension and 6.7% in universal credit and other welfare benefits will be. Salaries are a significant input cost for the majority of businesses and it is likely that many will seek to pass on higher salary costs to their customers, while higher spending by pensioners and those in receipt of benefits could start to push up prices again just at the point that the Bank of England hopes to have brought inflation under control.
While there is likely to be much celebration and declaration of victory once the headline CPI measure drops into the target range over the next few months, how long it takes to bring down core inflation to within the target range is likely to be a better indicator of whether inflation has actually been tamed.
For more ICAEW analysis on the economy, click here.
My chart for ICAEW this week takes a look at how average earnings have risen over the last decade and how they compare with the headline rate of inflation.
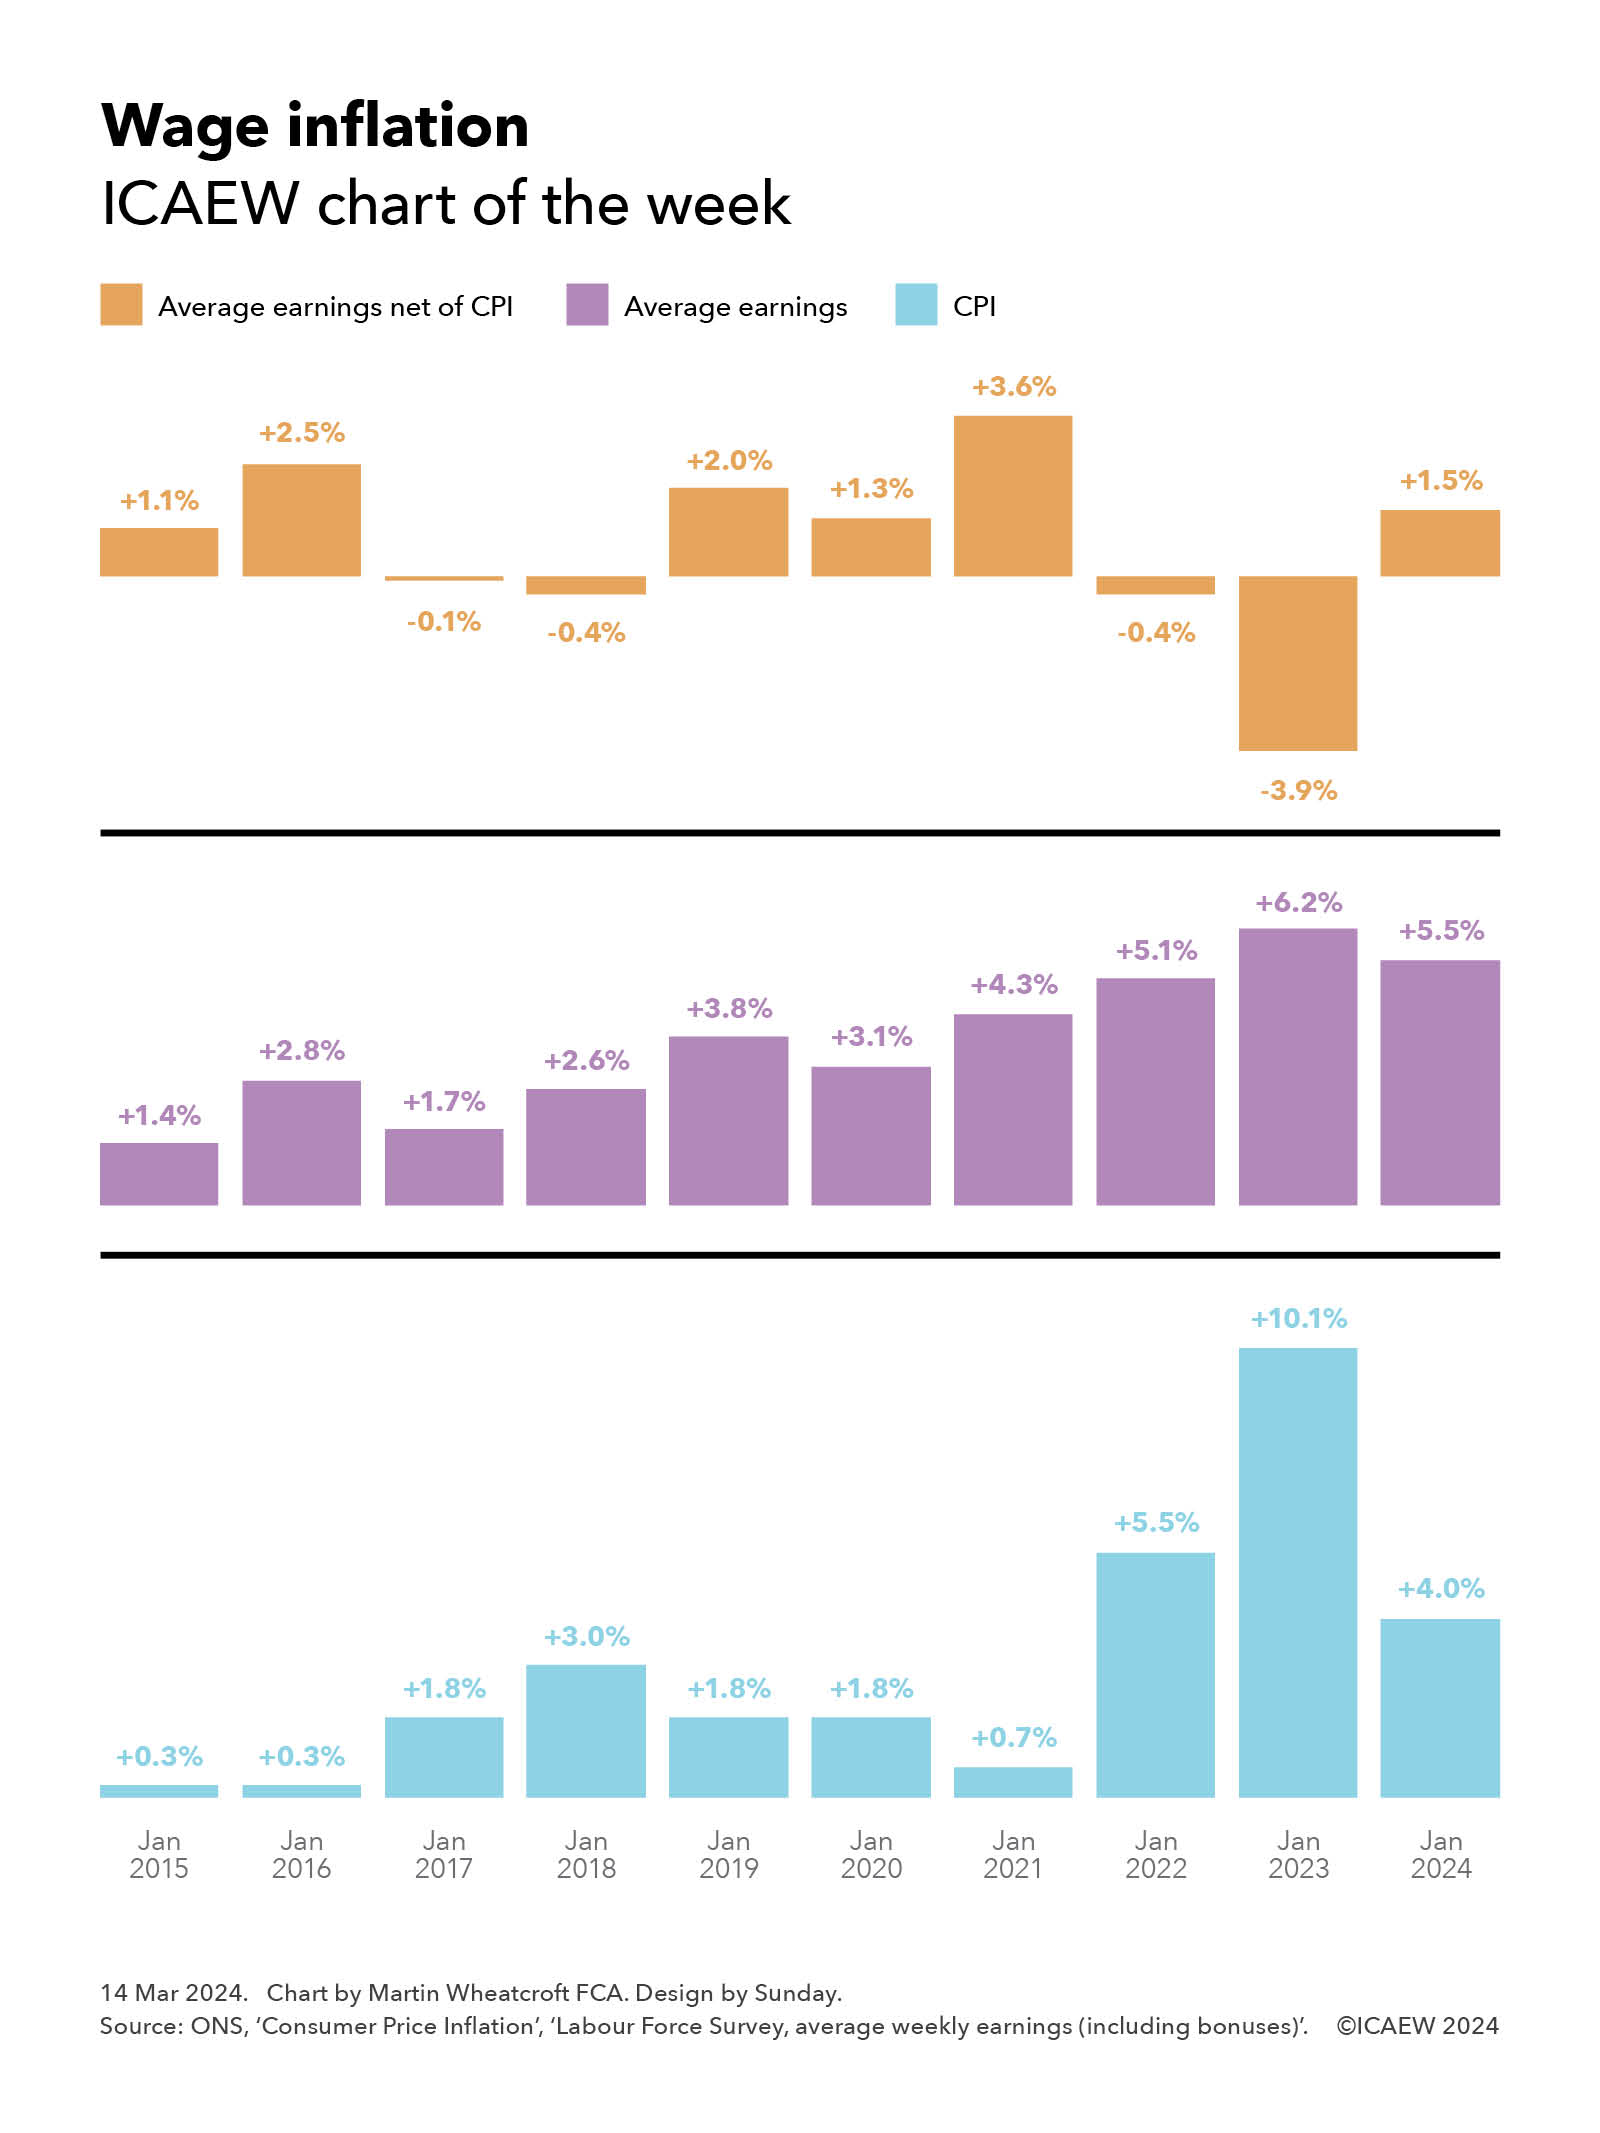
According to the Office for National Statistics (ONS), average weekly earnings including bonuses on a seasonally adjusted basis increased by 5.5% between January 2023 and January 2024 to £672 (equivalent to £2,912 per month). This is 1.5 percentage points higher than the rate of consumer price inflation (CPI) over the same 12-month period of 4.0%.
While this might seem positive for the theoretical ‘average’ worker, this follows a 6.2% increase in the preceding year to January 2023, 3.9 percentage points lower than the corresponding 10.1% increase in consumer prices.
Our chart this week takes these numbers back a decade, with CPI of 0.3%, 0.3%, 1.8%, 3.0%, 1.8%, 1.8%, 0.7%, 5.5%, 10.1% and 4.0% respectively in the years from January 2015 through to January 2024. Average earnings increased by 1.4%, 2.8%, 1.7%, 2.6%, 3.8%, 3.1%, 4.3%, 5.1%, 6.2% and 5.5% respectively over the same period, giving rise to net differences of +1.1%, +2.5%, -0.1%, -0.4%, +2.0%, +1.3%, +1.3%, +3.6%, -0.4%, -3.9% and +1.5%.
Overall, wages have increased faster than inflation over the last decade, up 43.2% compared with a 32.8% increase in the CPI Index, equivalent to average rises of 3.7% a year and 2.9% a year respectively – or a net 0.8 percentage point a year improvement in average wages over CPI.
Private sector wages have risen faster at 45.7% over ten years (3.8% a year on average), while public sector wages have gone up by 33.7% (2.9% a year on average), only marginally ahead of CPI (by 0.07% a year). Of course, averages are just that and individual and household experiences will differ significantly.
This comparison would not be approved of by the statistical authorities, who prefer the consumer prices including housing (CPIH) measure of inflation to headline CPI. However, CPIH was up 31.7% over the past decade to January 2024 (or 2.8% a year on average), so while the numbers might have been slightly different in individual years if we had used CPIH in the chart, the increase in average wages over 10 years is only slightly better – by 1.1% in total or 0.1% a year on average.
Assuming inflation falls to below 2% later this year as predicted, the picture for the coming year is likely to show a significant positive variance for earnings, especially given the 9.8% increase in the minimum wage scheduled for April. This should have the effect of pushing up average earnings, unless something very surprising happens to wages further up the income scale.
For more ICAEW analysis on the economy, click here.
Our chart this week takes a look at the effect of the Spring Budget 2024 on the public finances.
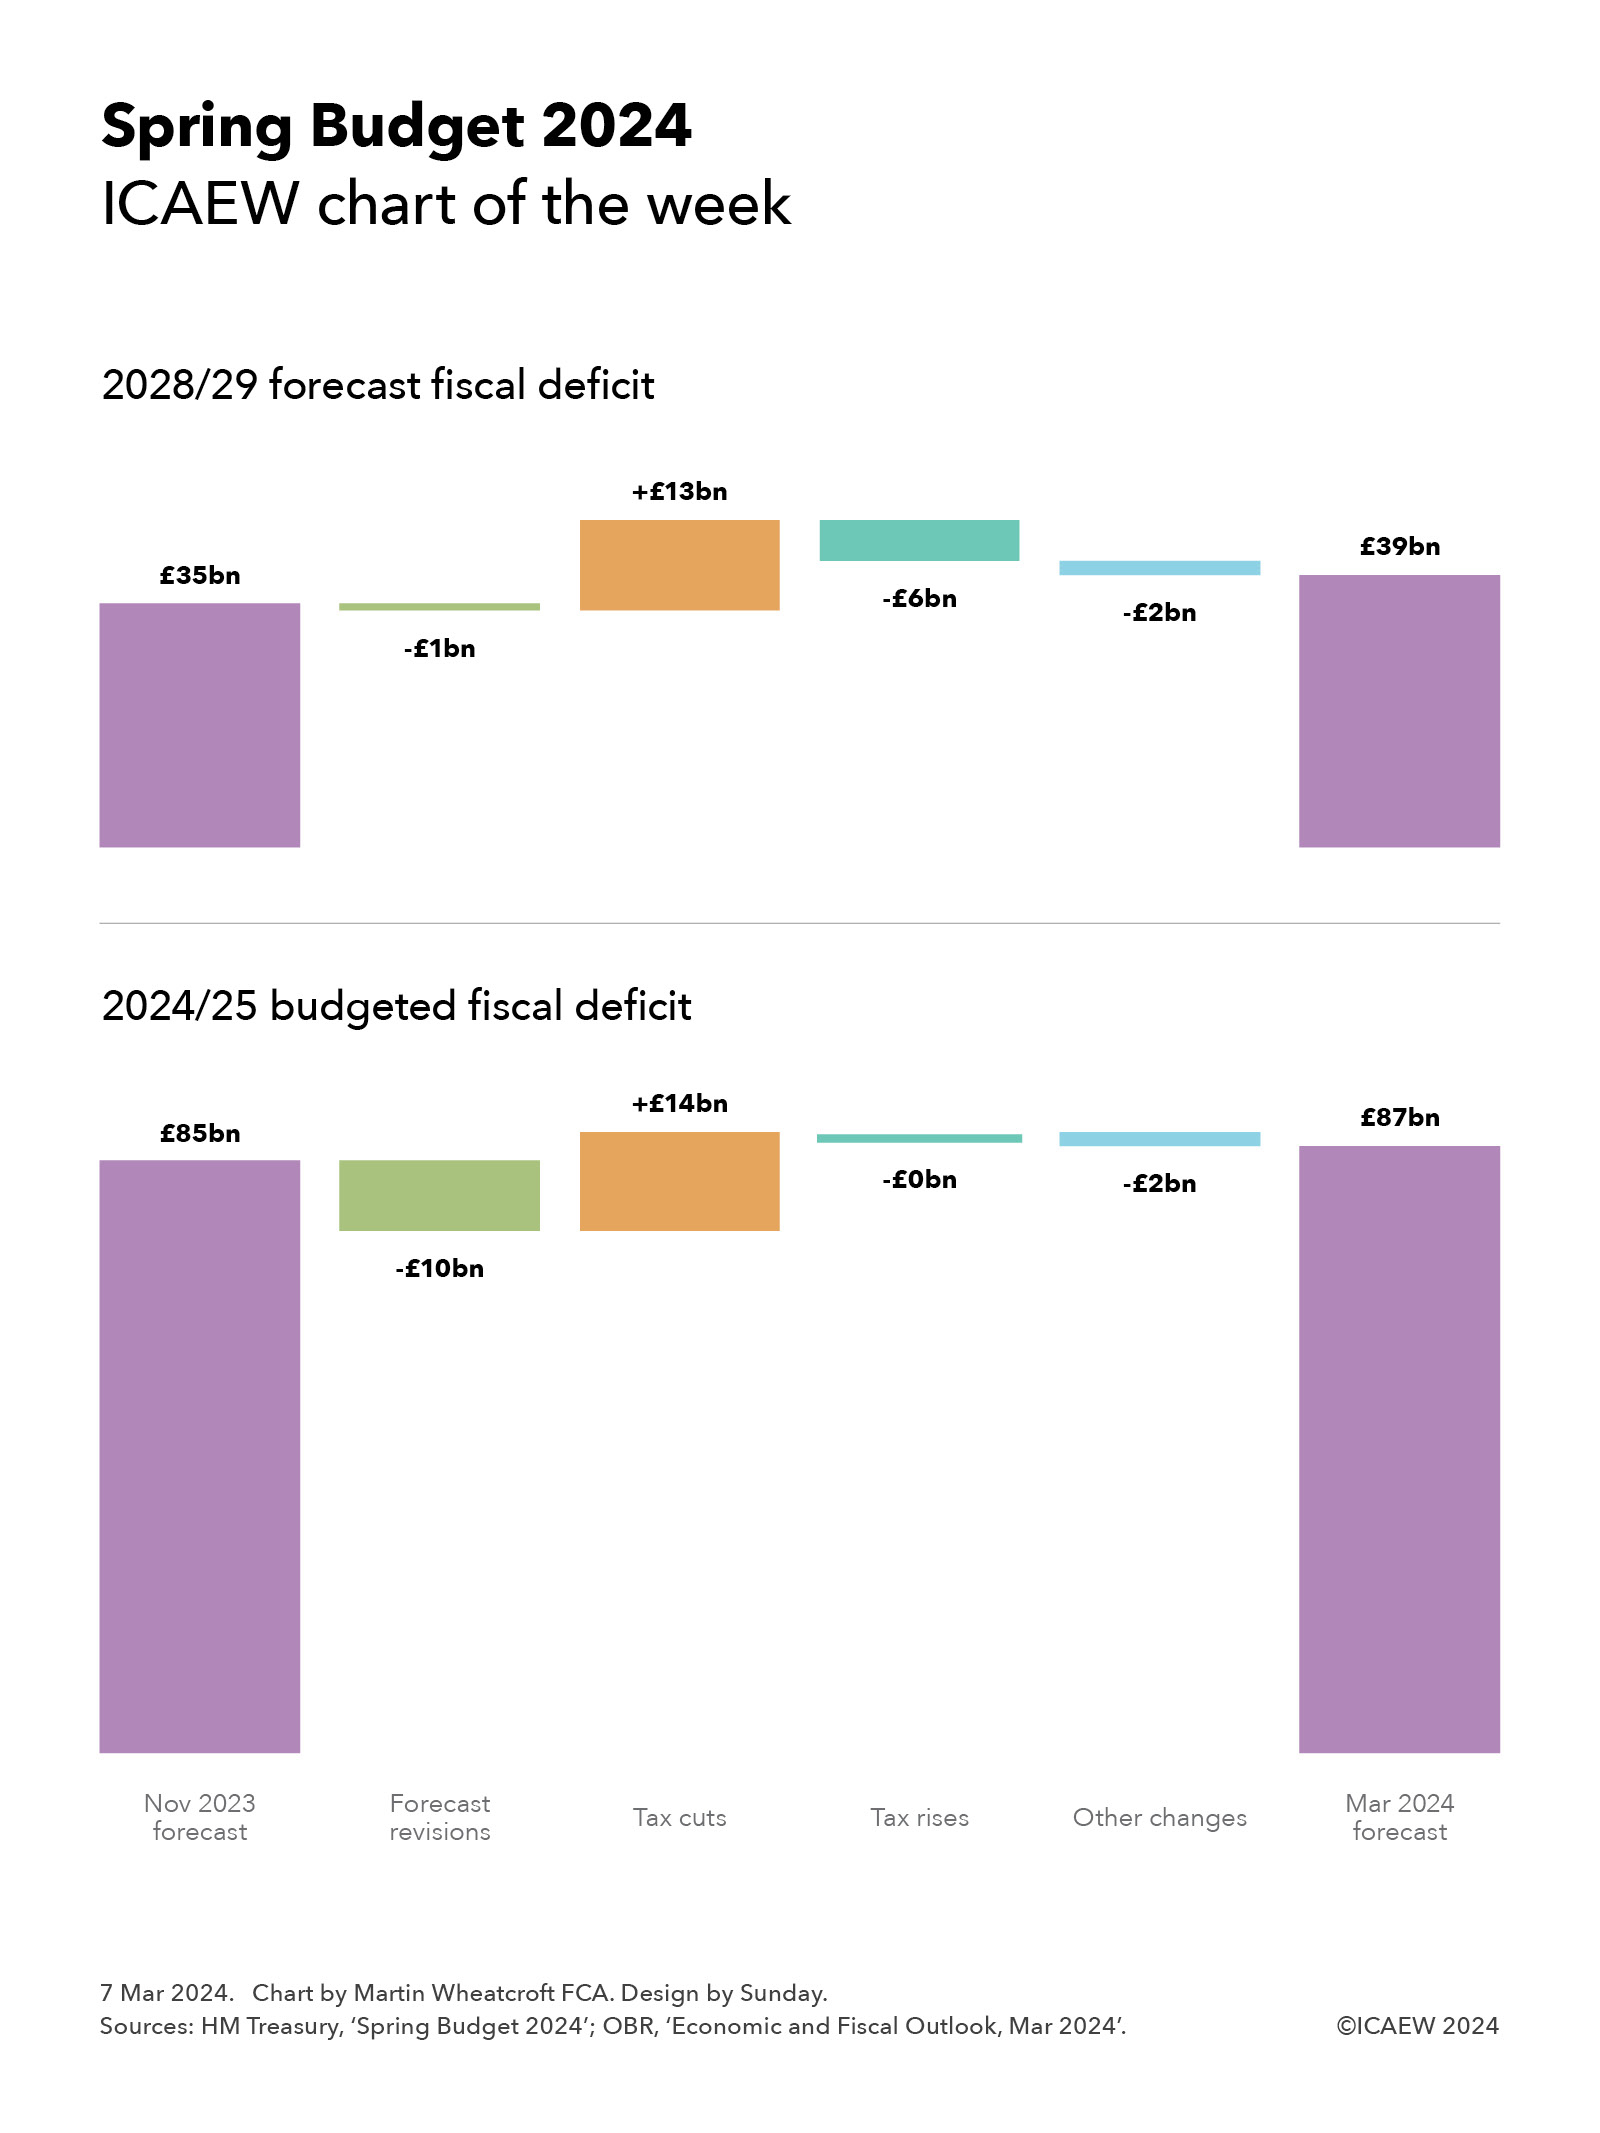
This week’s chart summarises the changes announced in the Spring Budget 2024, analysing the changes in the budgeted fiscal deficit for 2024/25 and the forecast fiscal deficit for 2028/29 since the forecasts that accompanied the Autumn Statement 2023 last November.
As the chart illustrates, the budgeted deficit for 2024/25 of £85bn anticipated in November has been revised up to £87bn, comprising forecast revisions reducing the deficit of £10bn, followed by tax cuts of £14bn increasing the deficit, offset by tax rises of close to zero and other changes of £2bn reducing the deficit.
The chart also shows the changes to the final year of the forecast period, with the forecast of deficit £35bn at the time of the Autumn Statement 2023 reduced by £1bn from forecast revisions, increased by £13bn to fund tax cuts, reduced by £6bn from tax rises and £2bn from other changes to reach a new forecast for the deficit in 2028/29 of £39bn.
The good news for the Chancellor was the improvement in the public finances in the earlier years of the forecast, with interest rate expectations coming down from last year. This resulted in an improvement in the forecasts of £16bn in 2024/25 and £14bn in 2028/29, offset by the effect of lower inflation expectations on tax and other receipts of £2bn and £13bn respectively to result in net forecast revisions of £10bn and £1bn respectively. The lower inflation assumption has a bigger impact over time as there is a compounding effect on tax and other receipts.
This allowed the Chancellor to announce a two-percentage point cut in national insurance pushing up the deficit by £10bn in 2024/25 and £11bn in 2028/29, together with freezes in fuel and alcohol duties, changes in the high-income child benefit charge, an increase in the VAT threshold from £85,000 to £90,000, and a four-percentage point cut in capital gains tax on property sales from 28% to 24%. The latter change is expected to increase tax receipts by a few hundred million pounds a year as it is expected to encourage more property sales, with higher volumes offsetting lower tax on each sale. Overall, these other tax cuts push up the deficit by £4bn in 2024/25 and £2bn in 2028/29.
The forecast revisions weren’t enough to allow the Chancellor to cover the cost of cutting taxes, and so he also announced some tax rises. These include the introduction of a duty on vaping and an increase in tobacco duty, an extension of the energy profits levy to March 2029, and changes in the tax treatment of ‘non-doms’. These have a relatively small effect in 2024/25 but build up to a reduction in the deficit around £6bn a year by 2028/29.
Other changes of £2bn in 2024/25 comprised £1bn in other policy measures and £1bn in indirect benefits to the economy from the Chancellor’s announcements in 2024/25, while the £2bn in 2028/29 reflected £1bn from improvements in tax collection, £1bn in other measures, and £2bn from indirect benefits to the economy, offset by £1bn from interest on increased borrowing, and £1bn to be invested in public sector productivity.
In summary, these are relatively tiny changes in the outlook for the public finance in the context of £1.2trn of public spending each year and public sector net debt that is still on track to exceed £3.0trn by the end of the forecast period in March 2029.
Even relatively small changes in economic assumptions, in spending plans, or in tax policies could have a significant impact on the fiscal forecasts, especially those for 2028/29.
For more information about the Spring Budget 2024 and ICAEW’s letters to the Chancellor and HM Treasury, click here.
While tax cuts will likely headline next week’s Spring Budget, debt markets will be questioning plans to reduce the deficit by constraining public spending.
Last week’s chart of the week looked at the pre-Budget forecast for debt and the very low level of headroom the Chancellor had against his primary fiscal rule of seeing debt falling by the final year of the forecast period.
Our chart this week is on the ‘P&L’ side of the equation, illustrating how the Chancellor’s plan at the time of the Autumn Statement 2023 was to bring down the deficit by constraining growth in public spending to less than the level of growth in tax and other receipts.
The starting point is the deficit of £85bn for the financial year ending March 2025 (2024/25) forecast by the Office for Budget Responsibility last November, with spending (excluding interest) expected to increase by less each year than receipts (net of interest): by £13bn and £21bn respectively in 2025/26, £10bn and £19bn in 2026/27, £5bn and £24bn in 2027/28, and £7bn and £21bn in 2089/29, to reach a projected deficit of £35bn in 2028/29.
If achieved, this would see the deficit reduce to the equivalent of 1.6% in 2027/28 and 1.1% of GDP in 2028/29, the first time the deficit would come in below 2% of GDP since 2002/03, a quarter of a century earlier.
Although the increases in taxes and other receipts may seem substantial, they are broadly in line with the projected growth in the size of the economy, with ‘fiscal drag’ from the freezing of several key tax allowances mitigating the effect of tax cuts announced last November. Meanwhile, planned spending increases are relatively small in the context of the overall public finances, equivalent to real terms rises in public spending excluding interest of 1.1%, 0.8%, 0.4% and 0.5% respectively.
This relatively low level of increase in spending may seem surprising in the context of demographic changes that are pushing up spending on pensions, health and social care, a deteriorating international security situation, the severe financial difficulties facing many local authorities, and the pressure many other public services are under, not to mention the need to increase investment in infrastructure if the economy is to return to growth.
The Institute for Fiscal Studies has questioned whether the Chancellor’s spending plans are realistically achievable, given that they imply significant cuts in the budgets of unprotected departments over the course of the forecast period. These are unlikely to be deliverable in practice.
A modest boost to public finances reported in the current financial year, together with moderating interest rate expectations, are expected to provide the Chancellor with capacity to cut taxes while still meeting his fiscal rules. But debt investors will be wondering how much an incoming government – irrespective of which party wins power – will actually be able to raise taxes to fully cover expected spending-plan revisions. Not raising taxes sufficiently in the first Budget after the election would likely lead to the next government needing to borrow even more at a time when the Bank of England is flooding debt markets with gilts as it unwinds quantitative easing.
For more information about the Spring Budget 2024 and ICAEW’s letters to the Chancellor and HM Treasury, click here.
My chart for ICAEW this week looks ahead to the Spring Budget and asks how much headroom the Chancellor will have available for tax cuts or higher spending while still meeting his fiscal targets.
The Chancellor is currently getting ready for his Spring Budget on Wednesday 6 March 2024, with rumours, leaks and misinformation swirling around ahead of what will be a keenly watched event – quite probably the last fiscal event before the general election.
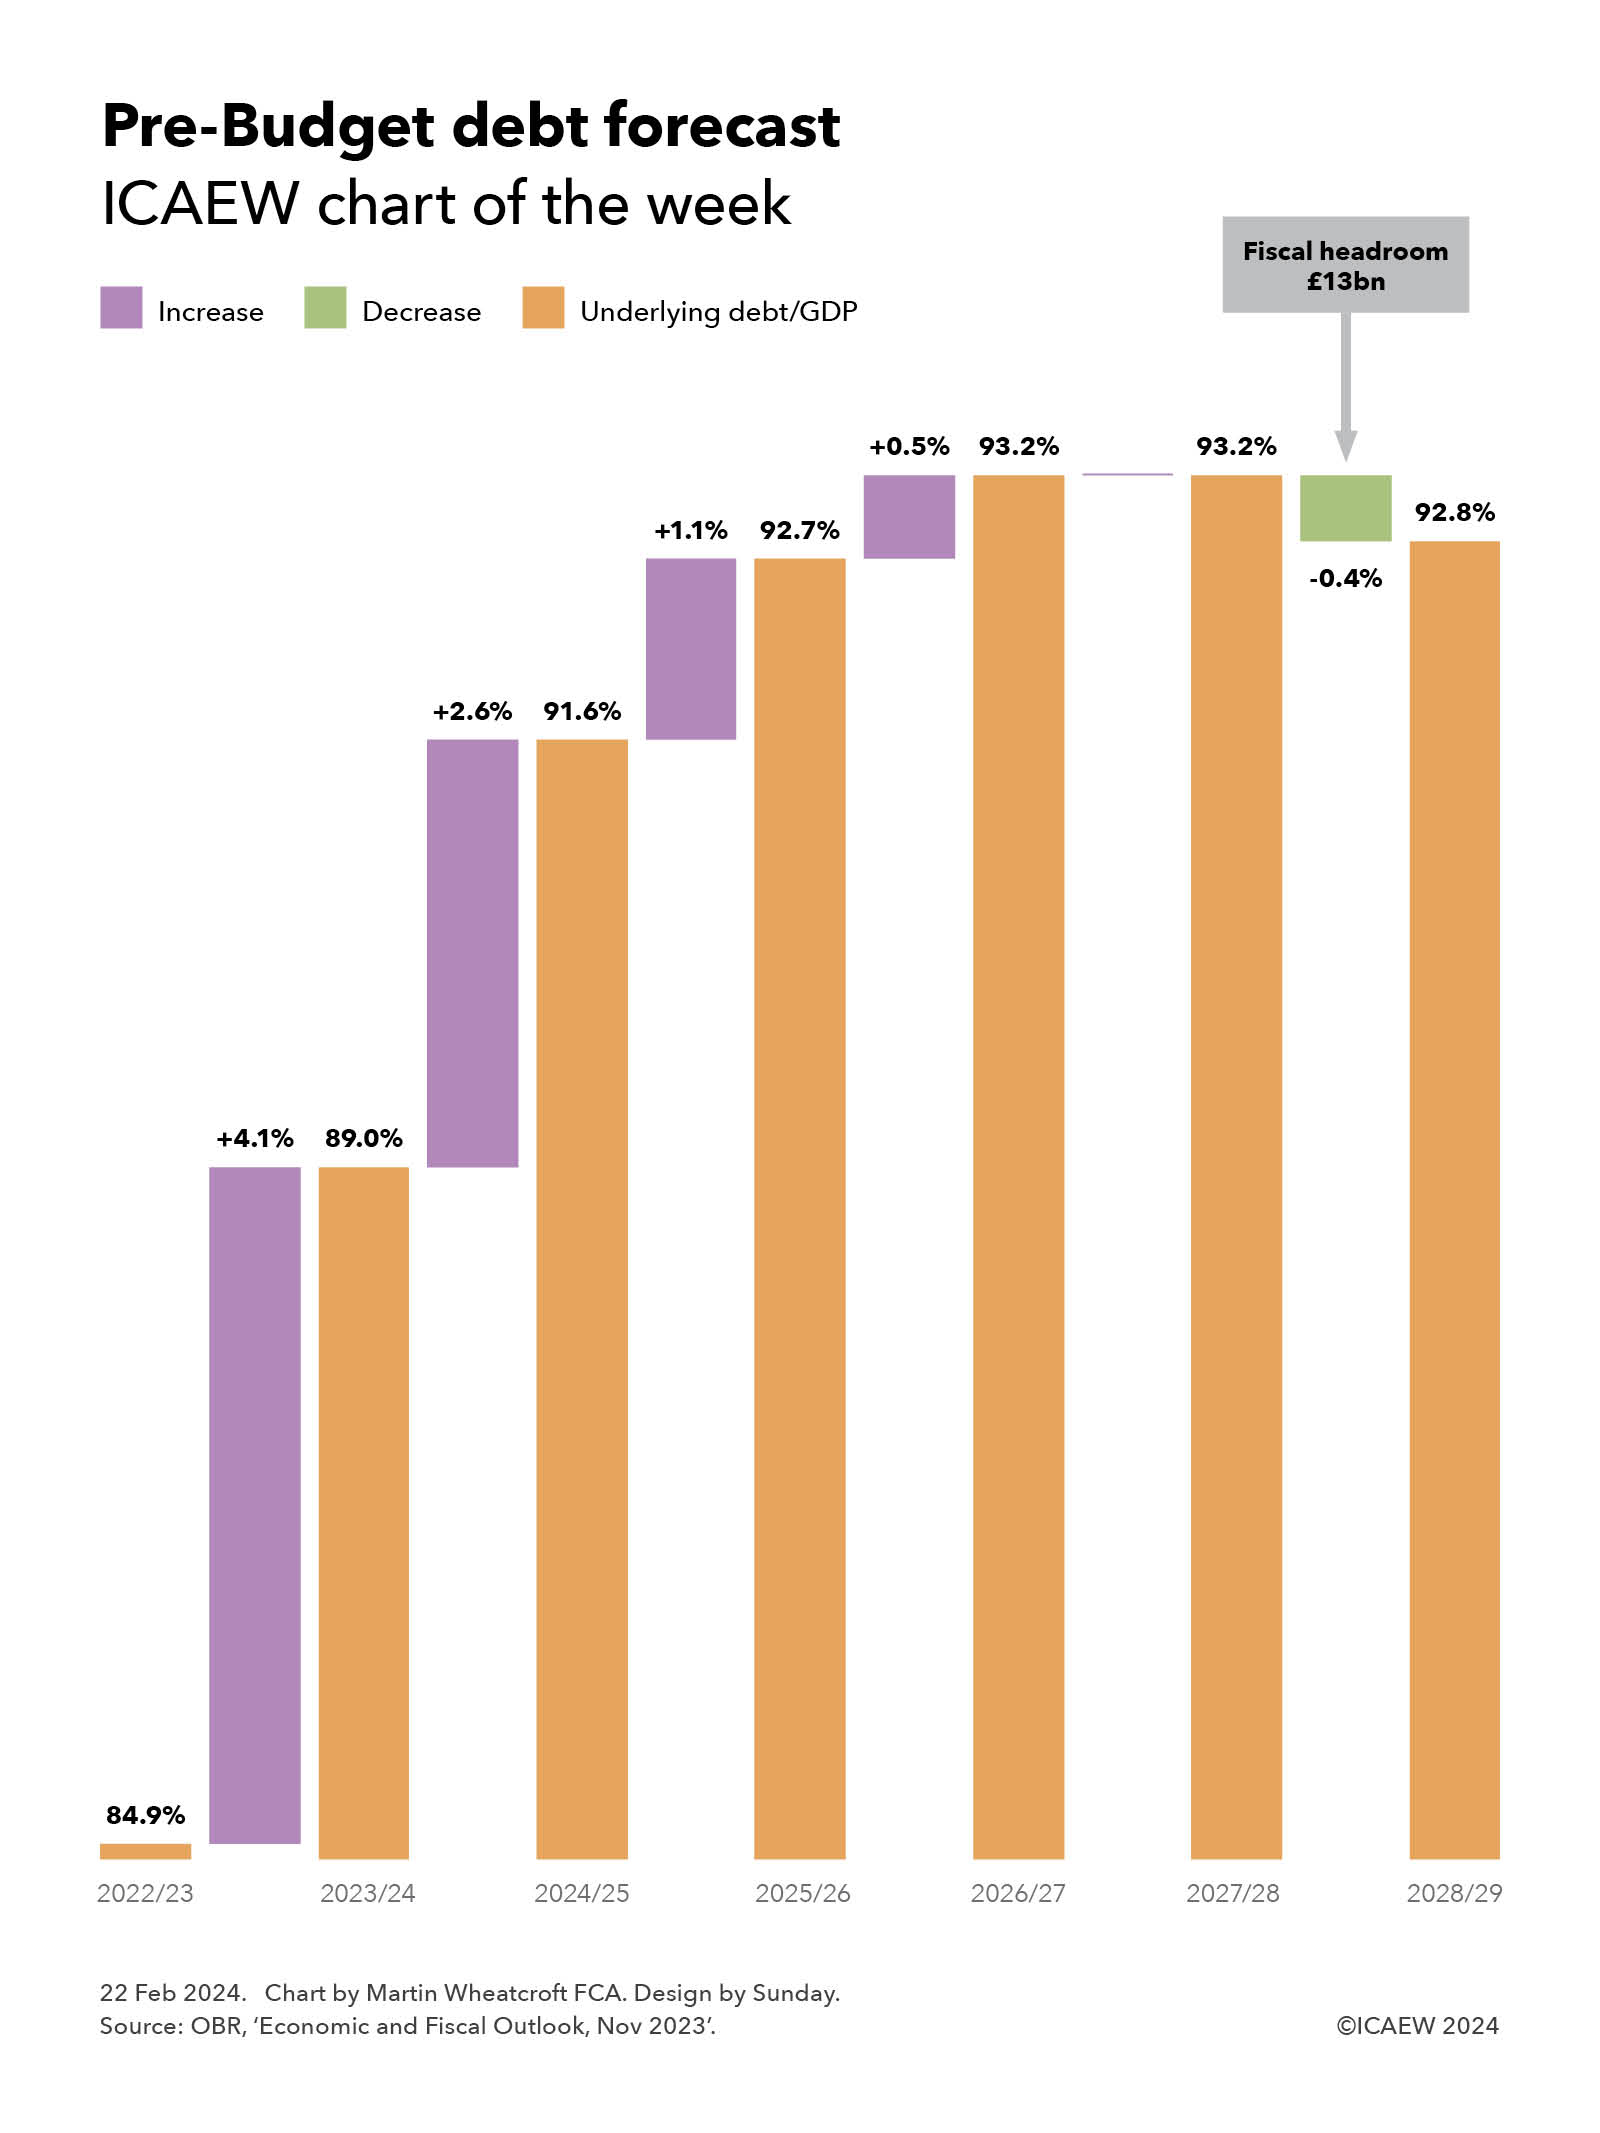
As our chart illustrates, the Office for Budget Responsibility (OBR) at the time of the Autumn Statement last November projected that the ratio of underlying debt to GDP would increase in the current financial year (2023/24) and further over the first four years of the forecast period, before starting to fall in the final year (2028/29).
Underlying debt is defined as public sector net debt (PSND) excluding Bank of England liabilities (PSNDexBoE). This alternative metric avoids distortion in the headline measure of debt caused by £170bn of Term Funding Scheme loan receivables not netted against related Bank of England liabilities that will reduce PSND as these loans are repaid, even though net financial assets and liabilities are not changing.
The projected increases are +4.1% from 84.9% at March 2023 to 89.0% at the end of 2023/24, +2.6% to 91.6% in 2024/25, +1.1% to 92.7% in 2025/26 and +0.5% to 93.2% in 2026/27, before staying flat in 2027/28 and then falling -0.4% to 92.8% in March 2029.
The fall in 2028/29 projected by the OBR in November provided the Chancellor with £13bn of fiscal headroom in the final year of the forecast. In theory this meant he could have planned to spend more, or cut taxes, by up to £13bn in 2028/29 and still met his primary fiscal target, which is for underlying debt/GDP to be declining in the final year of the fiscal forecast period.
Building such a relatively small amount of headroom into a forecast – less than four days of total government spending – is perhaps surprising given the high degree of uncertainty in predicting future receipts, spending and borrowing, not to mention GDP. These numbers can all move by tens of billions between forecasts, as the economic situation changes and policy and budgetary decisions are made.
GDP can be especially variable, with the Office for National Statistics making frequent revisions to its estimates, sometimes many years later. Several commentators also believe the numbers for planned public spending from April 2025 onwards are unrealistic and that there will be a need to revise these numbers upwards in subsequent fiscal events.
Although there has been a modest boost to the public finances in the reported numbers for the first 10 months of the current financial year, underlying debt/GDP at January 2023 was 88.1%, on track to end the financial year at close to the 89.0% in the November OBR forecast.
The news that the UK had entered recession in the last quarter of 2023 will not have been positive for the Chancellor in his search for additional headroom but, despite this, it is believed that the forecasts will improve sufficiently to allow him some capacity to either increase the total amounts allocated to public spending, or announce tax cuts, while still keeping with his fiscal targets. Of these options, tax cuts are considered much more likely.
Either way, underlying debt/GDP will be expected to be higher in five years’ time – potentially even higher than in previous forecasts. From a fiscal target perspective, what is important is whether the ratio is falling in the fifth year of the forecast period, not the overall change in the level between now and then.
For more information about the Spring Budget 2024 and ICAEW’s letters to the Chancellor and HM Treasury, click here.