This week’s chart covers the pre-census population estimate of 67.1m for June 2020 just released by the Office for National Statistics. Do more deaths, fewer births and returning migrants mean the 2021 number will be smaller?
ICAEW’s chart of the week is based on the UK population estimate for June 2020 released by the Office for National Statistics (ONS) on 25 June 2021, which estimates that there were 67.1m people living in the UK last summer. This is the last estimate before the March 2021 census that should provide a more accurate count of the population – potentially leading to revisions to this and previous estimates over the last few years.
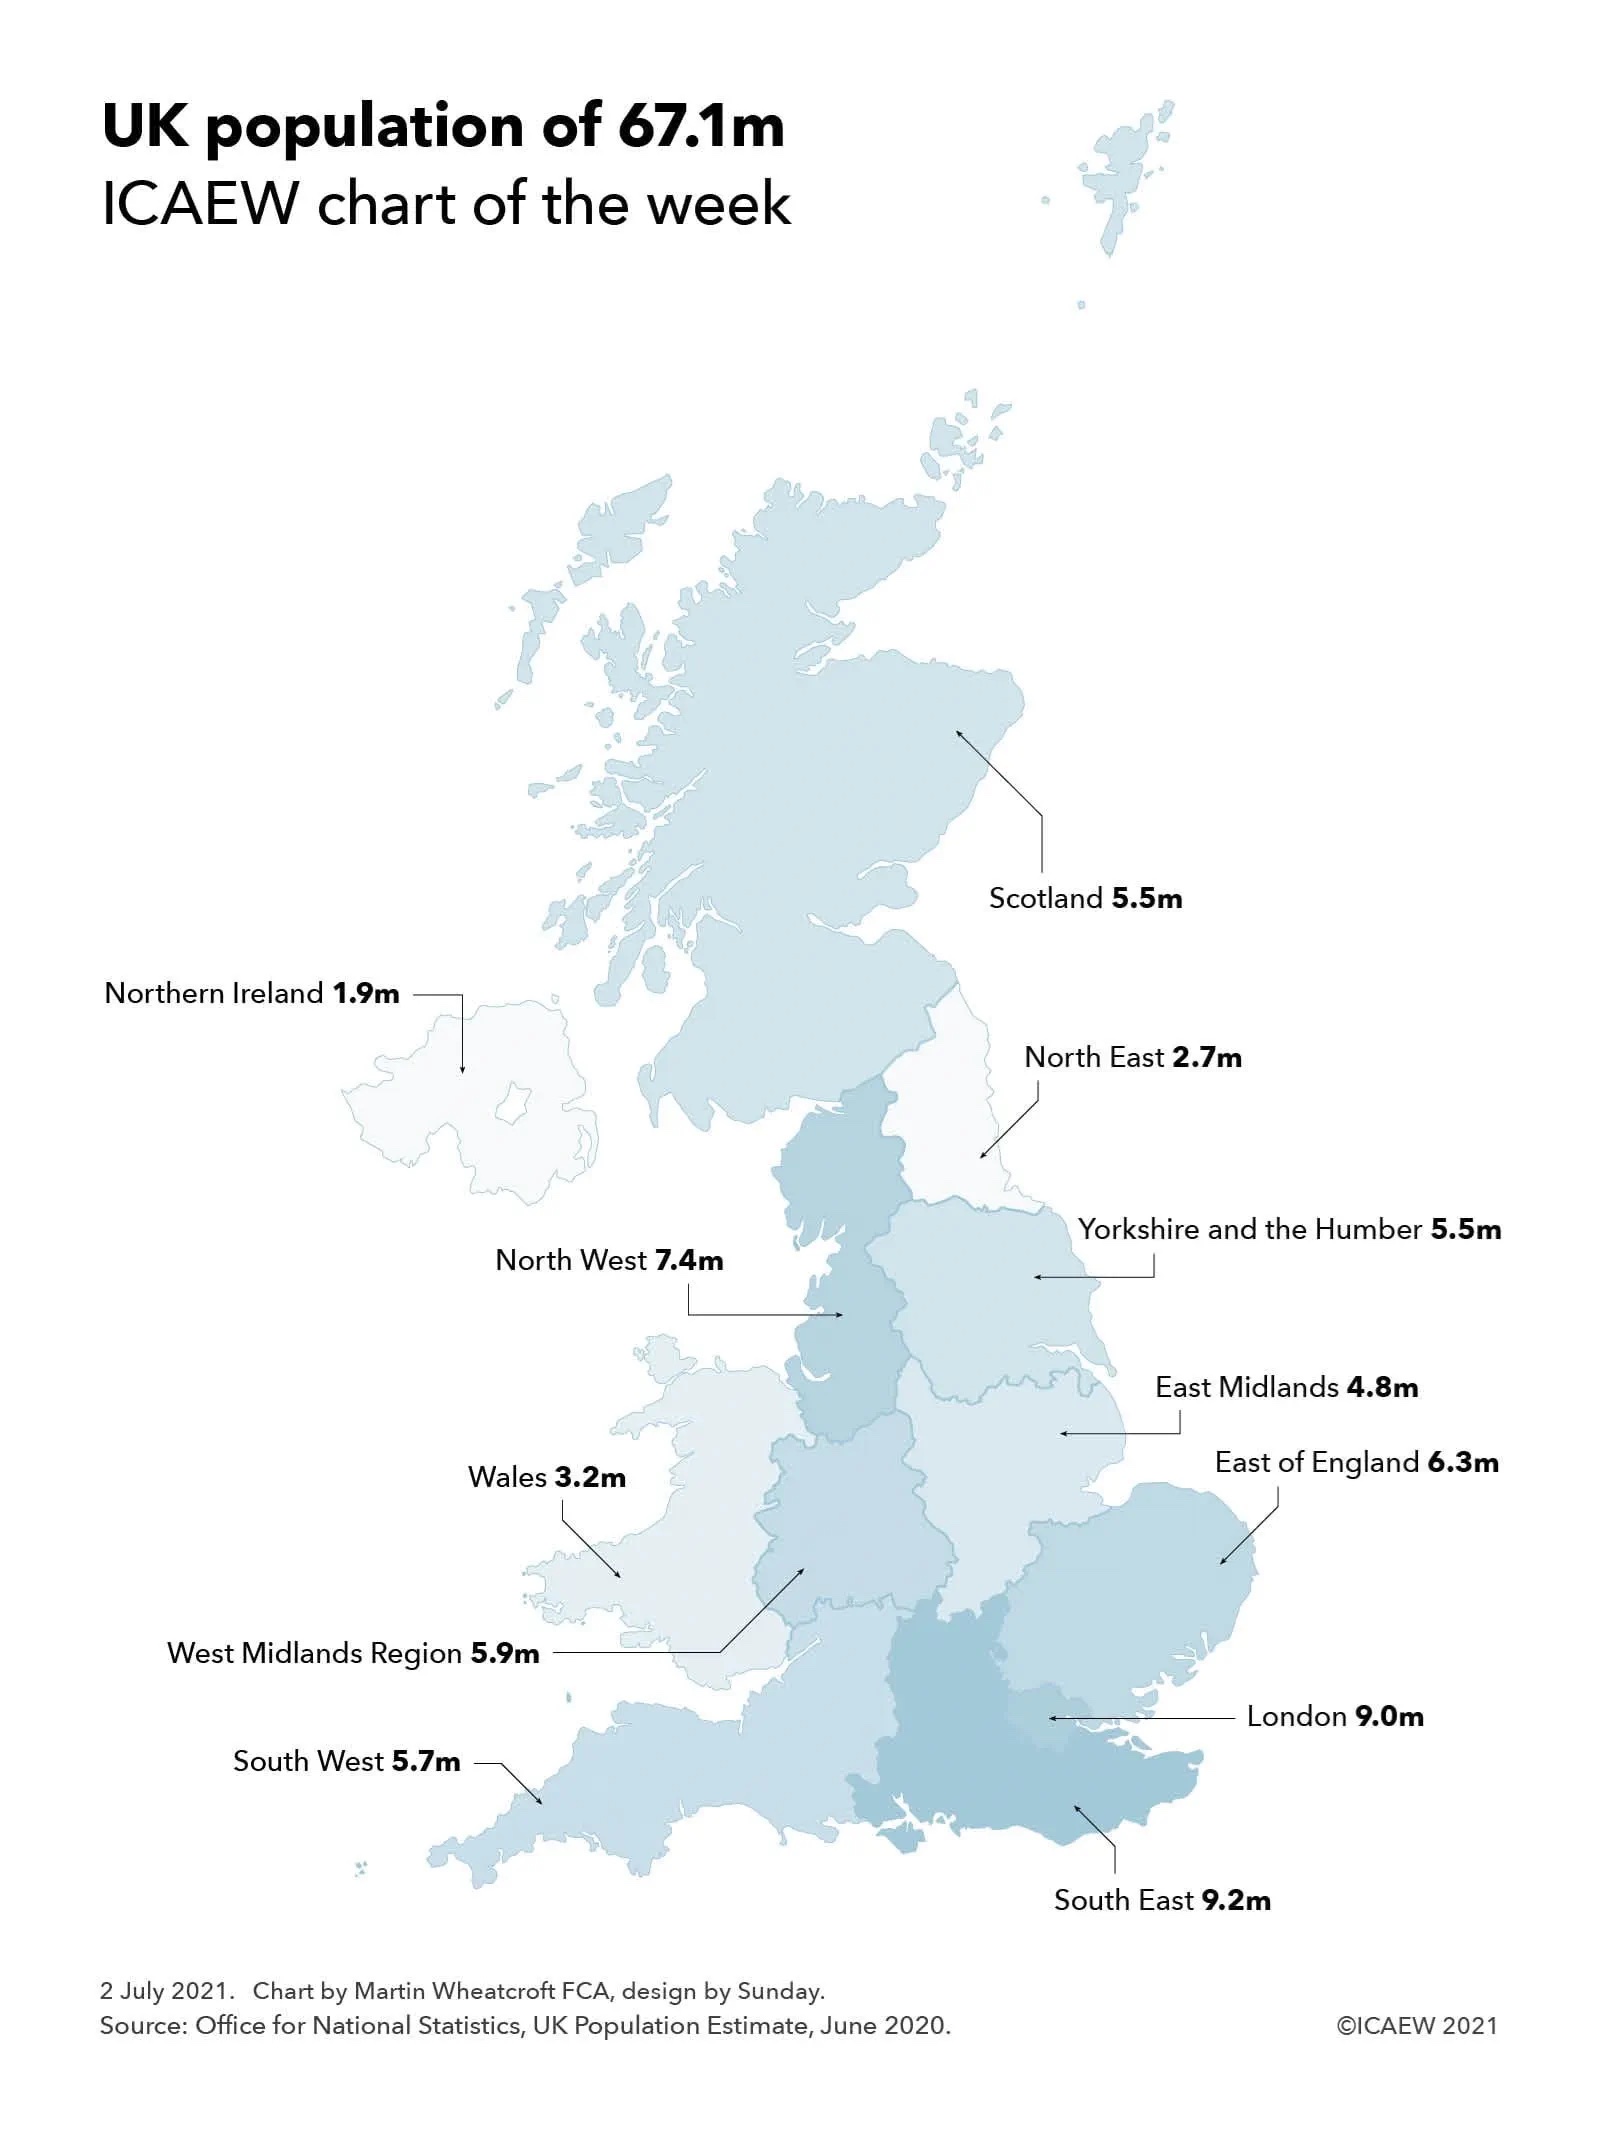
The population estimate comprises 56.5m people in England, 5.5m in Scotland, 3.2m in Wales and 1.9m in Northern Ireland. Within England there were 9.0m in London, 9.2m in the South East, 6.3m in the East of England, 4.8m in East Midlands, 5.5m in Yorkshire & the Humber, 2.7m in the North East, 7.4m in North West (including 2.8m in Greater Manchester), 5.9m in the West Midlands (including 2.9m in the West Midlands city-region), and 5.7m in the South West.
The median age for the population was 40.4 years old, with 19.8m aged between 0 and 24, 21.8m from 25 to 49, 19.7m from 50 to 74 and 5.8m aged 75 or more.
The ONS reports that the population increased by 284,000 or 0.43% from 2019 comprising a ‘natural’ increase of 32,000 (701,000 births less 669,000 deaths), net migration of 247,000 (immigration of 622,000 less emigration 375,000) and other movements of 5,000. This is a fall from the 361,000 increase seen in the previous year, primarily because of the coronavirus pandemic from mid-March 2020 to June 2020, when deaths increased and migration went into reverse.
The big question is whether the population may actually shrink when the 2021 census is reported, with deaths from the second and third waves of the pandemic, a further decline in the birth rate and a potential outflow of migrants combining to reduce the population for the first time since 1982.