The cumulative budget overrun has widened from £7bn to £10bn in seven months, reveals latest data from the Office for National Statistics.
The monthly public sector finances release, published by the Office for National Statistics (ONS) on 21 November 2025, reported a provisional shortfall between receipts and public spending of £17bn in October and a cumulative deficit of £117bn for the seven months then ended.
Martin Wheatcroft, external adviser on public finances to ICAEW, says: “The monthly public finances continue to disappoint, with the cumulative budget overrun widening from £7bn in the last release to £10bn for the seven months to October.
“While only slightly worse than expected, there were no rays of sunshine in these numbers for a beleaguered Chancellor trying to navigate her way through a series of political, economic and fiscal minefields surrounding the Autumn Budget.”
Month of October 2025
There was a £17bn shortfall between provisional receipts of £96bn and total public spending of £113bn in October 2025. This was £2bn better than the £19bn deficit incurred in October last year (£89bn receipts less £108bn total spending), but £3bn more than the budget of £14bn for the month.
Current spending of £108bn and net investment of £5bn in October were both in line with the £108bn and £5bn monthly averages incurred respectively during the first six months of the financial year.
October’s semi-annual advance tax payments meant that public sector net debt fell by £12bn during the month (from £2,917bn on 30 September to £2,905bn on 31 October 2025), with a net inflow of £29bn from working capital movements and lending activities more than offsetting the £17bn absorbed by the deficit.
Seven months to October 2025
The provisional £117bn deficit for the seven months to October 2025 was £9bn or 8% more than in the same seven months last year, and £10bn more than the £107bn that was budgeted. The £10bn overrun can be analysed as a £15bn adverse variance on the current budget deficit, offset by a £5bn underspend on net investment.
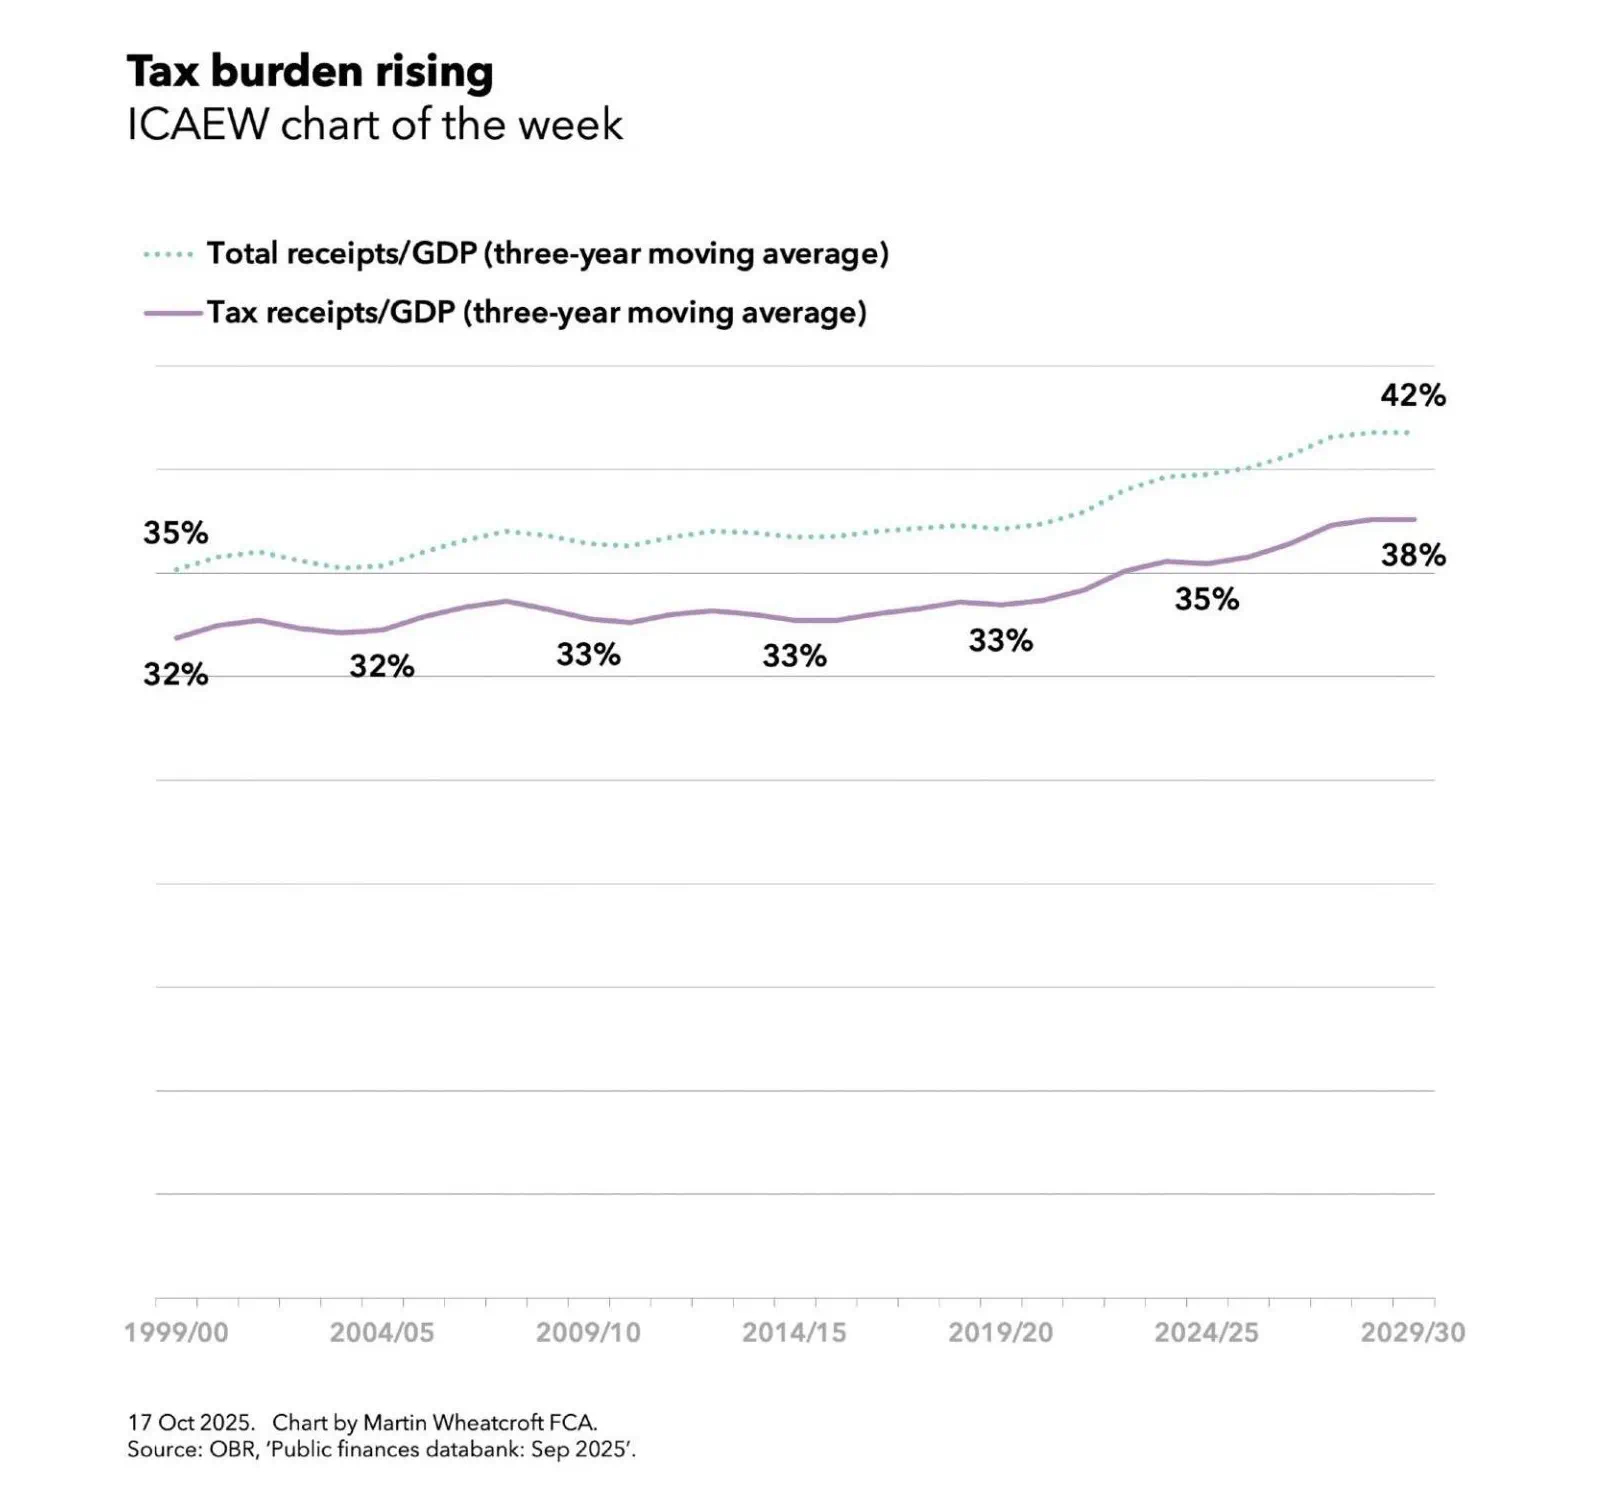
Table 1 highlights how year-to-date receipts of £672bn were 7% higher than the same period last year, with income tax up 8% from a combination of inflation and fiscal drag from frozen tax allowances. National insurance was up 19% as a result of the increase in employer national insurance from April 2025 onwards, and VAT receipts were up 4%, broadly in line with consumer price inflation.
Compared to last year, the 8% increase in spending to £756bn in the first seven months to October 2025 has principally been driven by public sector pay rises, higher supplier costs, the uprating of welfare benefits and higher debt interest.
Debt interest of £88bn was £9bn higher than for the first seven months of 2024/25, comprising a £7bn increase in indexation on inflation-linked debt as inflation rose again in 2025 and a £2bn increase in interest on variable and fixed-interest debt. The latter reflects a higher level of debt compared with a year ago, offset by a lower Bank of England base rate.
Net investment of £33bn in the first seven months of 2025/26 was £2bn or 6% higher than the same period last year. This comprised capital expenditure of £55bn (up by £2bn or 4%) and capital transfers (capital grants, research and development funding and student loan write-offs) of £20bn (up £2bn or 11%), less depreciation of £42bn (up by £2bn or 5%).
Table 1: Summary receipts and spending
| 7 months to Oct | 2025/26 £bn | 2024/25 £bn | Change |
|---|---|---|---|
| Income tax | 167 | 154 | +8% |
| VAT | 122 | 117 | +4% |
| National insurance | 114 | 96 | +19% |
| Corporation tax | 60 | 56 | +7% |
| Other taxes | 135 | 130 | +4% |
| Other receipts | 74 | 73 | +1% |
| Current receipts | 672 | 626 | +7% |
| Public services | (424) | (393) | +8% |
| Welfare | (181) | (171) | +6% |
| Subsidies | (21) | (20) | +5% |
| Debt interest | (88) | (79) | +11% |
| Depreciation | (42) | (40) | +5% |
| Current spending | (756) | (703) | +8% |
| Current deficit | (84) | (77) | +9% |
| Net investment | (33) | (31) | +6% |
| Deficit | (117) | (108) | +8% |
Budget for the rest of the financial year
The deficit is budgeted to be £118bn for the full year ending 31 March 2026, comprising £107bn in the first seven months of the year to October 2025 and £11bn in the remaining five months.
The latter comprises budgeted deficits of £9bn and £11bn in November and December 2025, a forecast surplus of £23bn in January, and deficits of £1bn and £13bn in February and March 2026.
Borrowing and debt
Table 2 summarises how the government borrowed £95bn in the first seven months of the financial year to take public sector net debt to a provisional £2,905bn on 31 October 2025. This comprised £117bn in public sector net borrowing (PSNB) to fund the deficit, less a £22bn net inflow from working capital movements and government lending.
The table also illustrates how the debt to GDP ratio increased by 1.0 percentage points from 93.5% of GDP at the start of the financial year to 94.5% on 31 October 2025. Incremental borrowing of £95bn, equivalent to 3.2% of GDP, was partly offset by 2.2 percentage points from the ‘inflating away’ effect of inflation and economic growth on GDP, the denominator in the net debt to GDP ratio.
Table 2: Public sector net debt and net debt/GDP
| 7 months to Oct | 2025/26 £bn | 2024/25 £bn |
|---|---|---|
| PSNB | 117 | 108 |
| Other borrowing | (22) | 10 |
| Net change | 95 | 98 |
| Opening net debt | 2,810 | 2,686 |
| Closing net debt | 2,905 | 2,784 |
| PSNB/GDP | 4.0% | 3.8% |
| Other/GDP | (0.8%) | (0.4%) |
| Inflating away | (2.2%) | (3.1%) |
| Net change | 1.0% | 0.3% |
| Opening net debt/GDP | 93.5% | 94.4% |
| Closing net debt/GDP | 94.5% | 94.7% |
Public sector net debt on 31 October 2025 of £2,905bn comprised gross debt of £3,352bn, less cash and other liquid financial assets of £447bn.
Public sector net financial liabilities were £2,583bn, which included public sector net debt plus other financial liabilities of £715bn, less illiquid financial assets of £1,037bn. Public sector negative net worth was £926bn, comprising net financial liabilities less non-financial assets of £1,657bn.
Revisions
Caution is needed with respect to the numbers published by the ONS, which are repeatedly revised as estimates are refined and gaps in the underlying data are filled. This includes local government, where the numbers are only updated in arrears and are based on budget or high-level estimates in the absence of monthly data collection.
This month was no different, with the ONS revising previously reported numbers for six months to September 2025 and for previous financial years. However, on this occasion, the changes made did not affect the aggregate totals when rounded to the nearest billion pounds.
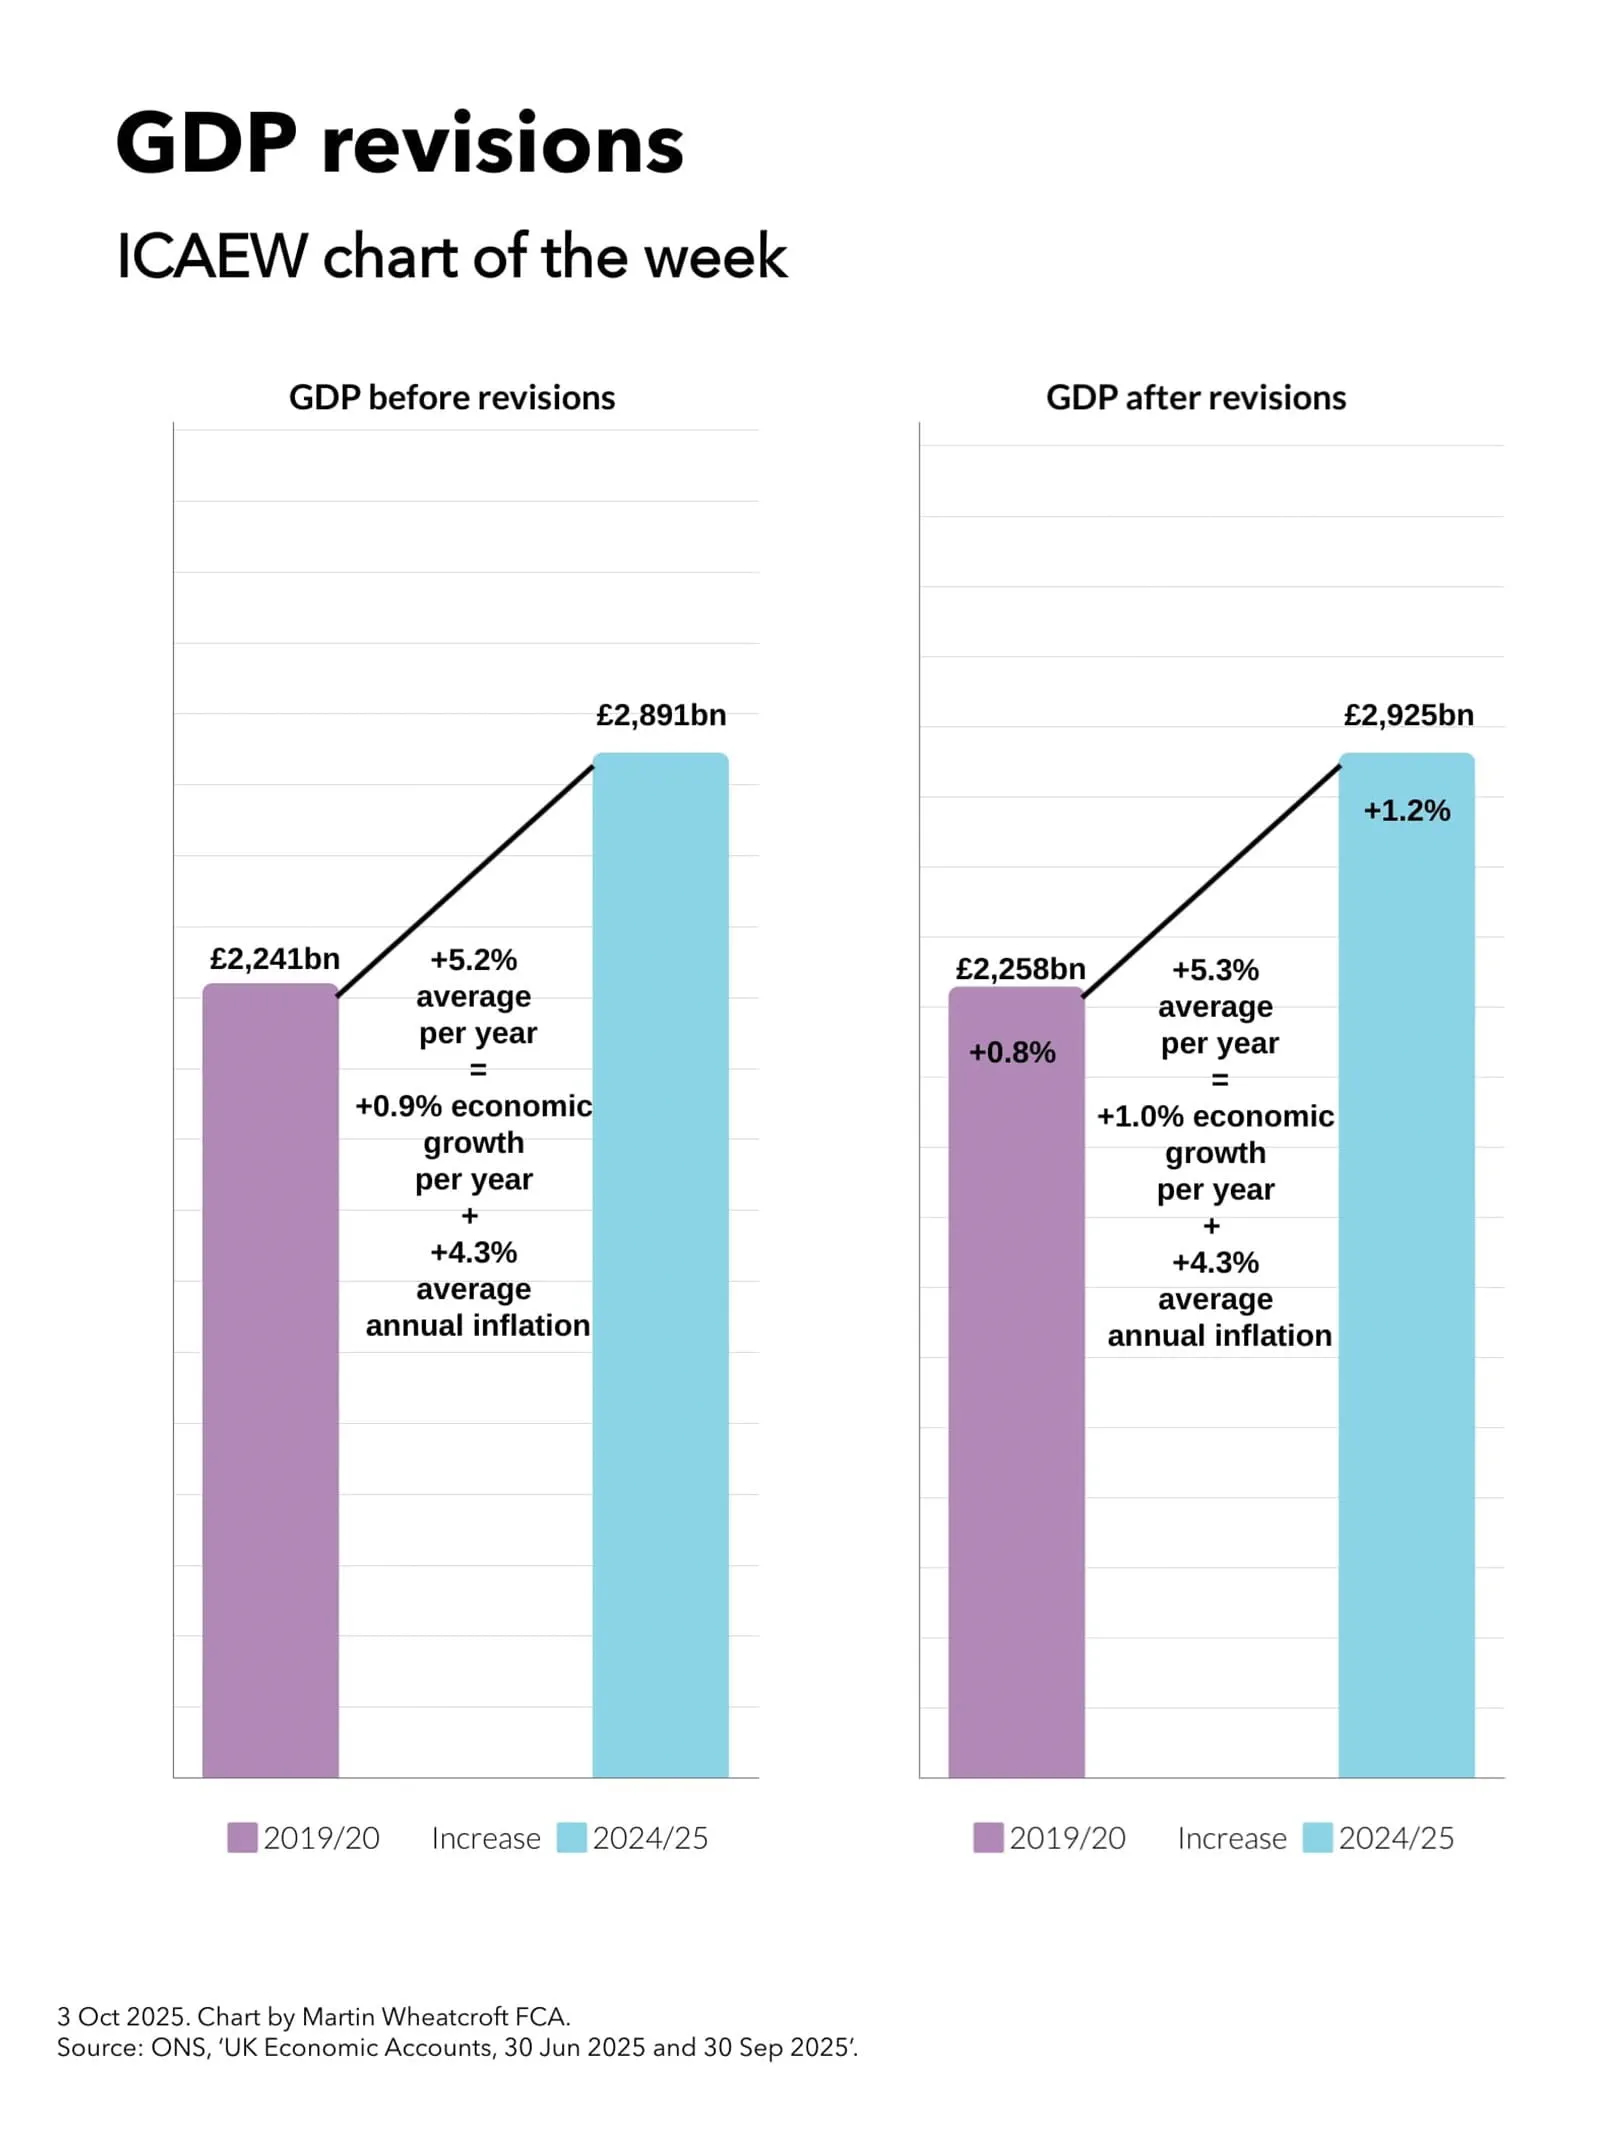
Regular updates to economic statistics resulted in an upward revision to nominal GDP and a consequential 0.2 percentage point reduction in the ratio of public sector net debt to GDP from 95.3% to 95.1% as of 30 September 2025.
For further information, read the public sector finances release for October 2025.