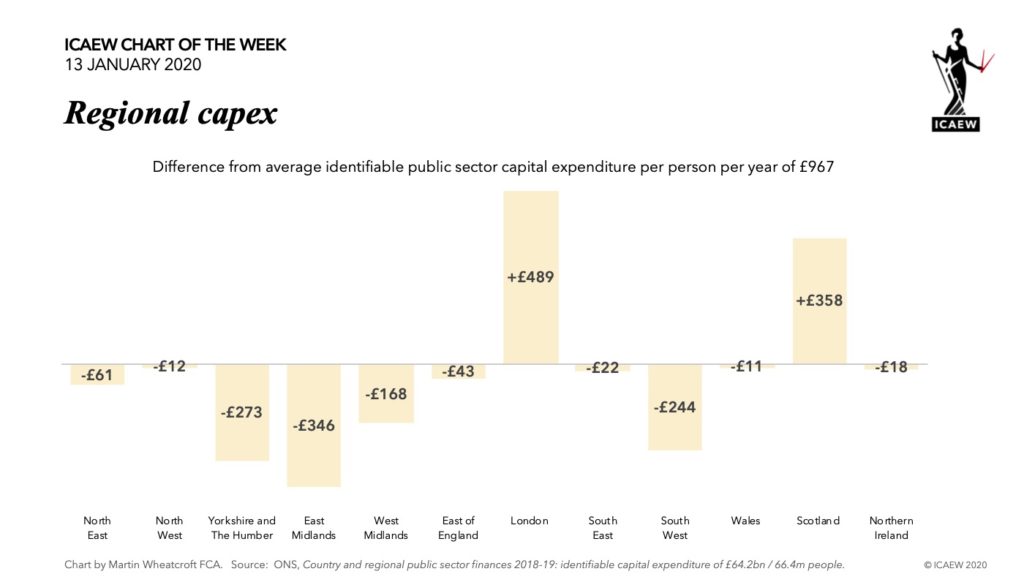
The #icaewchartoftheweek this week is on the subject of public sector capital expenditure across the UK in the light of speculation that the Spring Budget in March will feature a significant boost to capital spending in the North of England.
We thought it might be interesting to look at the most recent data; albeit the usual caveats apply to the numbers given the lack of formal systems in government to fully track expenditure by region and the differences between capital expenditure in the fiscal numbers (shown in the chart) and the capital expenditure reported in the (as yet unpublished) Whole of Government Accounts for 2018-19.
According to the ONS, there was £64.2bn in capital expenditure that can be identified by nation and region of the UK, an average of £967 for the 66.4m people living in the UK in 2018-19.
It is perhaps not surprising that there is more capital spending in London than the per capita average given that the millions of commuters and visitors that add to the 8.9m local population every day. However, the scale of the difference is substantial with £13bn invested in 2018-19, an average of £1,456 per person – £489 more than the UK average.
Of course, variations in capital expenditure are to be expected across a country of the size of the UK given the different natures and needs of each region and nation. For example, Scotland’s much higher level of per capita public capital expenditure (£7.2bn / 5.4m people = £1,325 per person) needs to be seen in the context that it comprises a third of the land area of the entire UK, but only has 8% of the population.
The region that incurs the least capital expenditure on a per capita basis is the East Midlands, where £3.0bn was spent in 2018-19, an average of £621 per person (£346 less than the average) for each of the 4.8m people living there. This is followed by Yorkshire and The Humber (£694 per person), the South West (£723) and the West Midlands (£799).
Most of the other regions are close to the average, including (perhaps surprisingly given some of the headlines), the North East and the North West.
One question that does come to mind – if Government’s intention is to rebalance regional inequalities by investing more in the ‘Northern Powerhouse’ and the ‘Midlands Engine’, will it have anything to spare for the ‘Great South West’ too?
| 2018-19 | Capex | Population | Per capita | Difference from average |
| North East | £2.4bn | 2.7m | £906 | -£61 |
| North West | £7.0bn | 7.3m | £955 | -£12 |
| Yorkshire and The Humber | £3.8bn | 5.5m | £694 | -£273 |
| East Midlands | £3.0bn | 4.8m | £621 | -£346 |
| West Midlands | £4.7bn | 5.9m | £799 | -£168 |
| East of England | £5.7bn | 6.2m | £924 | -£43 |
| London | £13.0bn | 8.9m | £1,456 | +£489 |
| South East | £8.6bn | 9.1m | £945 | -£22 |
| South West | £4.0bn | 5.6m | £723 | -£244 |
| Wales | £3.0bn | 3.1m | £956 | -£11 |
| Scotland | £7.2bn | 5.4m | £1,325 | +£358 |
| Northern Ireland | £1.8bn | 1.9m | £949 | -£18 |
| United Kingdom | £64.2bn | 66.4m | £967 | – |
Source: ONS, Country and regional public sector finances 2018-19: identifiable capital expenditure.