Inflation is believed to have peaked last quarter before being forecast to fall significantly over the course of 2023. We hope.
Our first chart of 2023 is on the prospects for consumer price inflation (CPI) over the course of the coming year, based on the latest forecasts for inflation from the Office for Budget Responsibility (OBR) that were released on 21 December 2022.
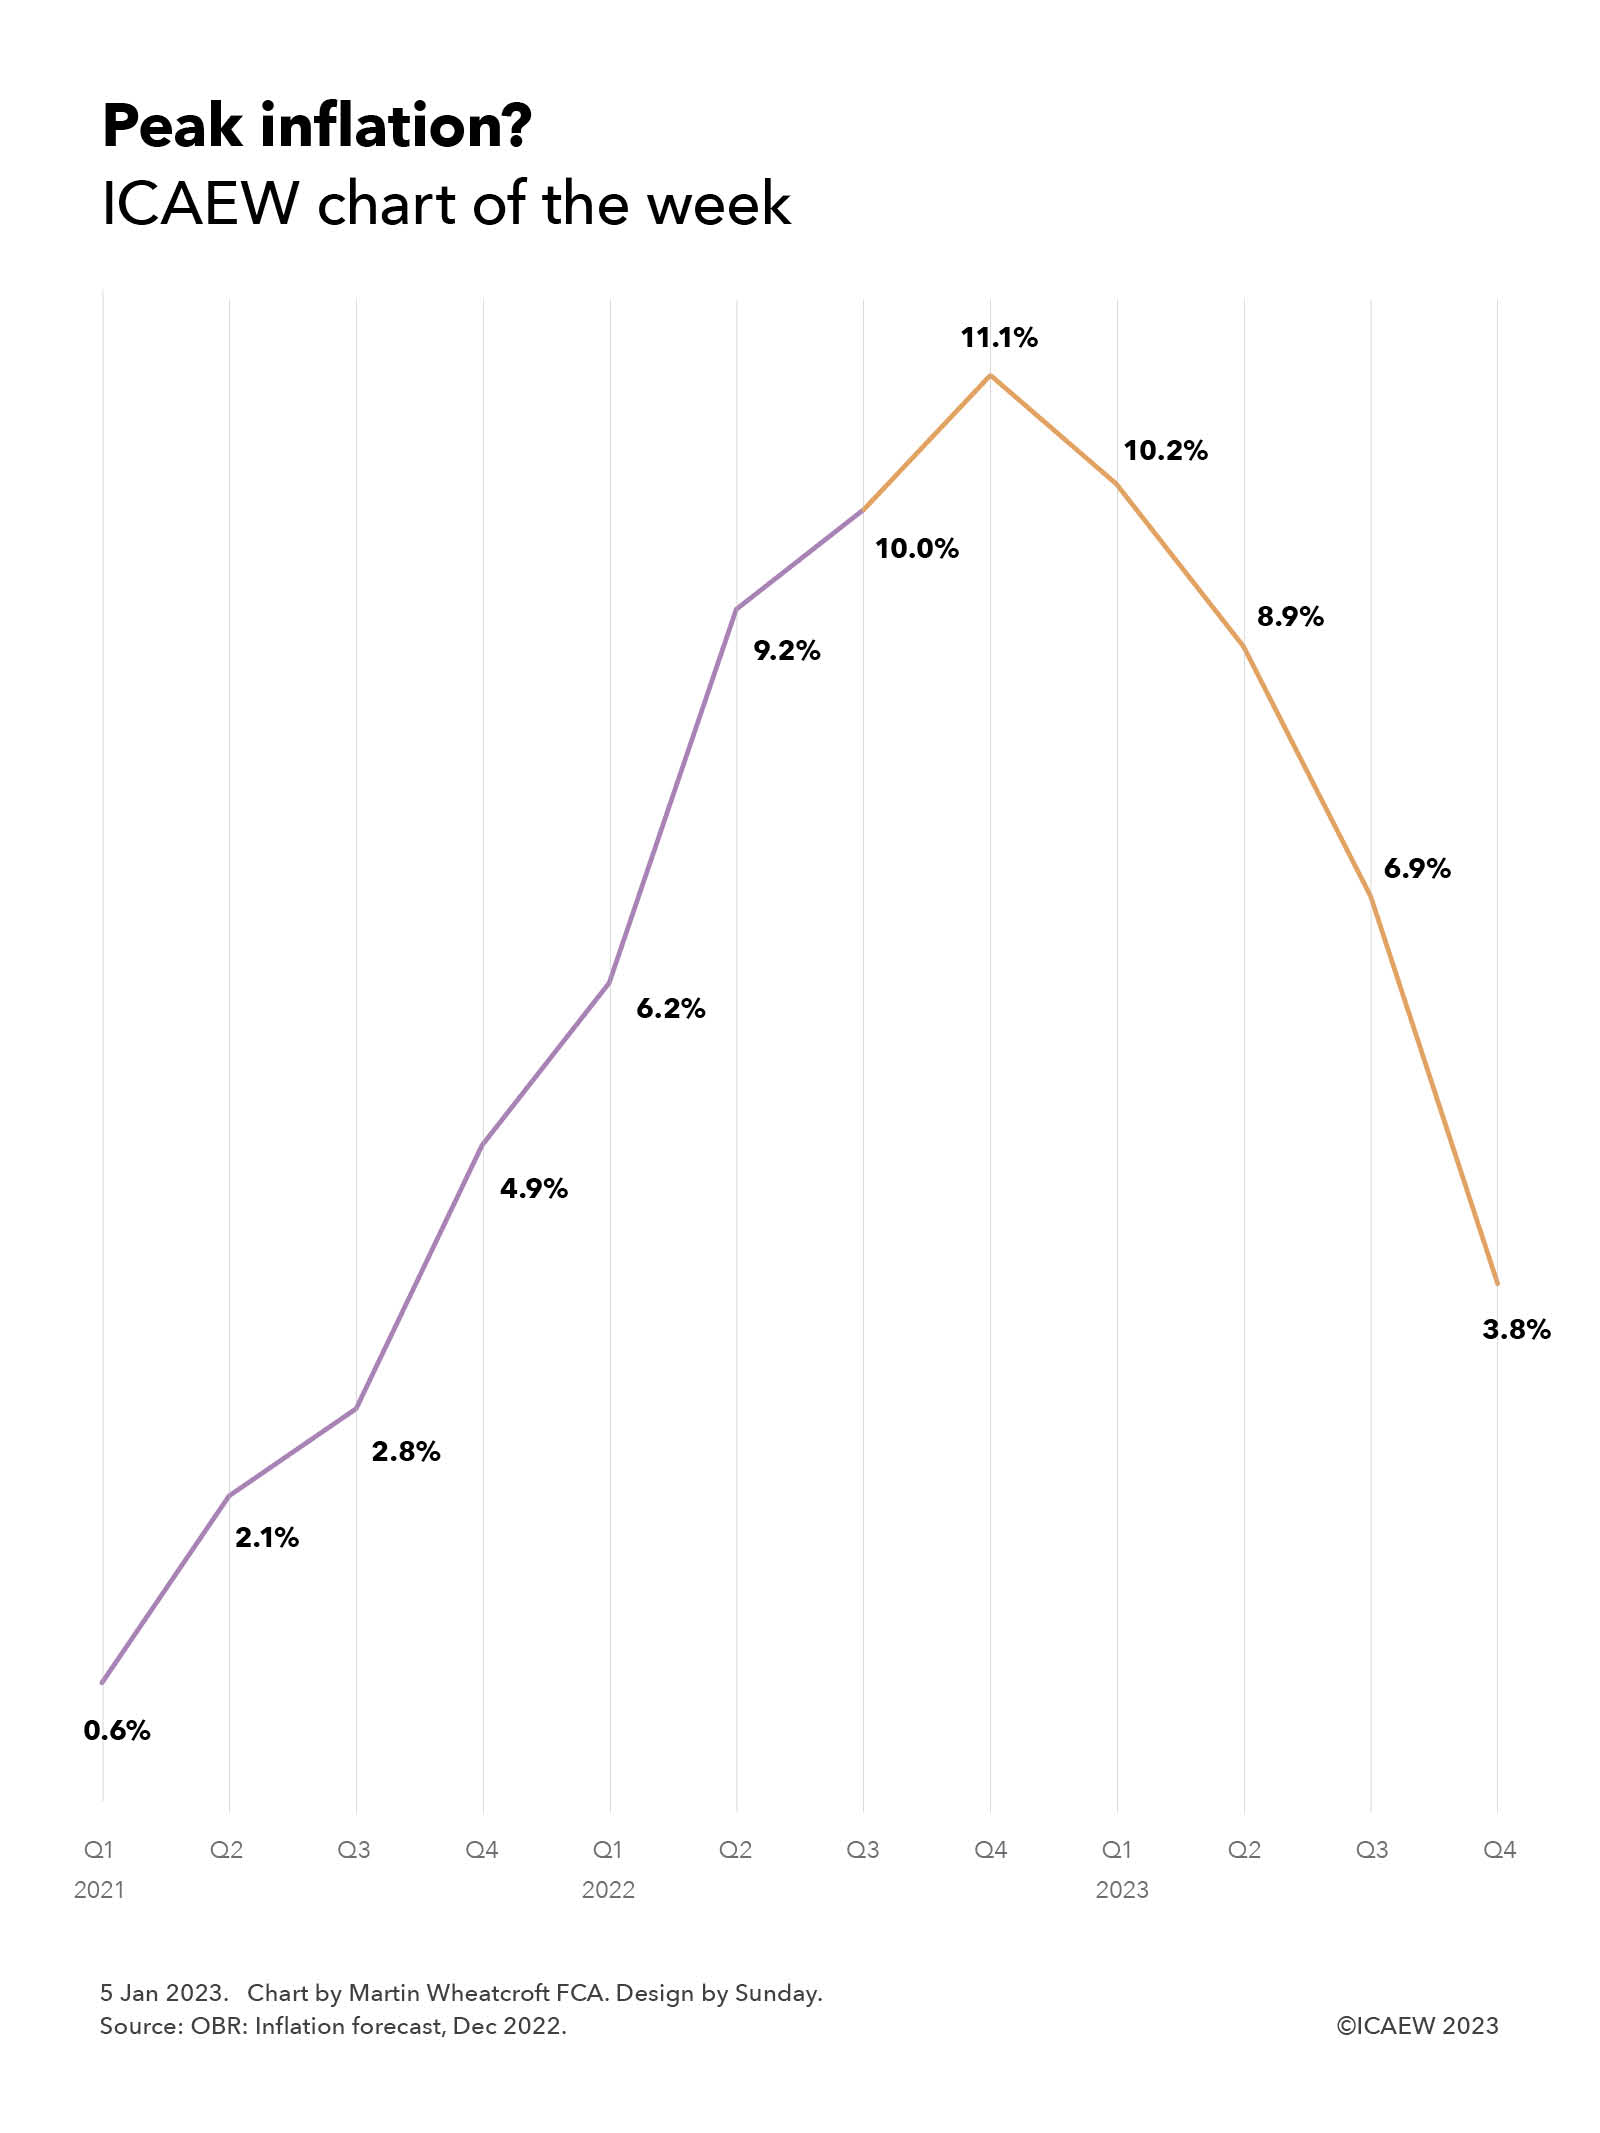
The OBR’s calculations suggest that CPI should come down significantly over the next four quarters to reach 3.8% by the end of the year, ‘only’ 0.8% above the Bank of England target range of 1% to 3%. The return of inflation to more moderate levels should help stabilise an economy that is currently in a pretty bad place, although it is important to understand that prices will still be rising, just at a slower pace than they have been over the course of the past year.
The chart illustrates how inflation started to rise in 2021, from a below-target 0.6% in Q1, to 2.1% in Q2, then 2.8% in Q3, before jumping to 4.9% at the end of 2021. The Russian invasion of Ukraine in the first quarter of 2022 and its consequences for global energy prices drove the inflation rate even higher, to 6.2% in Q1, 9.2% in Q2 and 10% in Q3, before rising to a forecast peak of 11.1% in Q4 of 2022. The OBR then goes on to forecast that the rate of price increases experienced by consumers will moderate in the coming year, down to 10.2% in Q1, 8.9% in Q2, 6.9% and then 3.8% in the fourth quarter of 2023.
Of course, economic forecasts of this nature are inherently uncertain, especially given the role that volatile energy prices play, both in their own right but also as a cost input to many other products and services. For consumers, the withdrawal of the Energy Price Guarantee will mean energy bills are likely to rise significantly in the second quarter despite falling wholesale prices.
The chart does not extend into 2024, when the forecasts are even more uncertain than for the current year. The OBR suggests that inflation could turn negative during 2024 (Q1: 2.5%; Q2: 0.4%; Q3: -0.2%; Q4: -0.1%) and 2025 (Q1: -0.1%; Q2: -0.6%; Q3: -1.1%; Q4: -1.3%), before heading back to target in 2026 (Q1: -1.0%; Q2: -0.4%; Q3: 0.9%; Q4: 1.2%). Deflation brings with it a whole different set of economic challenges to be faced but, fortunately, forecasts are less accurate the further into the future they go. The hope is that the Bank of England will be able to time its switch in monetary policy actions from countering inflation to countering deflation just right in order to avoid this potential outcome.
Either way, the prospect of inflation coming down over the coming year is a positive amid an otherwise very bleak economic picture for the UK as we begin 2023.