Fiscal outlook worsens as mid-year self assessment receipts fail to outweigh higher debt interest and the cost of energy support packages.
The monthly public sector finances for July 2022 released on Friday 19 August 2022 reported a provisional deficit for the month of £5bn, compared with a deficit of £21bn in the previous month as self assessment receipts boosted the cash position, supplemented by growing VAT and PAYE receipts. The latter helped add £7bn to the top line compared with this time last year, bringing total receipts for the month to £84bn, while current expenditure excluding interest of £79bn and interest of £7bn were each £3bn higher. With net investment unchanged at £3bn, the net improvement in the deficit for July compared with the same month last year was £1bn.
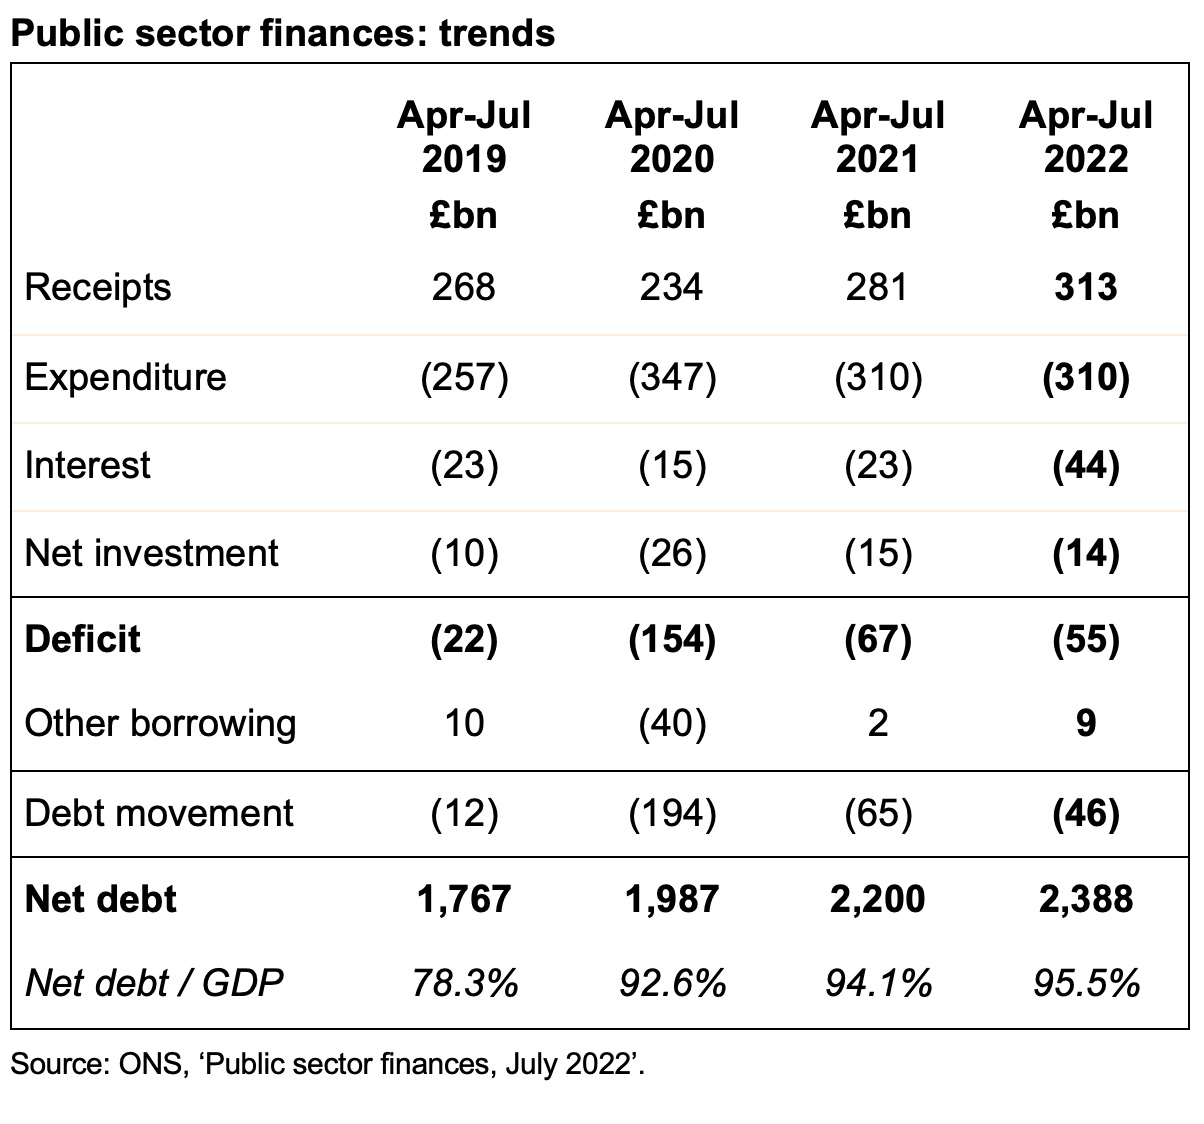
The total deficit for the first four months of the 2022/23 financial year was £55bn following revisions to previous months. This was £12bn lower than this time last year and £99bn lower than the previous year during the first pandemic lockdown, but £33bn more than the deficit of £22bn for the first four months of 2019/20, the most recent pre-pandemic comparative period.
Public sector net debt was £2,388bn or 95.5% of GDP at the end of July, up £46bn from £2,342bn at the end of March 2022. This is £621bn higher than the £1,767bn equivalent on 31 March 2020, reflecting the huge sums borrowed over the course of the pandemic, although the increase in the debt-to-GDP ratio from 74.4% on 31 March 2020 is less than that reported in previous months as inflation has added to nominal GDP.
Tax and other receipts in the first four months to 31 July amounted to £313bn – £31bn, or 11%, higher than a year previously. This included higher income tax receipts from wage increases and bonuses as well as the new higher rate of national insurance, together with additional VAT receipts from inflation in retail prices.
Expenditure excluding interest and investment for these four months of £311bn was level with the same period last year, as reduced spending on the pandemic (including furlough programmes) was offset by the spending increases announced in last year’s Spending Review, together with support for households to help with energy bills.
Interest charges of £44bn were recorded for the four months – £21bn or 92% higher than the £23bn in the equivalent period in 2021 – with inflation driving up the cost of RPI-linked debt in addition to the effect of higher interest rates.
Cumulative net public sector investment was £14bn. This is £1bn or 9% lower than a year previously, potentially indicating a slowdown in capital programmes given that the Spending Review 2021 had pencilled in significant increases in capital expenditure budgets for the current year.
The increase in net debt of £46bn since the start of the financial year comprises the deficit for the four months of £55bn less £9bn in net cash inflows, as inflows from repayments of taxes owed and loans made to businesses during the pandemic exceeded outflows to fund student loans, other lending and working capital movements.
Alison Ring OBE FCA, Public Sector and Taxation Director at ICAEW, said: “The latest numbers highlight the extent to which the fiscal outlook is worsening as the cost of borrowing rises, with record high energy costs, rapidly increasing prices and an economy close to recession expected to further drive up public spending in this and the next financial year.
“The UK’s deteriorating fiscal situation will make it hard for the new prime minister to deliver on promised tax cuts, invest in energy resilience and support struggling families and businesses over the winter, without breaching fiscal rules intended to ensure the long-term health of the public finances.”
Caution is needed with respect to the numbers published by the ONS, which are expected to be repeatedly revised as estimates are refined and gaps in the underlying data are filled.
The ONS made several revisions to prior period fiscal numbers to reflect revisions to estimates. These had the effect of reducing the reported fiscal deficit for the three months ended 30 June 2022 by £5bn from £55bn to £50bn and increasing the reported fiscal deficit for the 12 months to March 2022 by £2bn from £142bn to £144bn.