Public spend as a share of the economy must fall over the next five years to make the sums add up – a big challenge for the next government.

My recently published in-depth Fiscal Insight into the Spring Budget 2024 highlights how the UK’s public finances are in a weak position, with difficult choices on spending deferred and post-election tax rises likely, irrespective of who wins the general election.
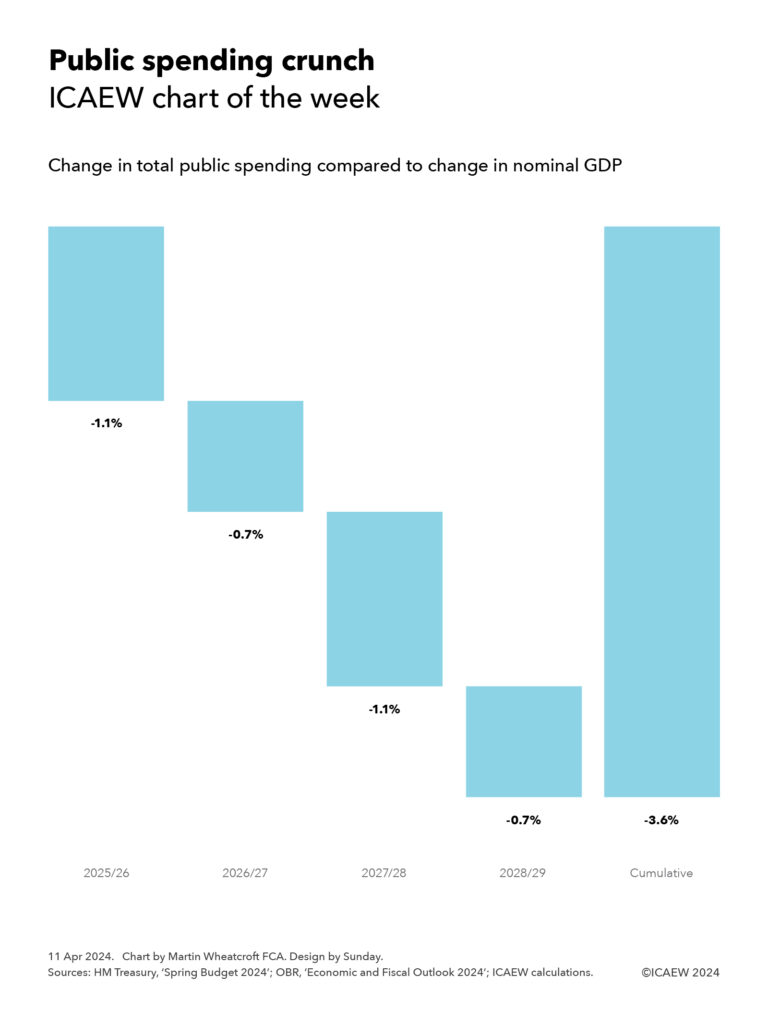
My chart for ICAEW this week illustrates how total public spending is forecast to fall by 3.6% as a share of national income between the first and final year of the fiscal forecast. This is equivalent to a 1.6 percentage point reduction in total managed expenditure from a budget of 44% of GDP in 2024/25 to a forecast of 42.4% of GDP in 2028/29.
At a reduction of 1.1% in 2025/26, 0.7% in 2026/27, 1.1% in 2027/28 and 0.7% in 2028/29, this may not sound that large – after all surely there must be some efficiencies that can be found in a budget of £1.2trn, or £1.4trn by 2028/29?
However, this doesn’t take account of the fact that around half of public spending goes on welfare, health and social care spending, where costs are principally driven by people living longer, the triple-lock state pension guarantee, and increasing levels of ill-health. And another 10% or so goes on interest, where costs are driven by no-longer-very-low interest rates on a growing level of debt.
Nor does it allow for the significant pressures facing many public services that are likely to need additional funding to address. This includes the deteriorating international security situation that has prompted recent calls for defence and security spending to increase from 2% to 3% of GDP, underperformance across a range of public services from the criminal justice system to potholes to HMRC service standards, local authorities that are struggling financially, and crumbling infrastructure (in some cases literally) – among many others. There is also little sign of the scale of investment that would be needed to transform the delivery of public services to achieve sustainable cost reductions while maintaining or improving service quality.
It is perhaps unsurprising that the government decided to postpone the three-year Spending Review scheduled for 2024 until after the general election, given how the Office for Budget Responsibility has highlighted how the 2021 Spending Review led to a departmental spending increase of £32bn a year, or around 1.2% of GDP. A similar revision to current spending plans would have more than absorbed the amounts used for tax cuts in the Autumn Statement 2023 and the Spring Budget 2024, or pushed up borrowing levels even higher than are currently planned.
If we are lucky, there will be more detail on each party’s tax and spending plans in their manifesto documents. Then again…
Read more in the ICAEW Fiscal Insight: Spring Budget 2024 or visit our Spring Budget 2024 hub for our extensive coverage of its tax and public finance implications.