My chart for ICAEW this week is on the labour market, breaking down the employment status of the 55.1 million adults aged 16 or over in the UK.
Our chart illustrates the employment status of the 55.1m adults in the UK on the basis of the latest statistics reported by the Office for National Statistics (ONS), published on 11 June 2024 for the three months from February to April 2024. The ONS is well ahead of the Labour Party’s proposals to extend the franchise in that it has long classified individuals aged 16 or 17 as ‘adults’ for the purposes of its labour market statistics.
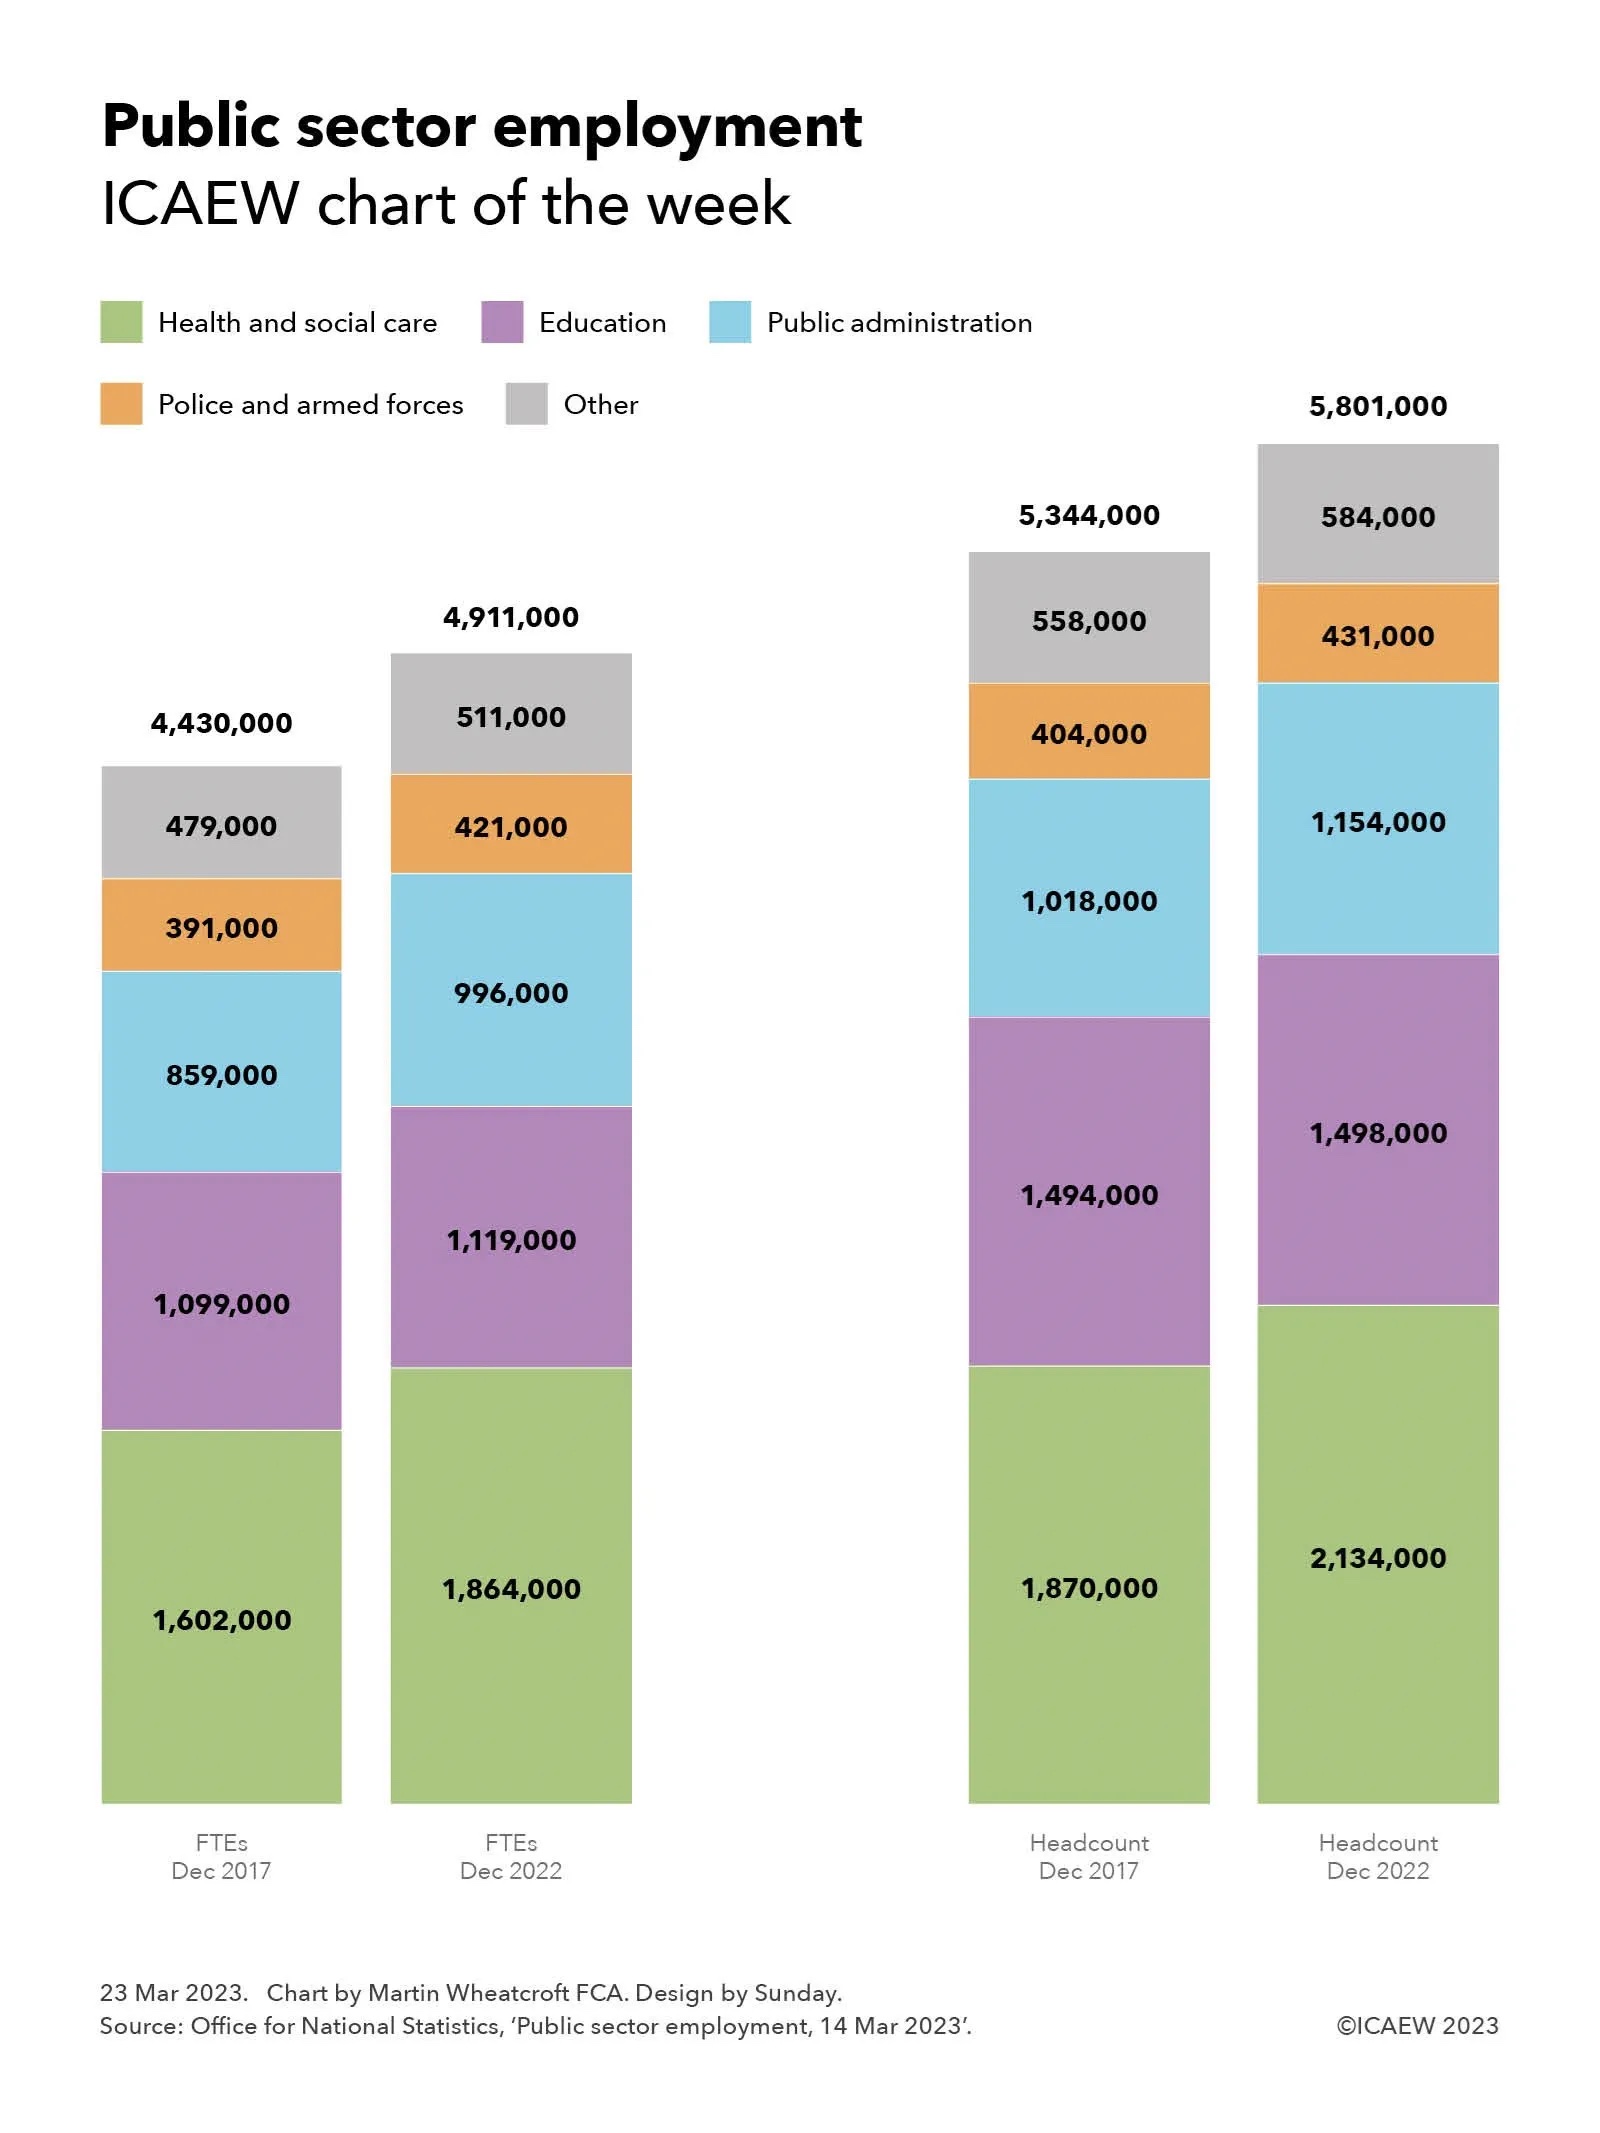
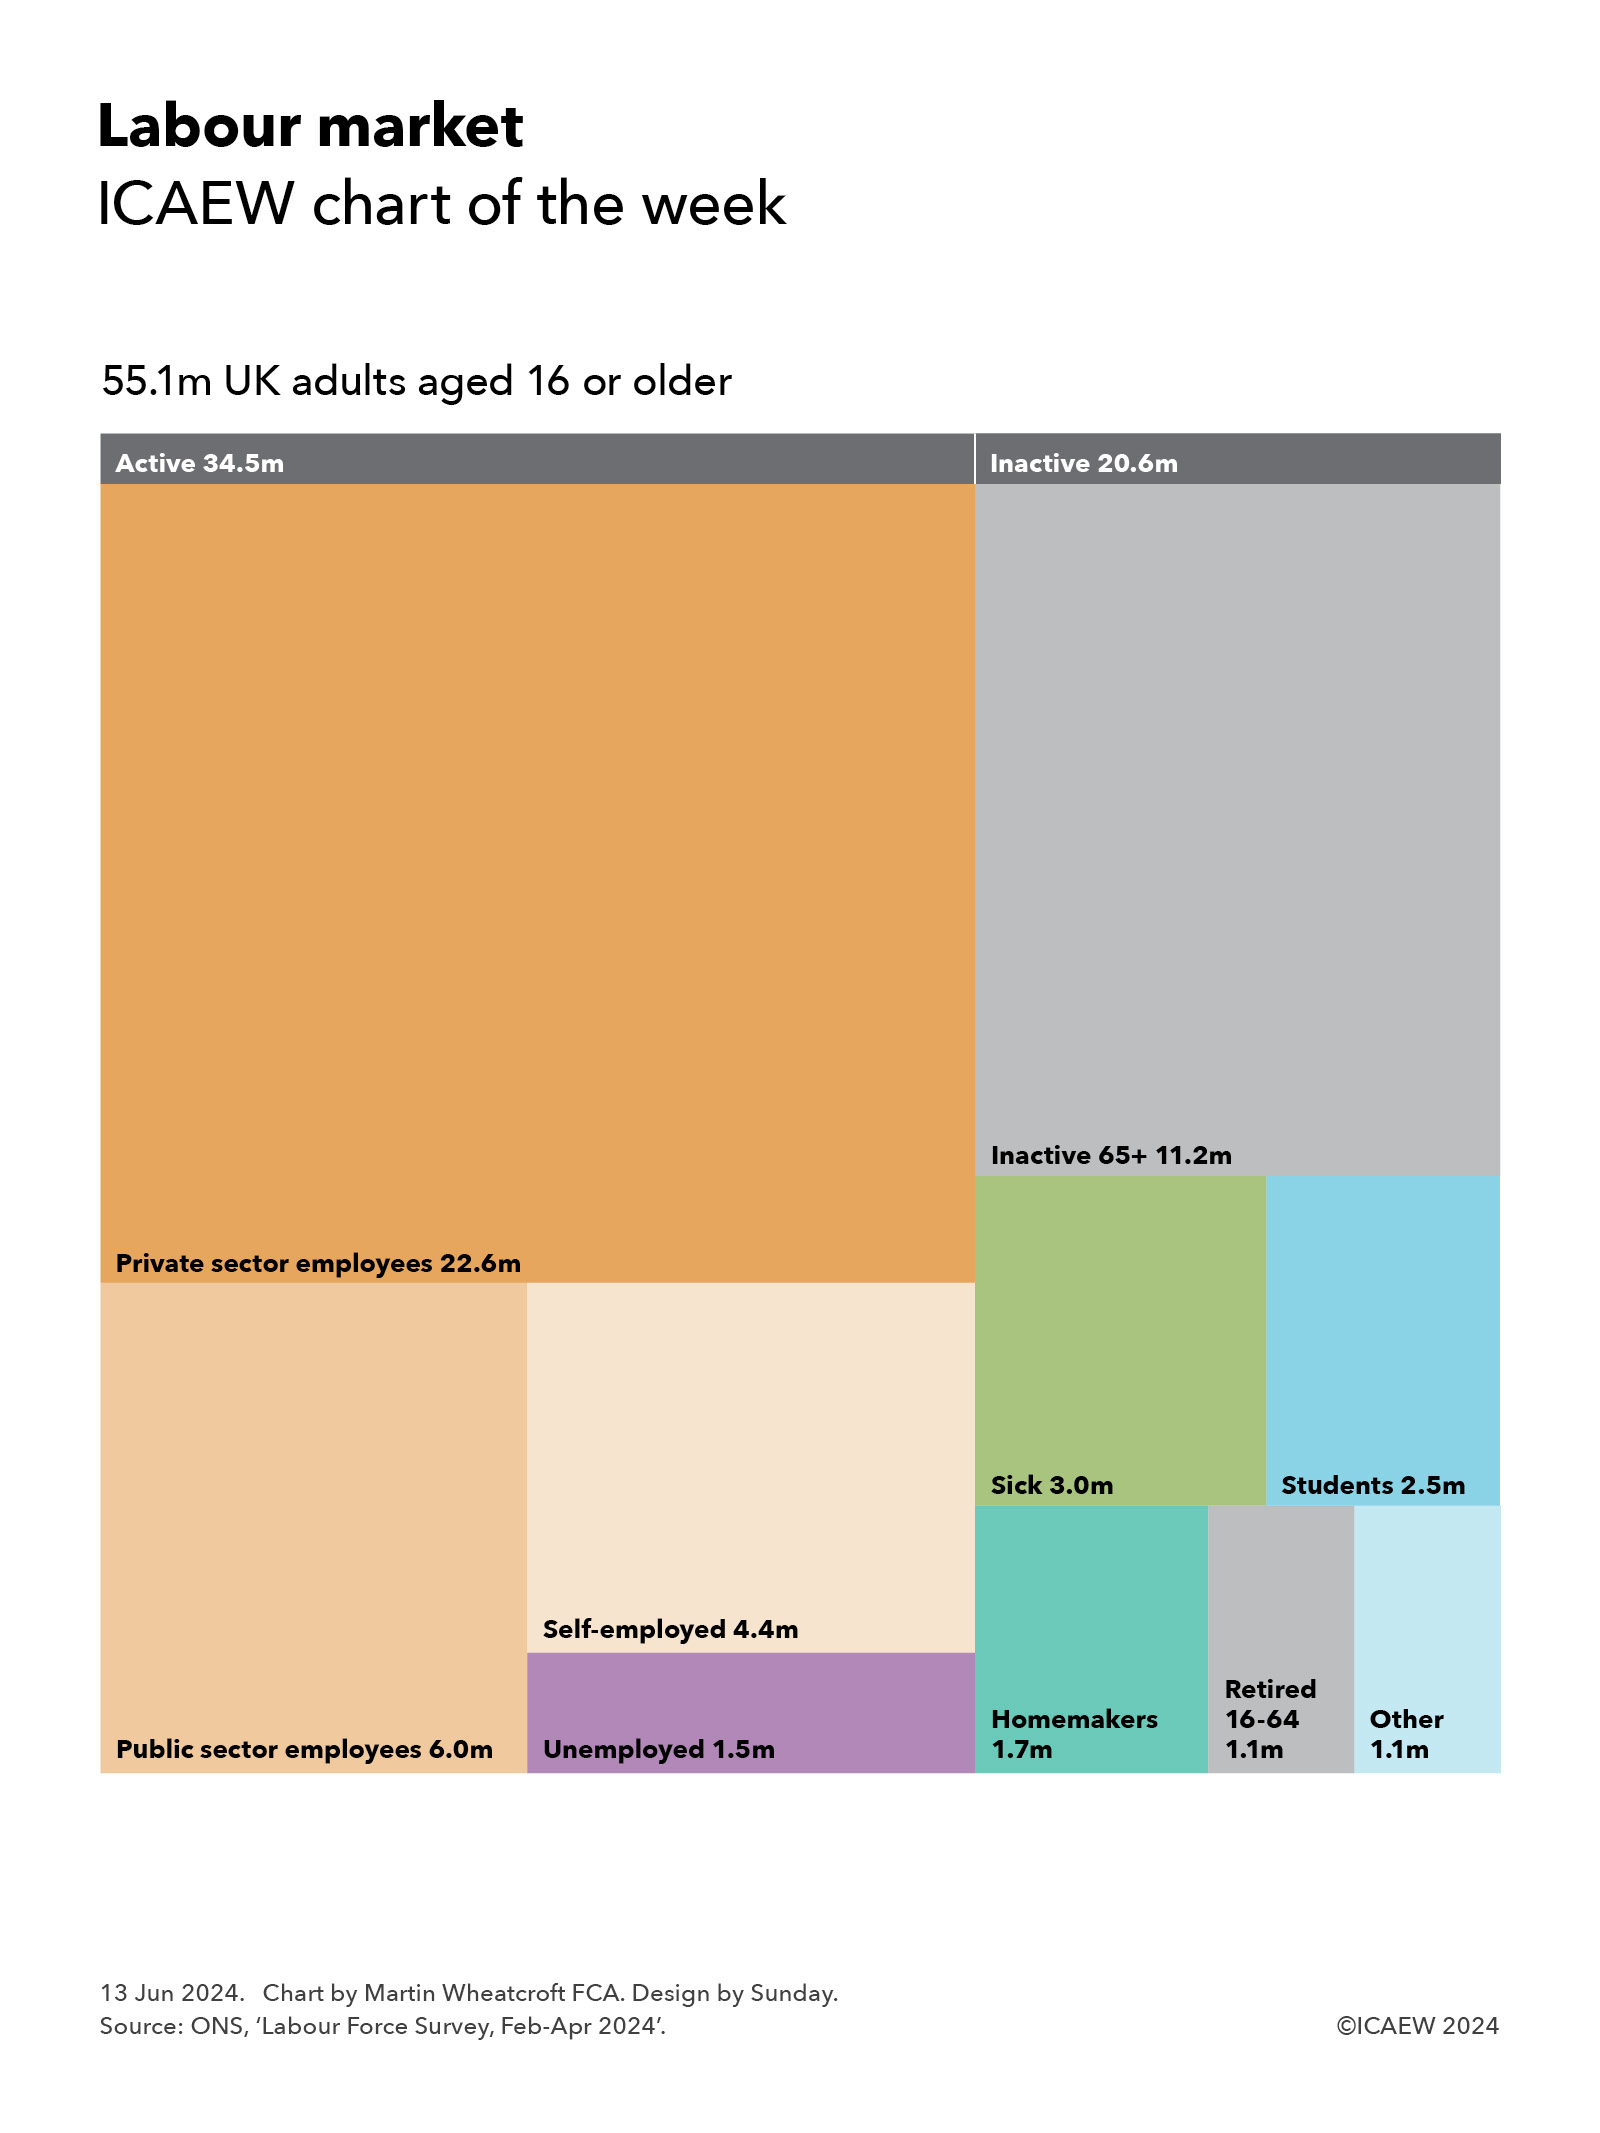
According to the latest numbers, there are 34.5m economically active individuals in the UK, comprising 22.6m private sector employees, 6.0m public sector employees, 4.4m self-employed and 1.5m unemployed.
A further 20.6m adults are not economically active, comprising 11.2m individuals aged 65 or more (most of whom are retired), 3.0m aged 16-64 who are sick, 2.5m students, 1.7m homemakers, 1.1m who have taken early retirement, and 1.1m others who are either not active for other reasons, or where the reason they are not active is not clear.
The 2.5m student number excludes 1.2m students and pupils with part-time jobs, who are included within the economically active category.
The inactive total includes 1.7m adults aged 16-64 who don’t meet the criteria to be officially classified as unemployed but say that they would like a job, comprising 0.3m or so students, 0.4m homemakers, 0.7m sick and 0.3m other.
The inactive numbers between age 16 and 64 have been broadly stable over the past few years (plus or minus 0.1m) with the exception of the number who are sick. This has increased from 2.3m (2.1m long-term sick and 0.2m temporarily sick) in the same period in 2020 – at the start of the pandemic – to 3.0m (2.8m long-term sick and 0.2m temporarily sick) today. This is a 32% increase in the number of long-term sick, a major issue both for the economy and the NHS.
The 33.0m people in work include 1.5m who are aged 65 or over, but unfortunately the ONS doesn’t provide a breakdown between those in work who are aged 65 (and therefore still shy of the state retirement age) and those who are aged 66 or more who could retire but have chosen or need to continue working.
Public sector employees comprise 2.0m in the NHS, 1.5m in education, 1.2m in public administration (including 0.5m in the civil service), 0.4m in the police and armed forces, 0.2m in other health and social work, and 0.7m in other areas.
According to the ONS, the employment rate is 74.3%, being the total of those in work between 16 and 64 (33.0m total – 1.5m over 65 = 31.5m) divided by the total number aged between 16 and 64 (31.5m in work + 1.5m unemployed + 9.4m inactive = 42.4m).
In contrast, the unemployment rate of 4.4% is calculated including those aged 65 or more but excluding those who are inactive, dividing the just over 1.5m who are officially unemployed (of whom 48,000 are 65 or more) by the just under 34.5m total number of economically active individuals