This week’s chart reviews the sharp increase in the national debt to GDP ratio as we reflect on the challenges facing Chancellor Rishi Sunak.
Better tax receipts and higher inflation are expected to contribute to an improvement in the fiscal forecasts that will accompany the Spring Statement on 23 March 2022, further increasing the pressure on the Chancellor to do more to support households and businesses facing spiralling energy prices and a cost-of-living crisis.
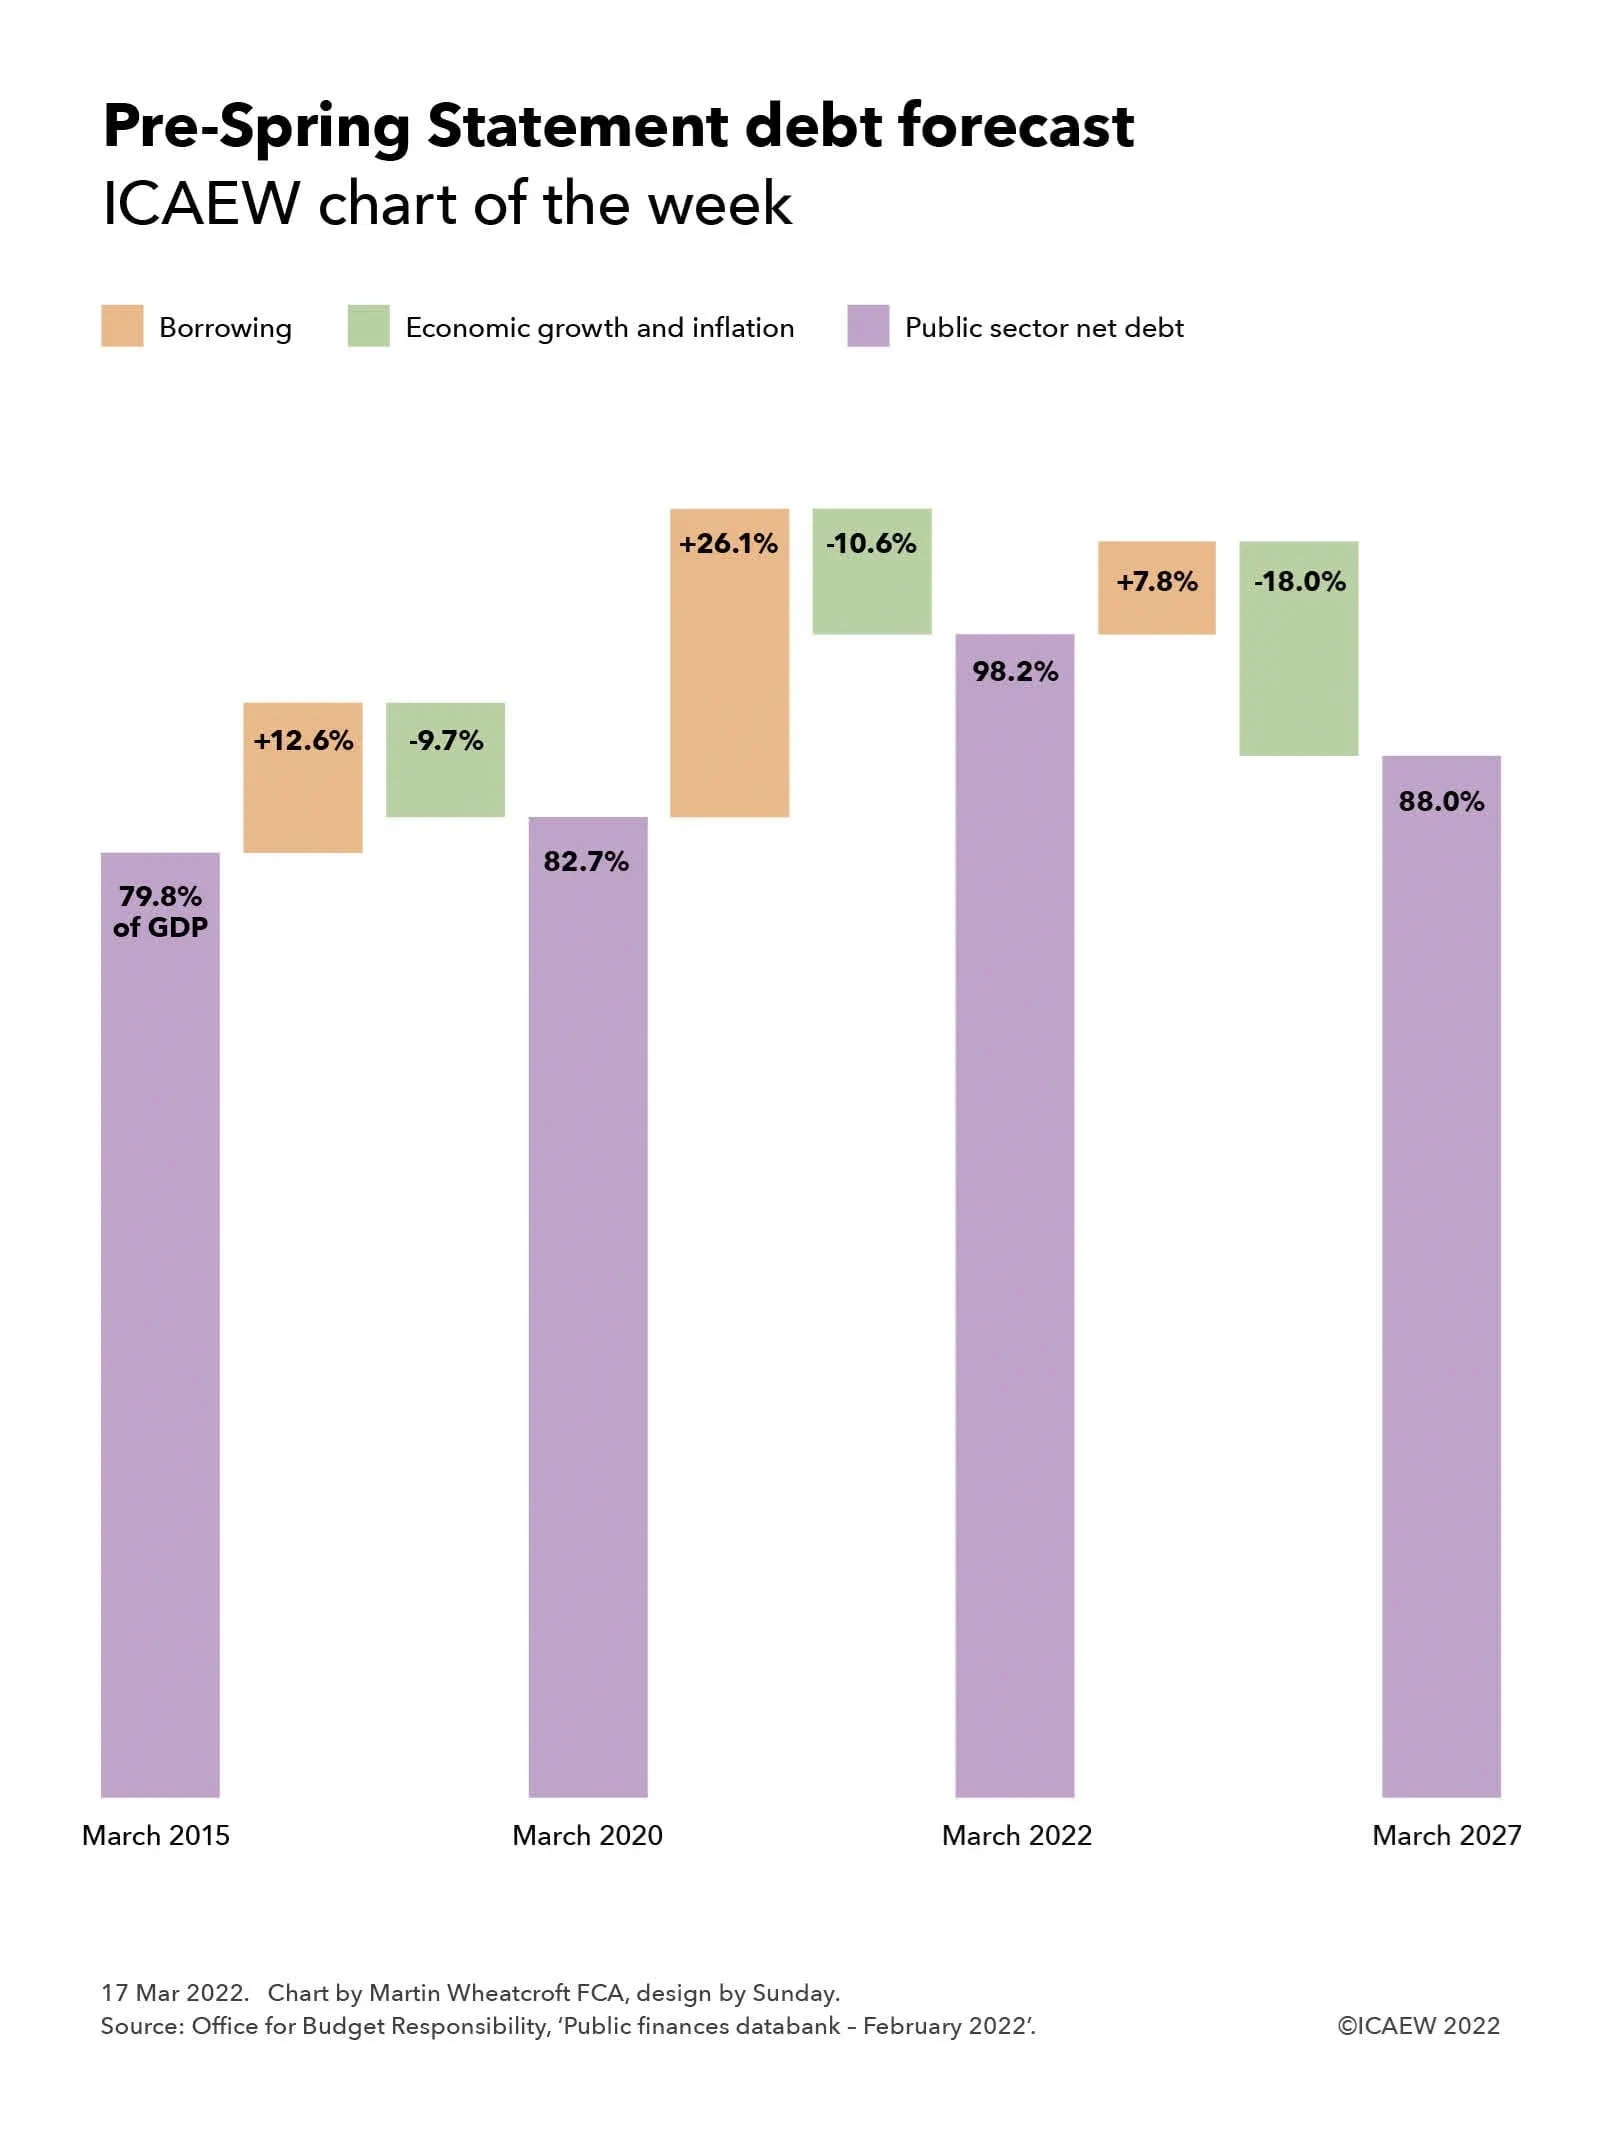
Our chart this week is based on the latest official forecast for public sector net debt prior to its update on 23 March 2022 at the Spring Statement. The chart highlights how it took five years for debt to increase from 79.8% to 82.7% as a share of GDP before leaping to a projected 98.2% over the two years to 31 March 2022 and then falling to a projected 88.0% at 31 March 2027.
The debt to GDP ratio is probably the most important key performance indicator used by most governments to assess their public finances, so much so that when ministers talk about reducing debt, they do not mean paying back the amounts owed to debt investors (unless they are in the German government). Instead, governments in most developed countries aim to borrow at a slower rate than the increase in the size of the economy, allowing the combination of economic growth and inflation to offset the often-significant sums of cash required to finance the shortfall between tax receipts and public spending.
This objective has been difficult to achieve over the past decade of low economic growth and low inflation, as illustrated by the increase in the UK’s debt to GDP ratio from 79.8% to 82.7% between 31 March 2015 and 2020. In cash terms, public sector net debt increased by £261bn from £1,532bn to £1,793bn over that five-year period, equivalent to 12.6% of a year’s GDP. The debt to GDP ratio only went up by 2.9 percentage points, with economic growth and inflation offsetting the increase in the amounts owed by the equivalent of 9.7% of GDP. (The objective would have been achieved but for a quirk in the choice of GDP measure used for this calculation by the Office for National Statistics in the UK, which is ‘mid-year GDP’; at 31 March 2020 this encompassed both the last six months of 2019/20 before the pandemic but also the first six months of 2020/21 and the lockdowns that occurred during that time, reversing some of the economic growth experienced in the preceding five years.)
The chart goes onto illustrate how the more than half a trillion pounds (£576bn or 26.1% of GDP) borrowed by the government in just two years over the course of the pandemic is partially offset by the economic recovery and a great deal more inflation, reducing the impact on the debt to GDP ratio by the equivalent of 10.6%.
Debt as a share of GDP over the next five years is then expected to decline, with a projected net addition of £198bn (7.8% of GDP) expected to be added to debt according to last October’s forecast. Projected public sector net debt of £2,567bn at 31 March 2027 is currently expected to be lower in proportion to the size of the economy at 88.0% of GDP, as the post-pandemic recovery and already forecast higher rates of inflation cause GDP to rise at a faster rate than the government can borrow, resulting in a reduction equivalent to 18.0% of GDP.
The official projections for the current financial year, prepared last October by the Office for Budget Responsibility (OBR), are expected to be revised upwards to incorporate the stronger tax receipts reported in recent monthly public sector finance reports and higher levels of GDP from even higher rates of inflation than previously expected. These effects are likely to combine to reduce the 98.2% of GDP forecast for debt for the end of March 2022 by several percentage points.
There is a much greater deal of uncertainty about how the OBR’s medium-term projections will deal with the potential future path of the pandemic, the cost-of-living squeeze on household incomes, and the effect of the war in Ukraine and sanctions on Russia on UK businesses. This is in addition to its normal difficulty in both measuring and forecasting the trillions of financial transactions that are undertaken every year in an economy of more than 67m people.
Many economic commentators expect stronger tax receipts and higher inflation to flow through to the projections for the next five years, even after taking account of the increased interest costs that come from higher rates of inflation and higher interest rates and the already announced package of support measures for households struggling with energy price rises. This should in theory result in a substantial improvement in the projected debt to GDP ratio in March 2027 from the 88.0% previously forecast, but what we won’t know until the Spring Statement is to what extent Chancellor Rishi Sunak intends to spend some of that improvement.
Mixed signals mean that it is difficult to tell to whether there will be an improvement to the support package to households facing large rises in their energy costs and the prices they pay for food and other essentials, whether the Chancellor will also choose to reduce fuel duties to help motorists, and how far he will opt to support businesses affected by substantially higher input costs in addition to the knock-on effects of the war in Ukraine and sanctions on Russia. Not to mention the political pressure on the Chancellor to announce increases in the defence budget now rather than waiting for the Autumn Budget.
For what was envisioned as a quiet fiscal occasion dealing with routine revisions to the fiscal forecasts, the Spring Statement has turned into a significant fiscal event. After all, even if the Chancellor decides to do nothing, that will still be a choice, with major implications for the public finances and the UK economy.
As the sage once said (or possibly didn’t), we live in fiscally interesting times.