The ICAEW chart this week highlights how every single region and nation in the UK was in deficit in the first fiscal year of the pandemic.
Our chart this week highlights how every single region and nation in the UK was in deficit in the first fiscal year of the pandemic.
The Office for National Statistics (ONS) recently released an analysis of government revenue and expenditure by region and nation of the UK for the financial year ended 31 March 2021 – the first year of the pandemic.
This was a year that saw public spending balloon to £1,112bn from £884bn in 2019/20 as the government splurged cash in response to the arrival of the coronavirus. At the same time, taxes and other income fell to £794bn in 2020/21 from £829bn the year before, while unprecedented levels of support to businesses and individuals prevented a much greater collapse in tax receipts. The resulting deficit of £318bn was the largest ever in peacetime.
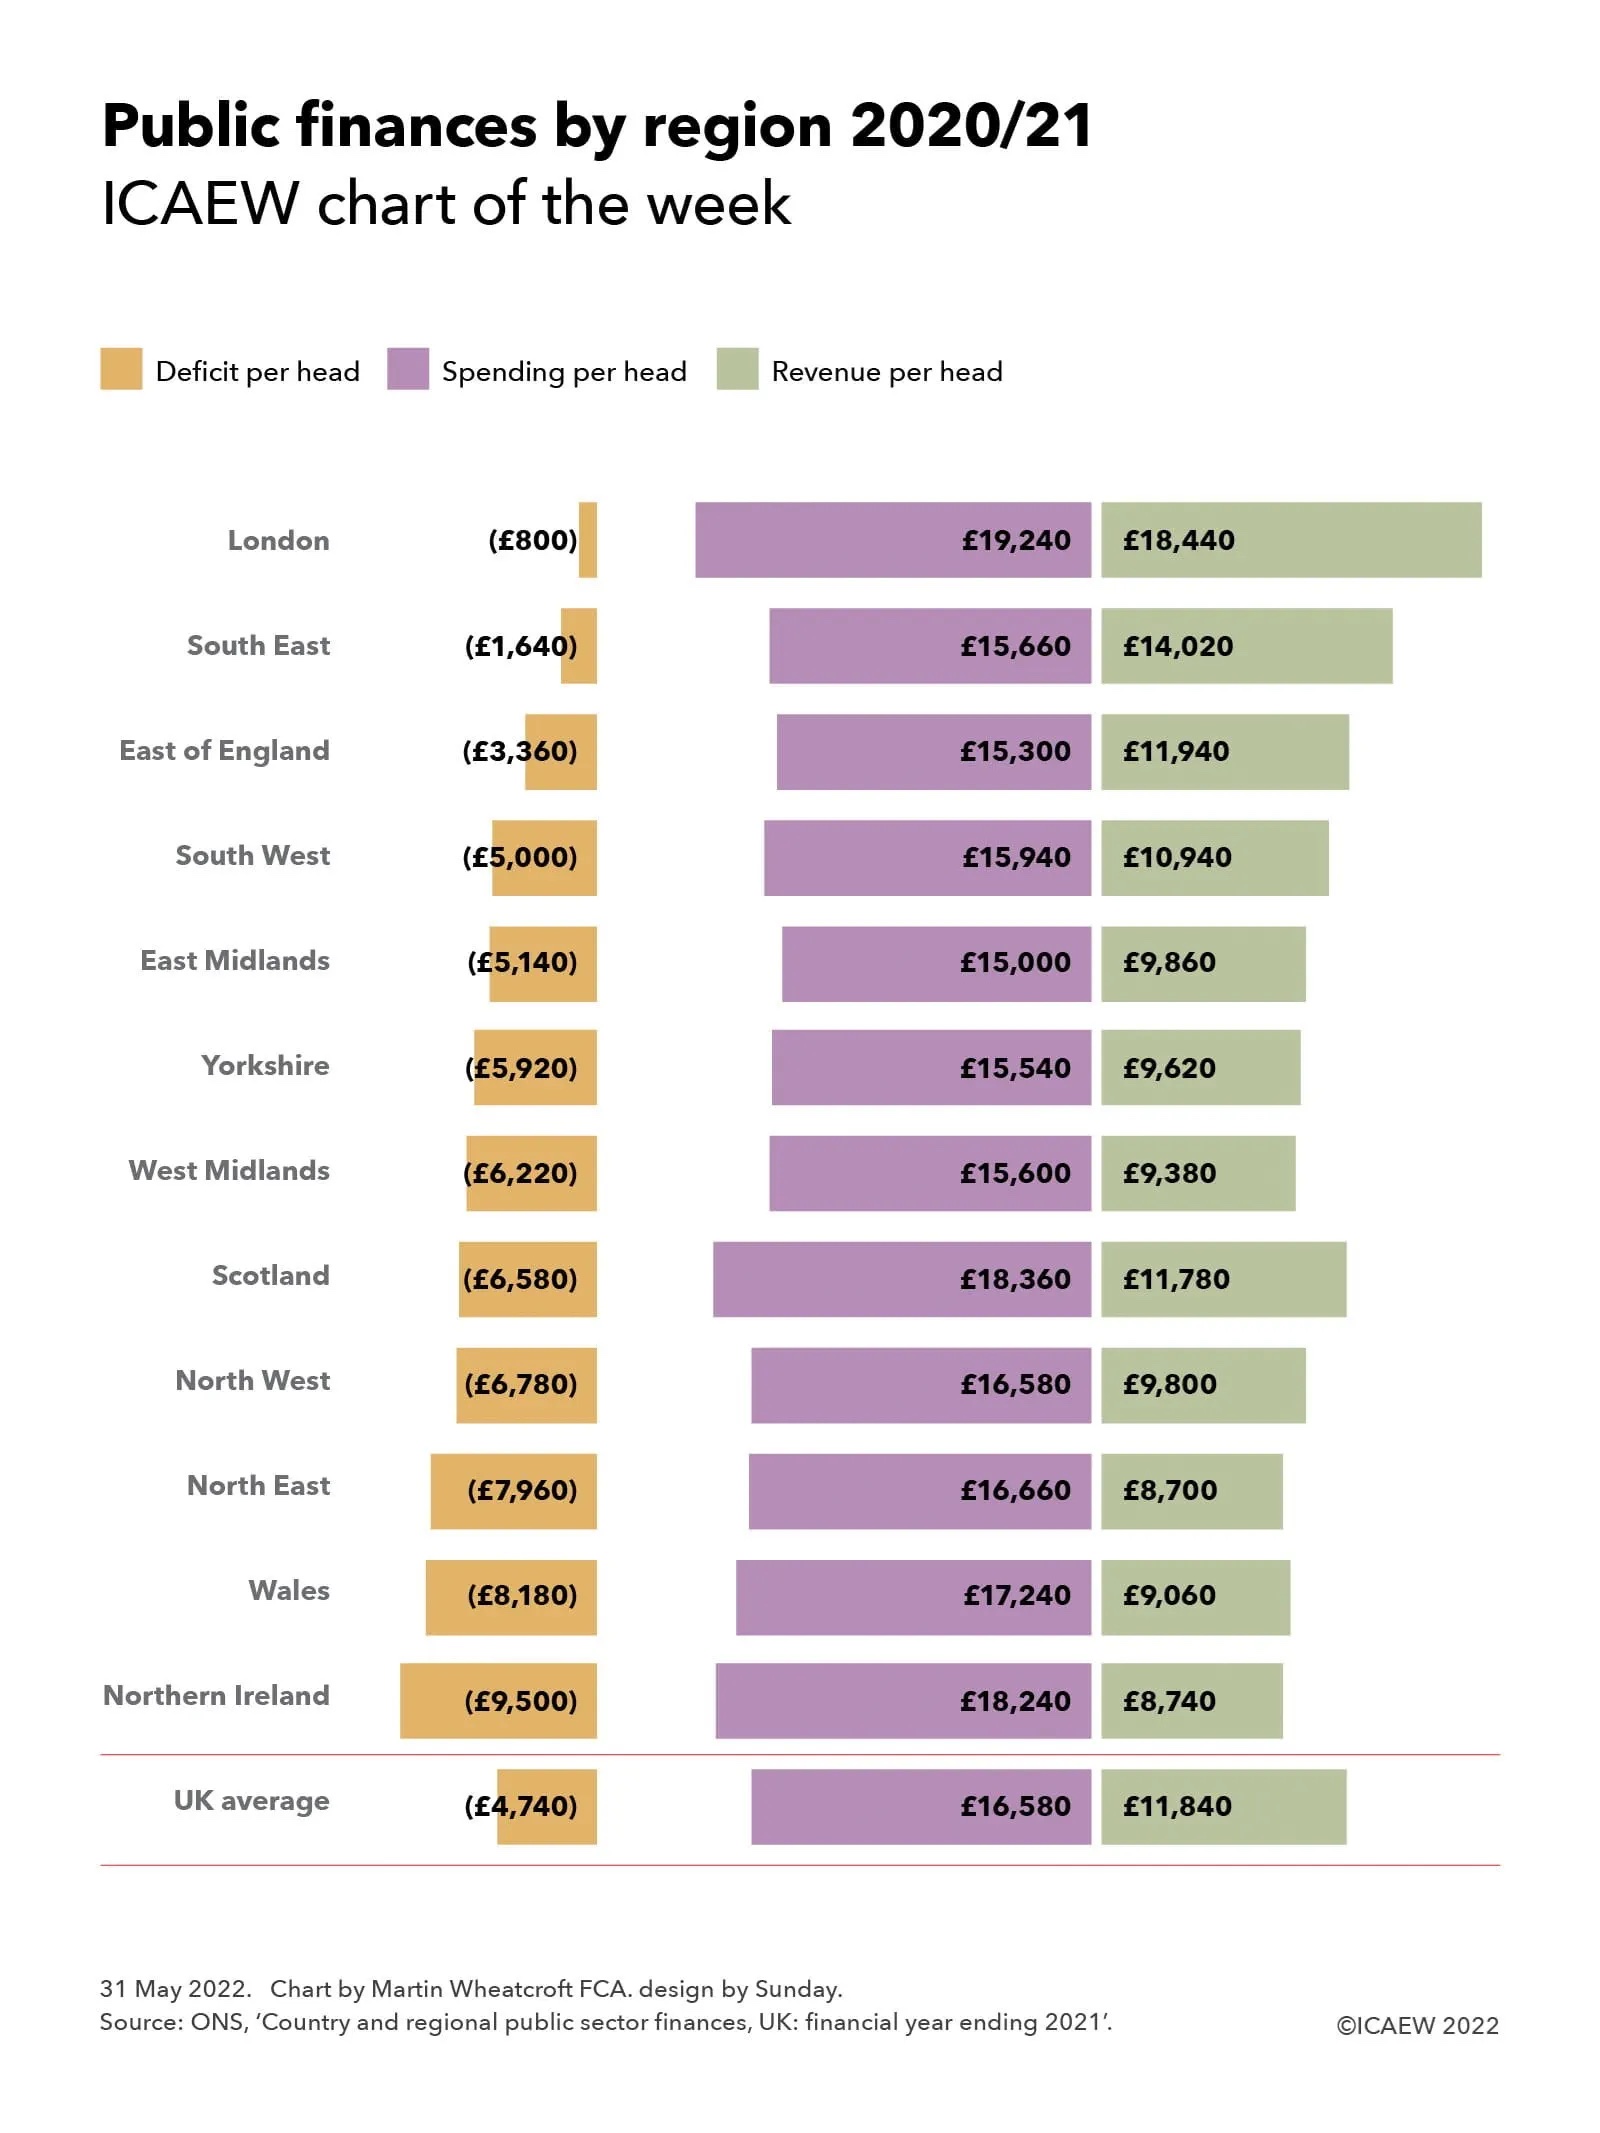
The chart illustrates how every region incurred a deficit in 2020/21, with a deficit per head of approximately £800 in Greater London (revenue per head £18,440/expenditure per head £19,240), followed by £1,640 in the South East (£14,020/£15,660), £3,360 in the East of England (£11,940/£15,300), £5,000 in the South West (£10,940/£15,940), £5,140 in the East Midlands (£9,860/£15,000), £5,920 in Yorkshire and The Humber (£9,620/£15,540), £6,220 in the West Midlands Region (£9,380/£15,600), £6,580 in Scotland (£11,780/£18,360), £6,780 in the North West (£9,800/£16,580), £7,960 in the North East (£8,700/£16,660), £8,180 in Wales (£9,060/£17,240) and £9,500 in Northern Ireland (£8,740/£18,240). These numbers compare with an overall UK average deficit of approximately £4,740 per person, comprising per capita revenue of £11,840 less per capita spending of £16,580 based on a population of 67.1m.
The deficit in 2020/21 was so large that even London and the South East, which normally supply substantially more revenue to the government than they receive back in expenditure, saw the reverse this time. (In contrast, for example, with the surpluses of £4,520 and £2,180 per head respectively in 2019/20.)
Inclusive of pandemic spending, most regions ended up benefiting from government expenditure and welfare support of between £15,000 and £17,000 per person in the year, the outliers being Scotland and Northern Ireland, where spending exceeded £18,000 and London where it exceeded £19,000 per head. There is much wider range in the average for taxes and other income, from less than £9,000 per person in in the North East and Northern Ireland (more than 25% lower than the UK-wide average) up to more than £14,000 per head in the South East and more than £18,000 per head in London (more than 50% higher than the UK average).
For the public finances 2020/21 was a landmark year, in which exceptional levels of expenditure and an extraordinarily large deficit led to a significant increase in public debt. Despite that – as our chart illustrates – there continue to be significant economic and fiscal disparities across the regions and nations of the UK.