Our chart this week is based on the latest population projections for the UK, with an expected 67% increase in the number of people over the age of 75 and a fall in the number under the age of 25 over the next quarter of a century.
The Office for National Statistics (ONS) released 2020-based interim population projections on 12 January 2022 providing an insight into how the population of the UK is expected to change over the next 100 years. They are interim because they don’t include the results of the 2021 Census (which is still being worked on), but they do reflect updated assumptions from the 2018-based projections.
The main differences from the previous projections are a lower fertility rate (revised down from 1.78 to 1.59 per woman) reducing the numbers of births significantly, and slight reductions in anticipated life expectancy (from 82.8 years to 82.2 for males and from 85.7 to 85.3 for females) increasing the number of deaths. This has been partly offset by an increase in net annual long-term international migration from 190,000 a year to 205,000 a year, with a central projection last time of 72.8m people in 2045 revised down to 71.0m. The population is then expected to gradually increase to a peak of 71.8m in 2081, before declining back to 71.0m in 2120.
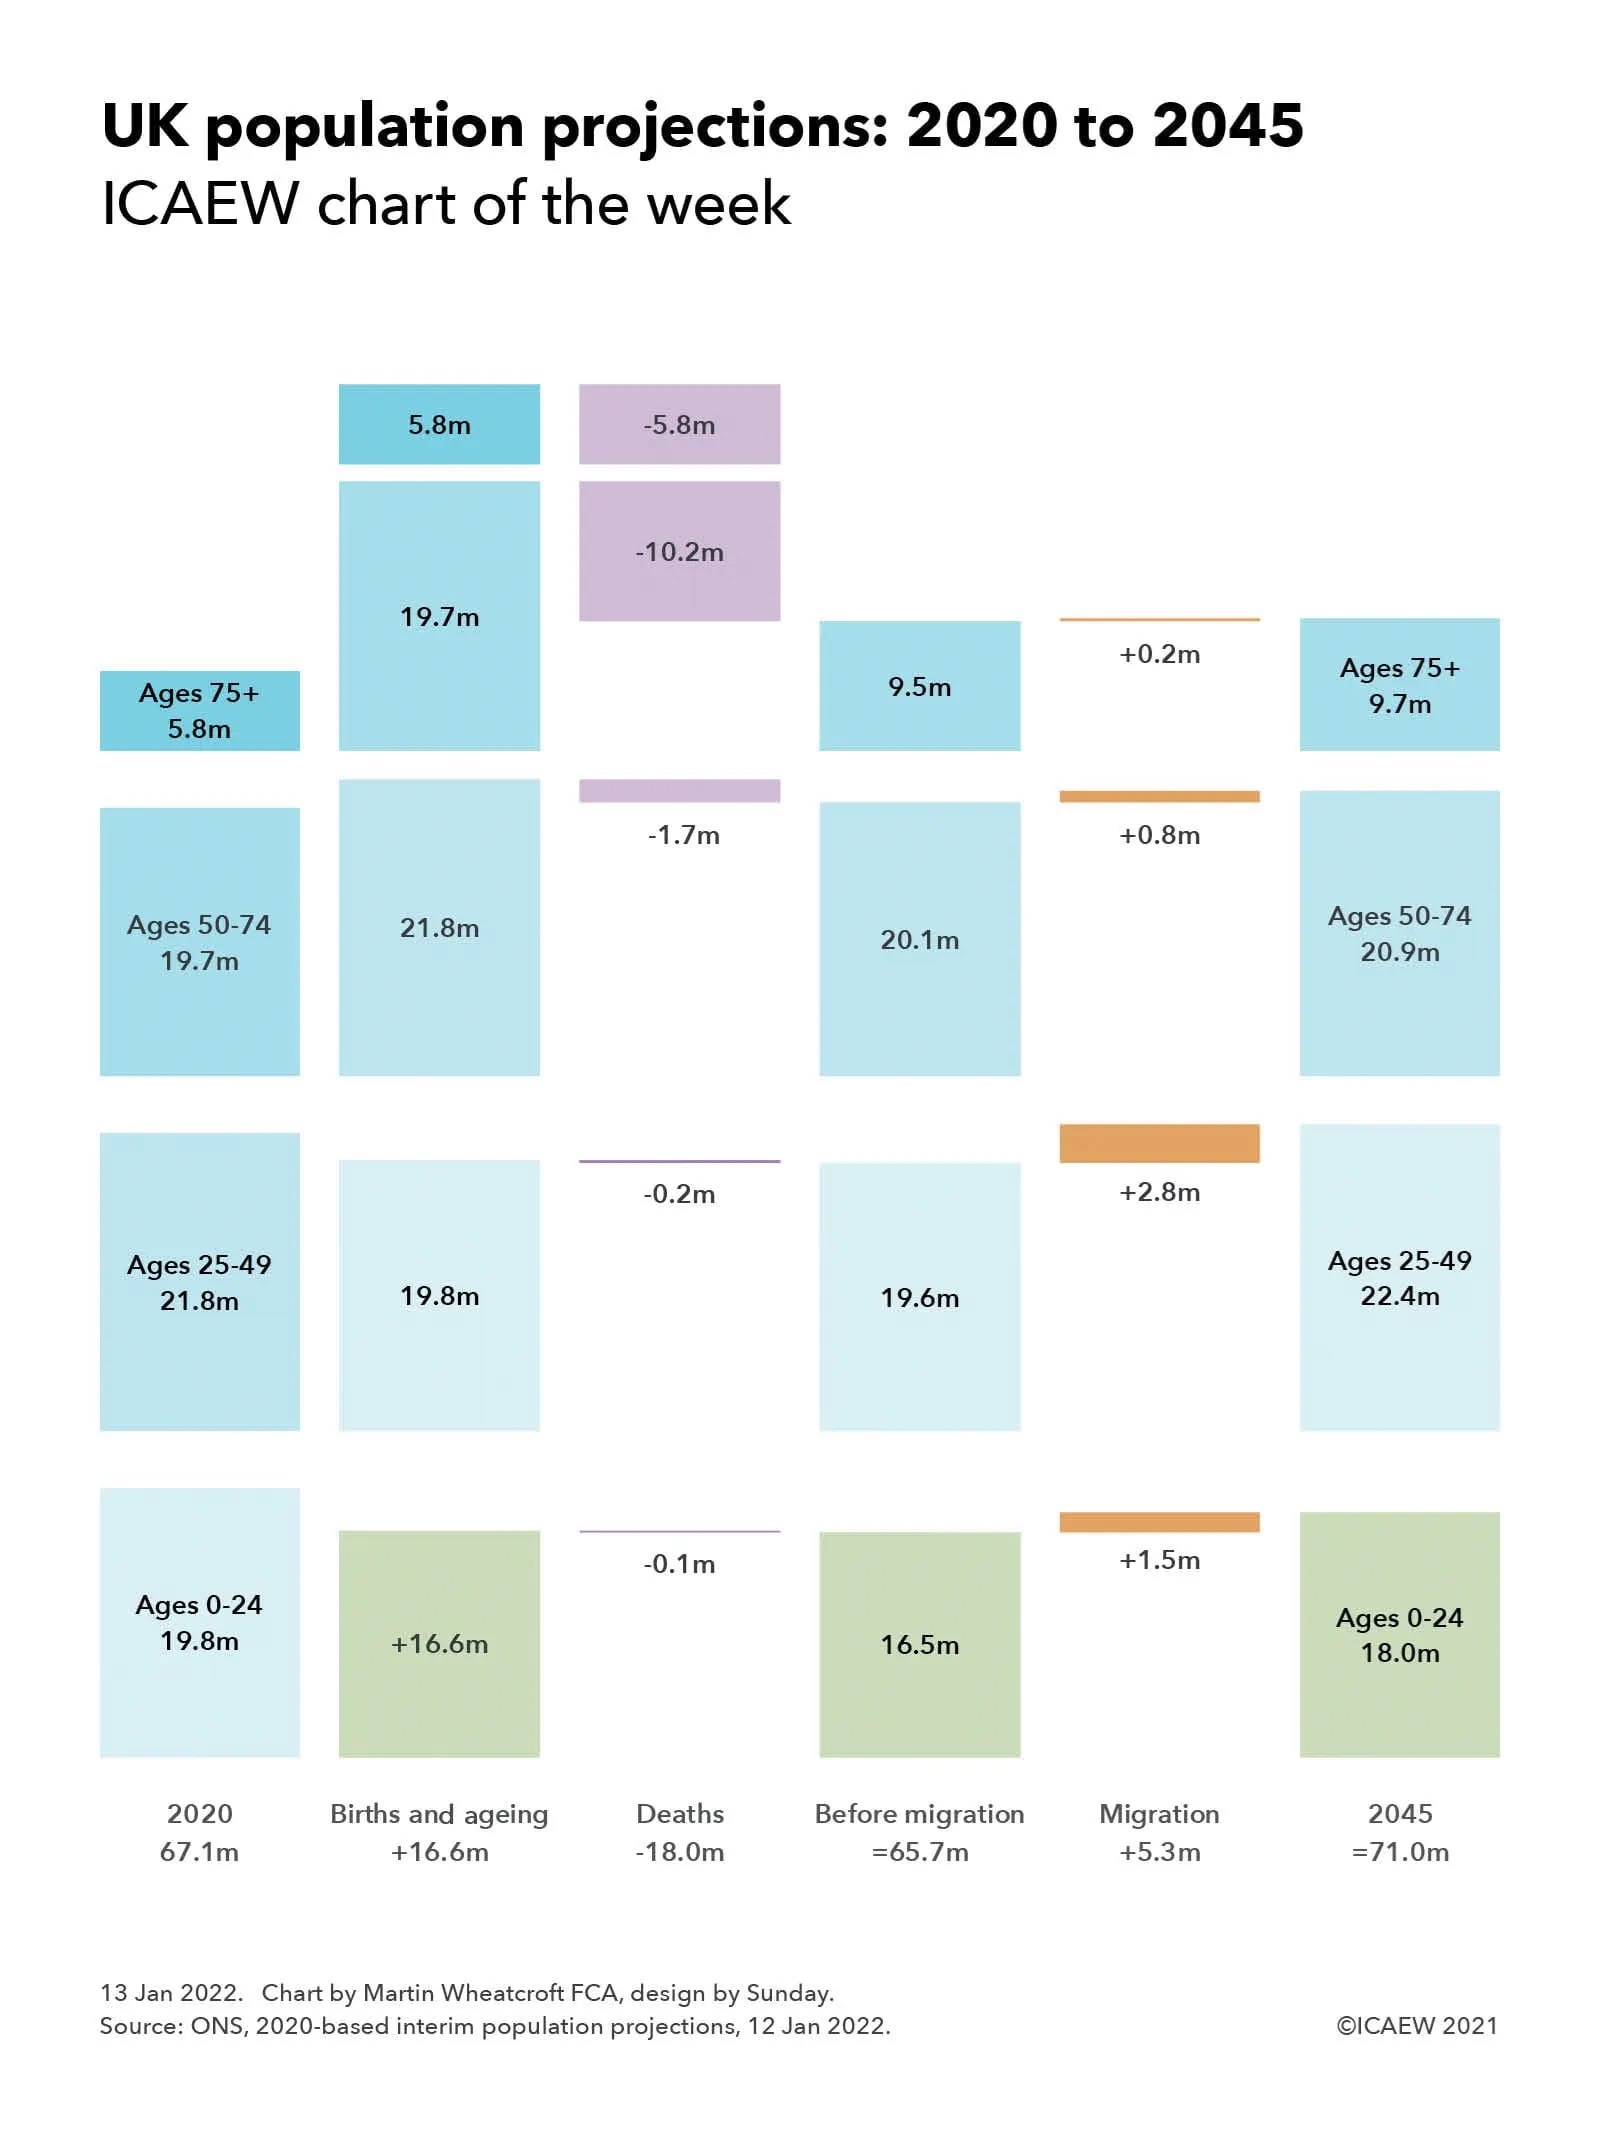
Our chart focuses on the first 25 years of the projections, illustrating how each generation is expected to change over that time. Overall, the estimated population of 67.1m in June 2020 is expected to change by 16.6m births (an average of around 665,000 a year) less 18.0m deaths (720,000 a year), which would result in a fall of 1.4m (55,000 a year) to 65.7m in 2045, at least before taking into account the effects of migration. Estimated net immigration of 5.3m (230,000 a year until 2026, then 205,000 a year) is expected to mean that the population will instead increase, reaching 71.0m in 2045.
There were an estimated 19.8m 0-24 year-olds in 2020, but in a quarter of a century they will all be in the 25-49 age group and so those under 25 will be formed from the 16.6m projected to be born in the 25 years from 2020, which after around 65,000 deaths would be 16.5m before taking account of migration. Some will leave the country and others will arrive, with a projected 1.5m net addition to take the total to 18.0m in 2045, a reduction of 1.8m compared with the previous cohort.
For the 19.8m under-25s in 2020 moving up a cohort to the 25-49 age group in 2045, deaths of 0.2m would reduce this to 19.6m before taking account of net inward migration of 2.8m to get to a projected 22.4m. This is a net increase of 0.6m compared with the previous generation of 21.8m. That generation, which would be aged 50-74 a quarter of a century later, would be reduced by 1.7m deaths to arrive at 20.1m before adding a net 0.8m from migration to get to 20.9m, a 1.2m increase over the 19.7m who were aged 50-74 in 2020.
A much greater proportion of this cohort will not be around in 2045, with a projected 10.2m deaths reducing numbers to 9.5m before adding 0.2m from net inward migration to arrive at a projected total of 9.7m. This is a 67% increase over the current generation of over-75s of 5.8m, with all bar the 38,000 expected to be over 100 in 2045 expected to have passed on, barring major developments in medical science. This compares with the approximately 15,000 people over the age of 100 in 2020.
Overall the rate of increase in the UK population is expected to fall from an estimated 0.4% a year in 2020 to 0.15% by 2045, an average of 0.2% over the coming quarter of a century. This compares with growth rates of 0.6% to 0.8% a year experienced in the last couple of decades, which has been a key driver of economic growth in that time.
The substantial increase in the numbers aged 75 and over is of course a hugely positive development as more people live much longer lives than in previous generations. However, this will have huge implications for the public finances given the cost implications of providing health services, social care and pensions to older generations, particularly those over the age of 75. With proportionately fewer workers (even with planned increases in the retirement age) this is expected to drive higher levels of taxation over the next quarter of a century without much higher levels of economic growth than are currently anticipated.
Fortunately a quarter of a century provides opportunity for governments to address the financial challenges posed by our success in extending lives if they are willing to do so, even with the added debt arising from the pandemic, which is why ICAEW continues to argue for the development of a long-term fiscal strategy to put the public finances on a sustainable path. Such a strategy could make a significant difference to the prosperity of future generations.