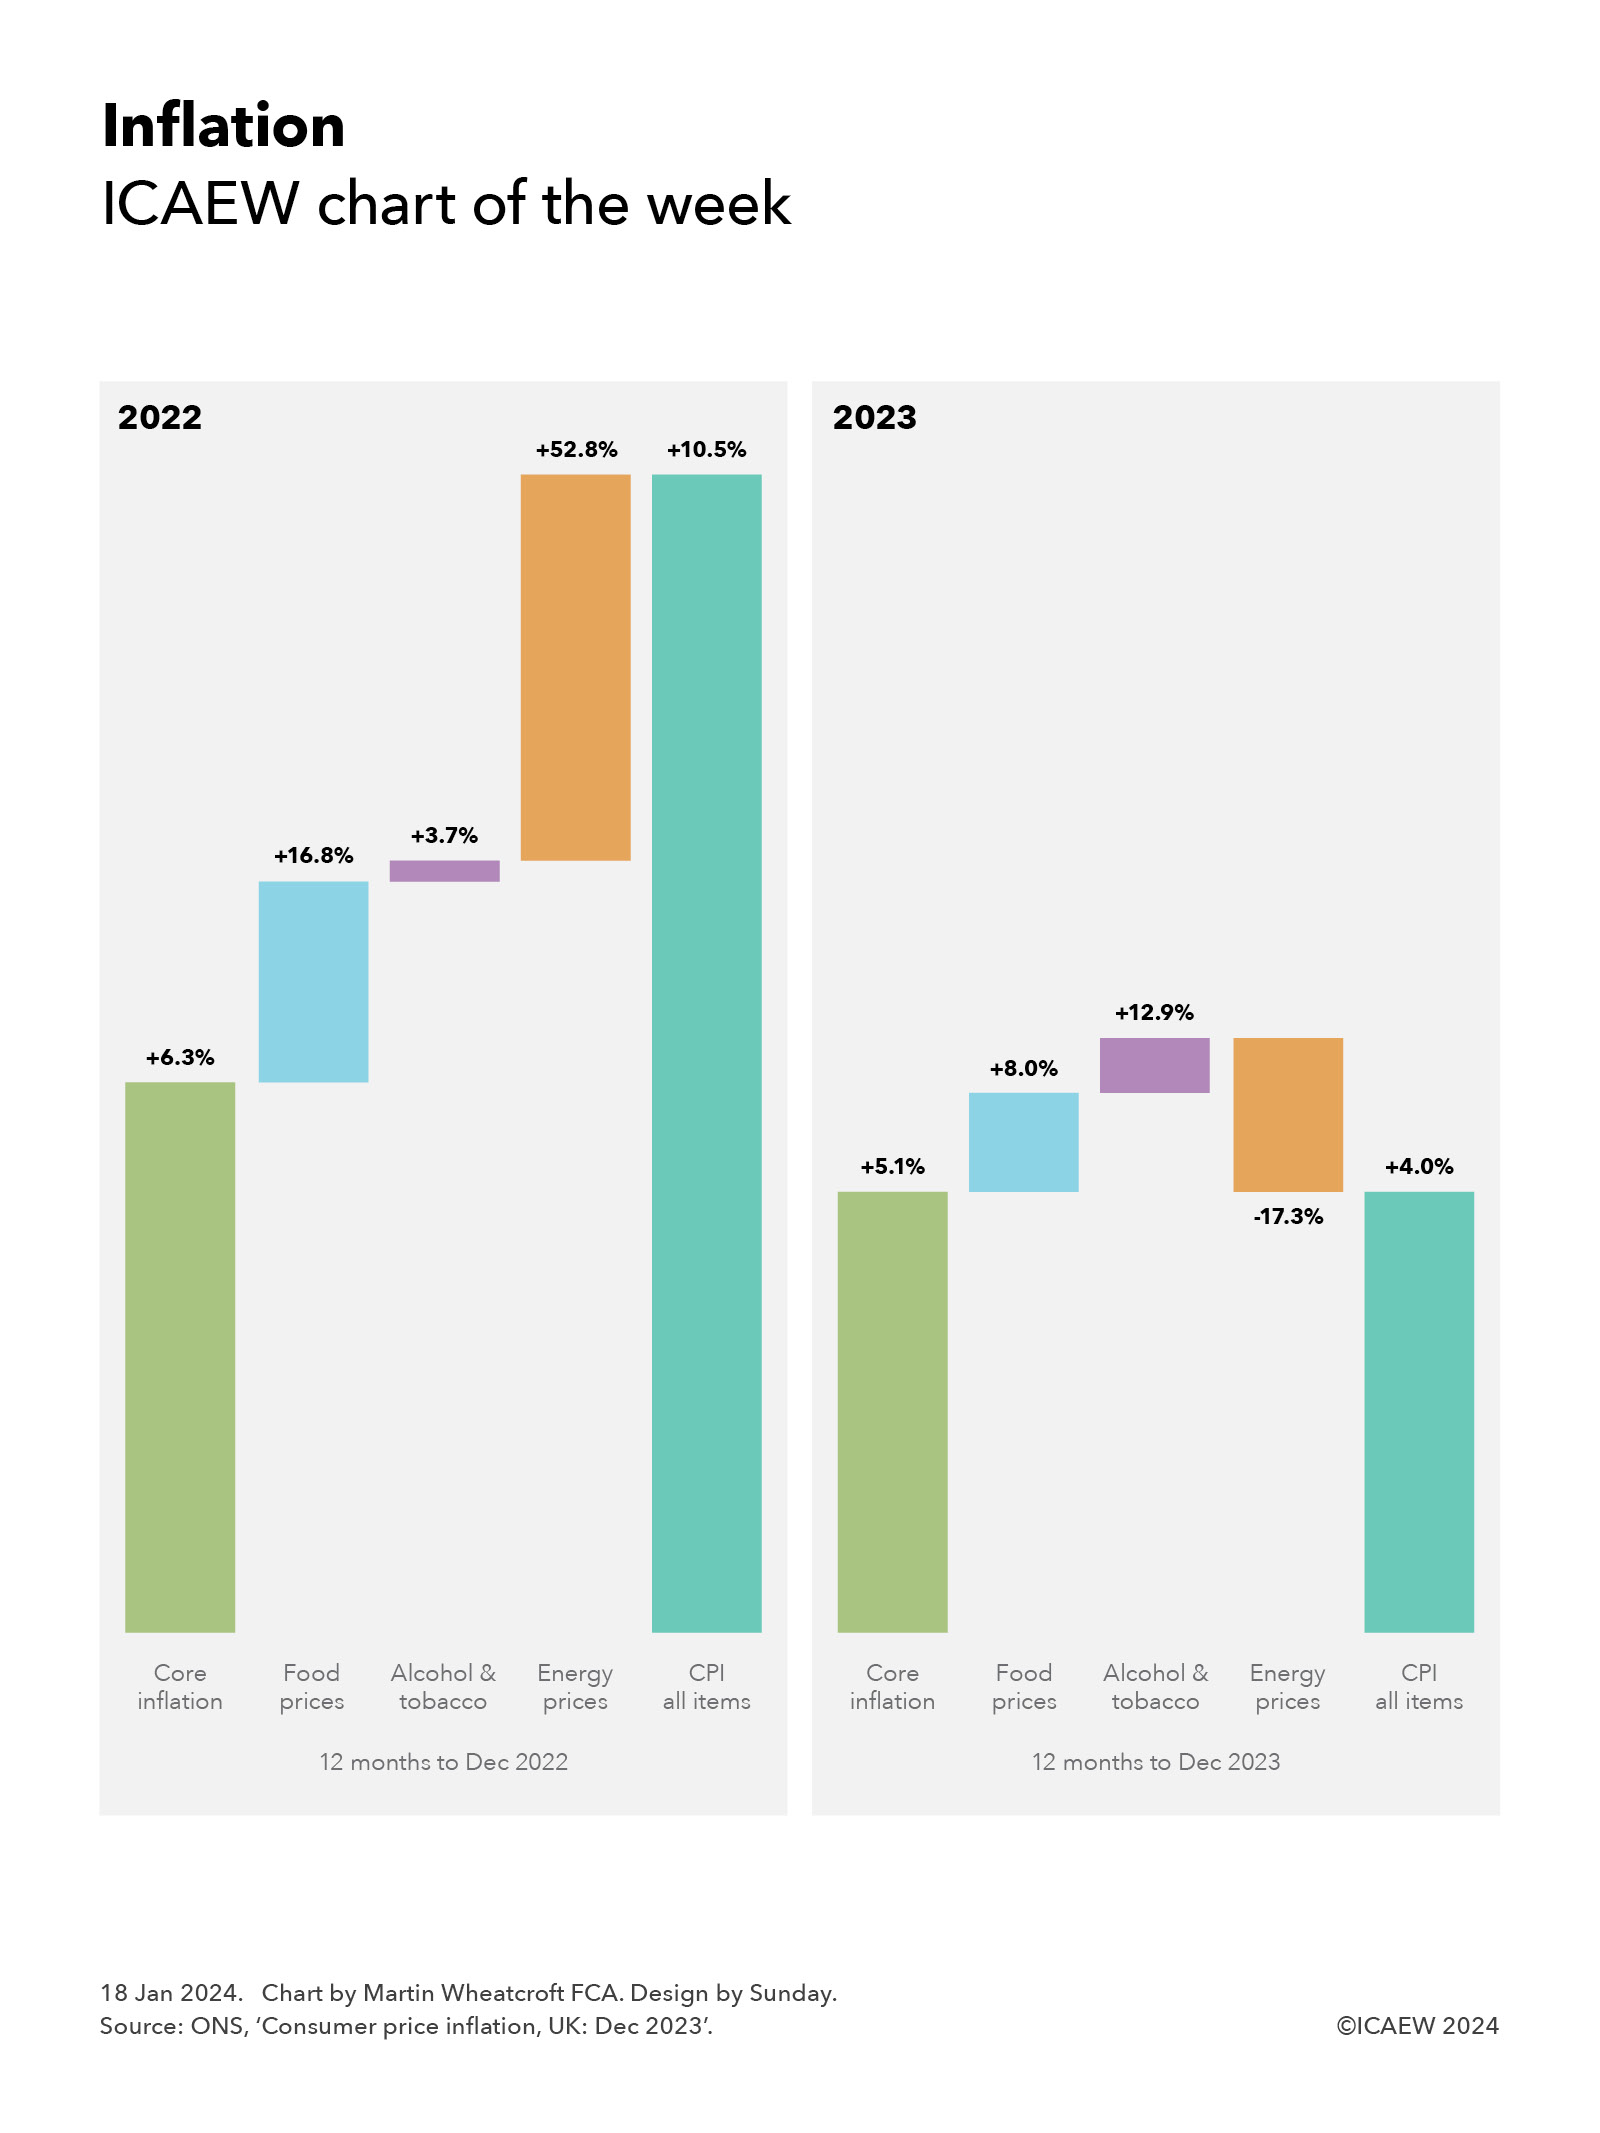
Our chart this week looks at how the jump in annual inflation from 1.7% in September to 2.3% in October was driven by higher energy bills.
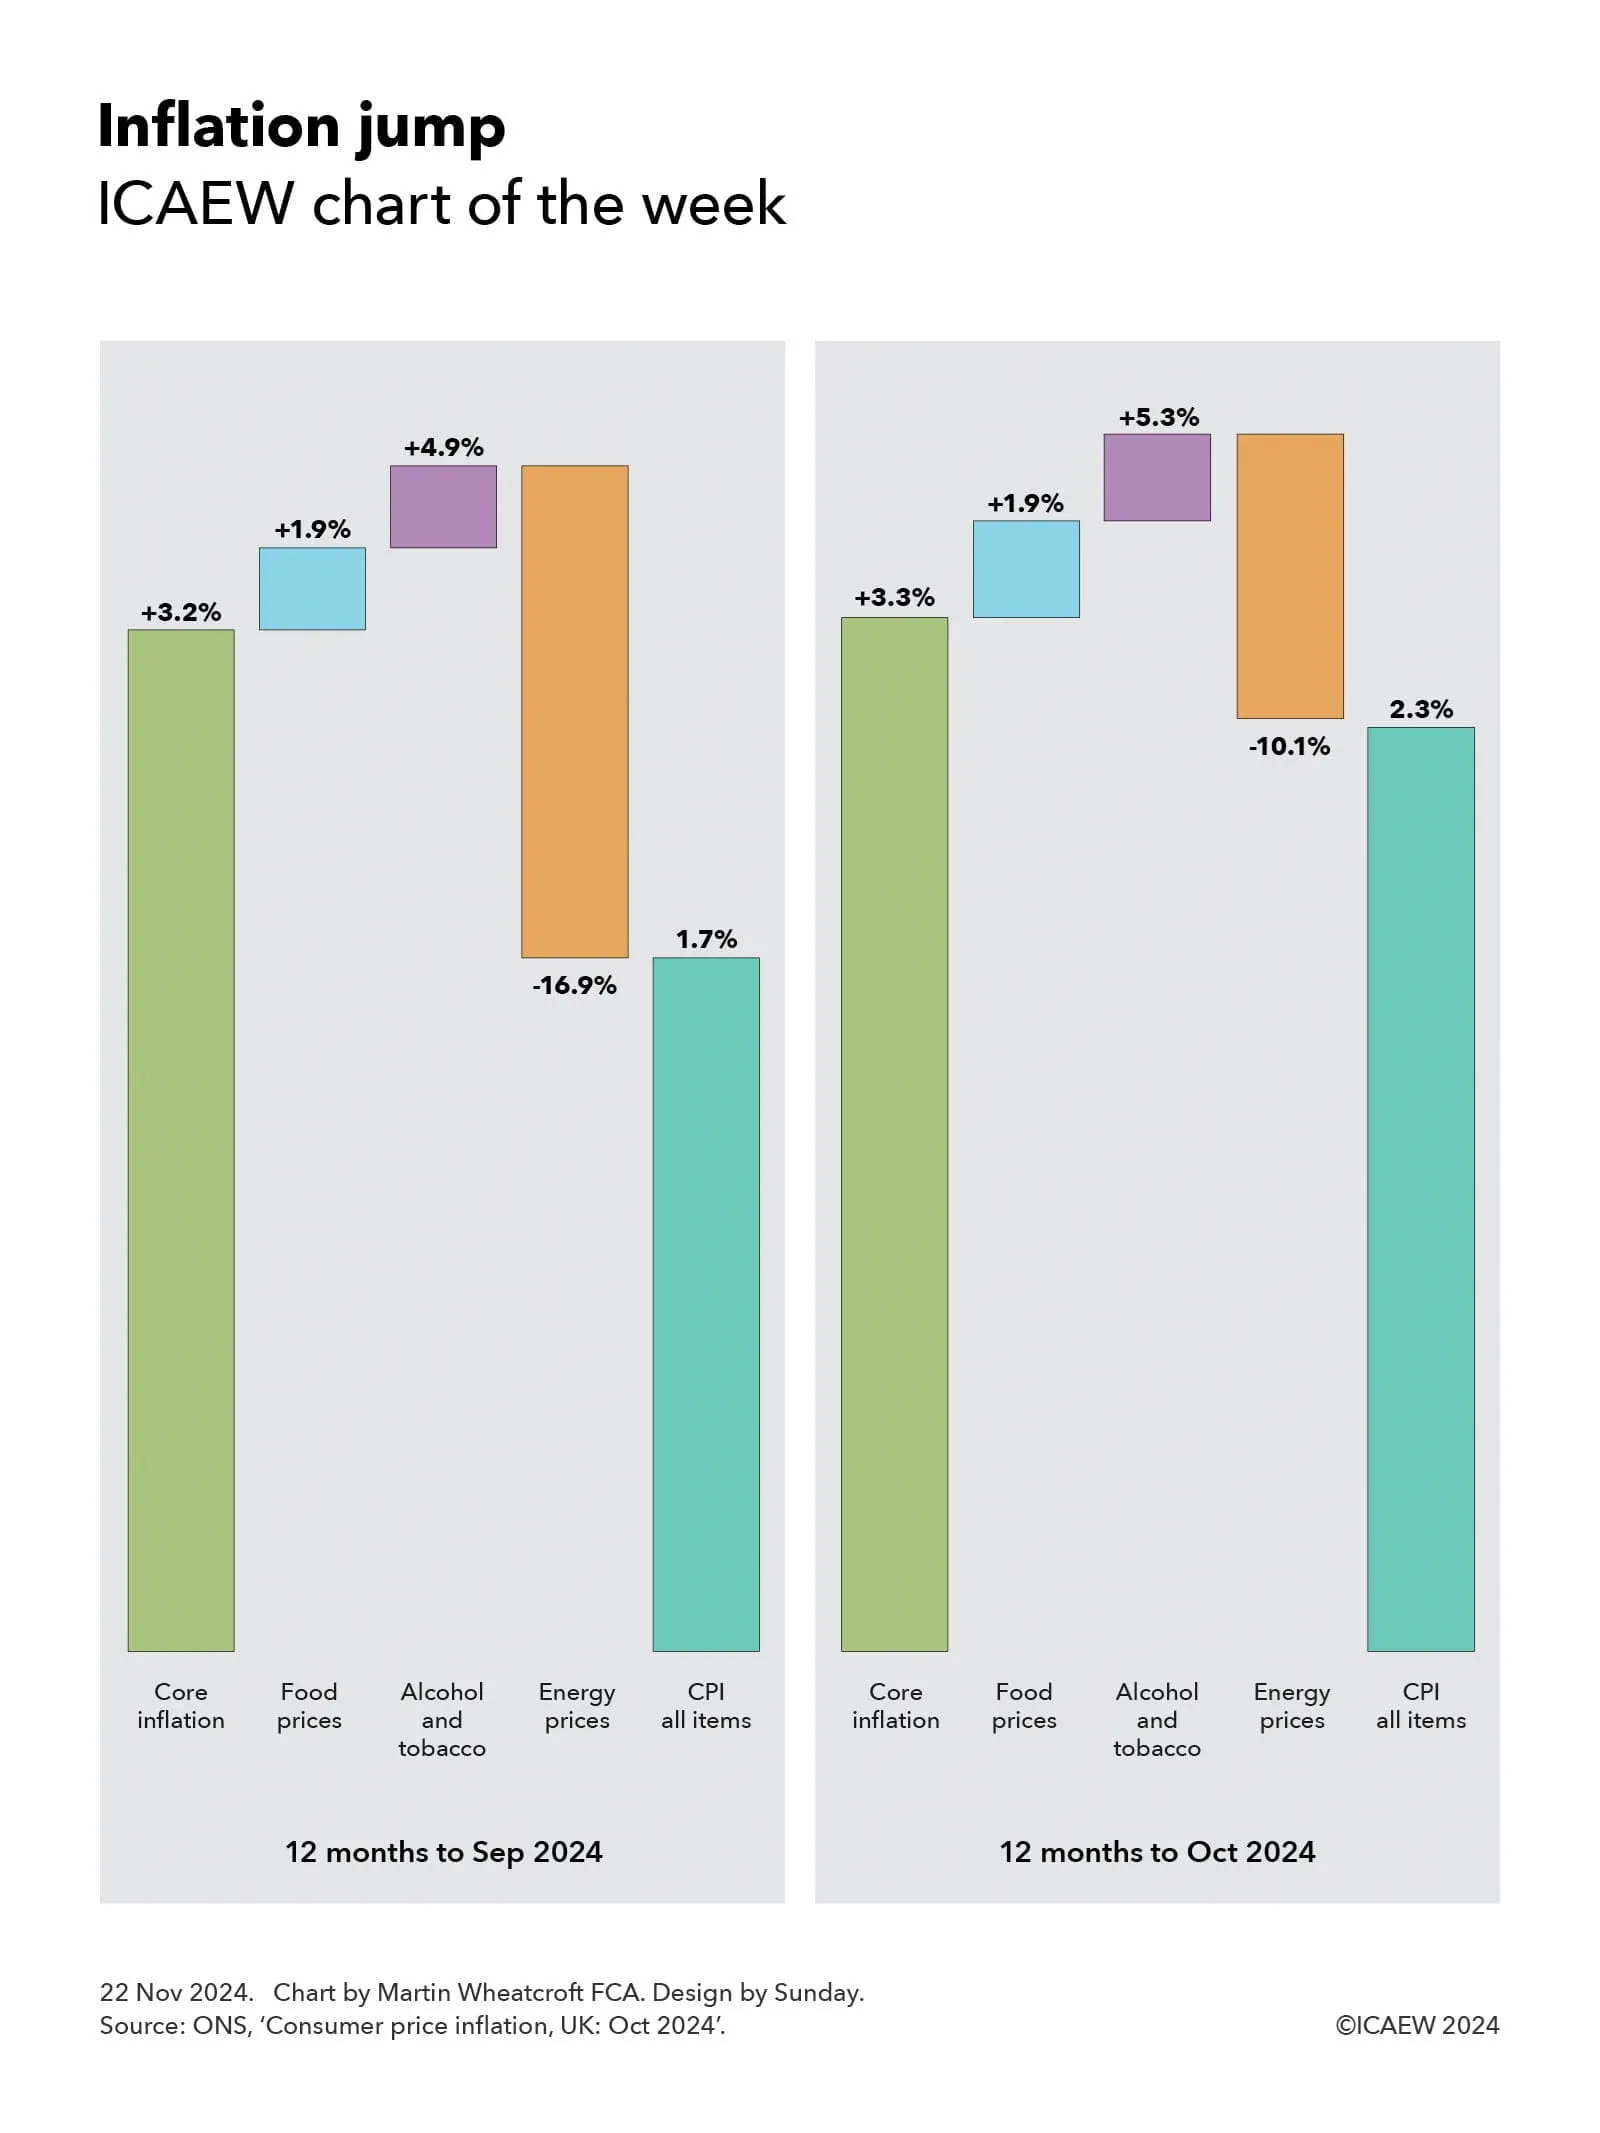
Our chart of the week illustrates how the annual rate of consumer price inflation (CPI) has changed between September and October 2024.
In the year to September 2024, core inflation – being CPI excluding the more volatile price rises of food, alcohol and tobacco, and energy – was 3.2%, while food prices were 1.9% higher than a year previously, alcohol and tobacco were 4.9% higher and energy prices were 16.9% lower. On a weighted basis these contributed 2.5%, 0.2%, 0.2% and -1.2% respectively to the overall CPI index.
This contrasts with the year to October 2024, where core inflation was 3.3%, food price inflation was 1.9%, alcohol and tobacco prices were up 5.3%, and energy prices were down 10.1%, contributing 2.6%, 0.2%, 0.2% and -0.7% to the annual rise in the CPI all items index.
In moving to the latest set of statistics, price changes during October 2023 are dropped from the annual rate and those for October 2024 are added. This results in a very different picture for energy prices, as a fall in domestic electricity and gas prices in October 2023 was replaced by an increase in the domestic energy price cap in October 2024. This caused energy prices overall to fall by a smaller amount in the year to October than they did in the year to September.
After weighting the different components of the CPI index, the 0.6 percentage point change in the annual rate of inflation reflected a 0.1 percentage point contribution from core inflation, close to zero from food inflation, 0.015 percentage points from higher alcohol and tobacco prices, and a 0.5 percentage point contribution resulting from a lower annual rate of fall in energy prices.
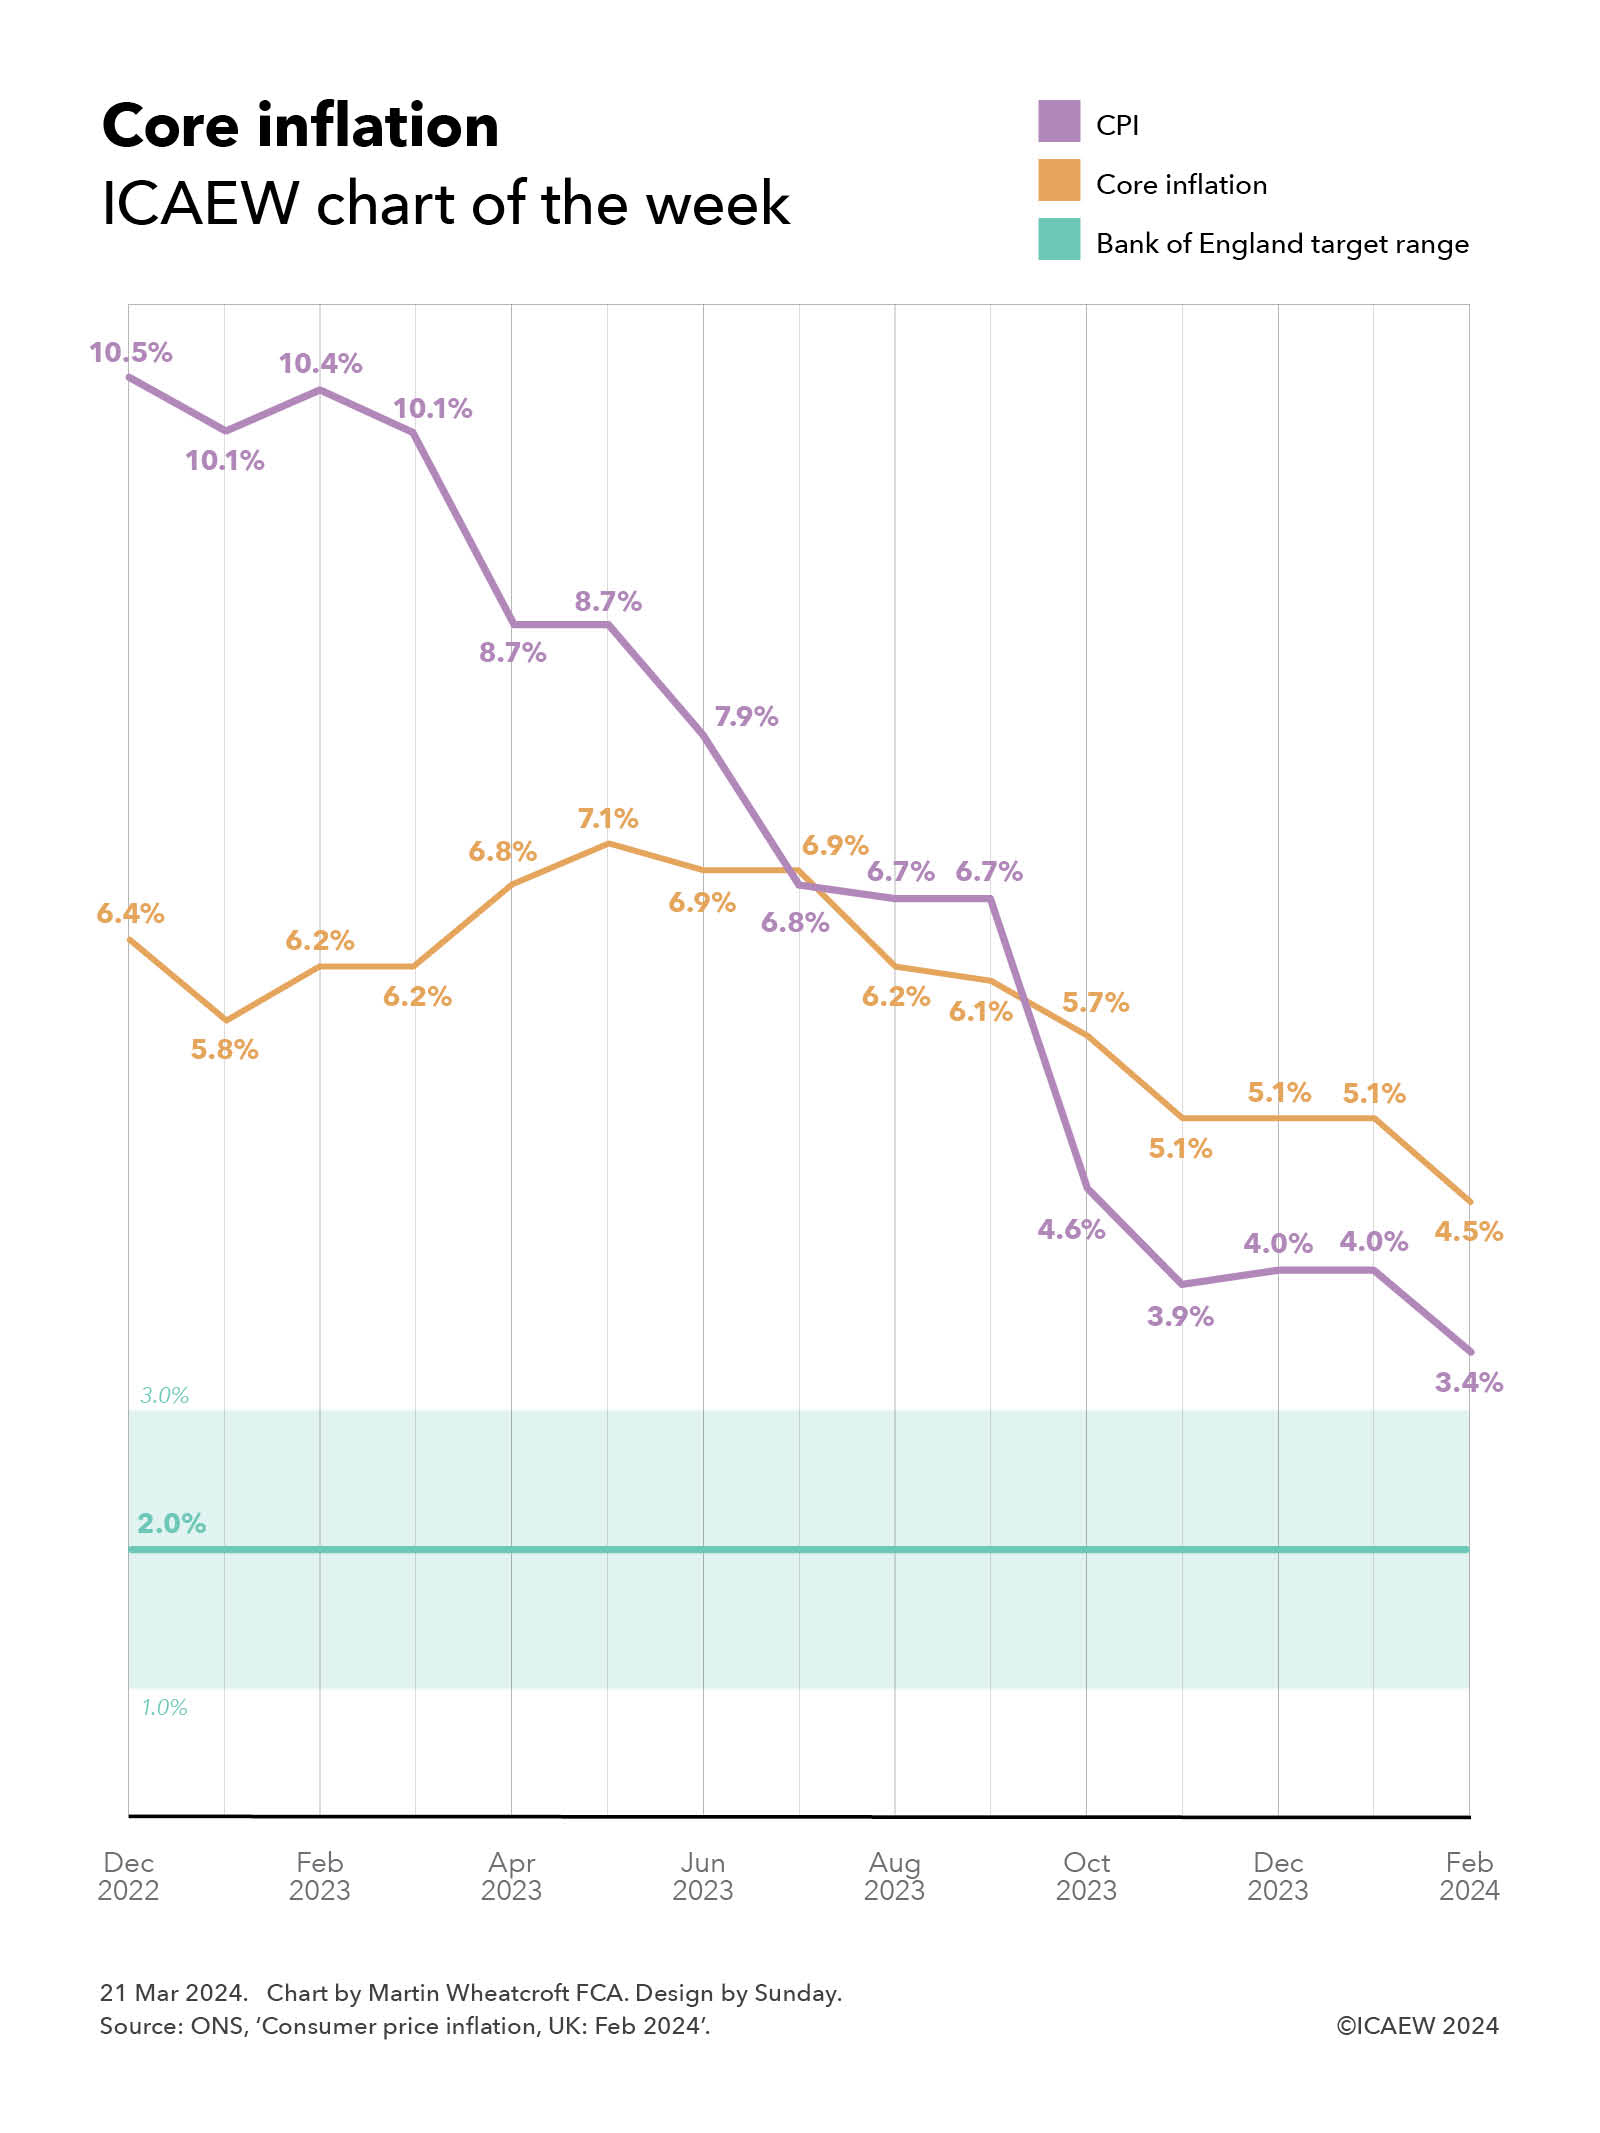
Despite the slight uptick in the annual core inflation rate in October 2024 to 3.3%, it is still significantly lower than the 5.7% rate it was in October 2023, providing some encouragement to the Bank of England to reduce interest rates still further during 2025.
However, the concern for monetary policymakers before they decide to cut rates again will be the potential upward pressures on inflation from measures in the Autumn Budget 2024. The course they chart will be affected by how these and other economic factors (both domestic and international) play out over the course of the next six months or so.