Ross Campbell, Director for Public Sector at ICAEW, writes:
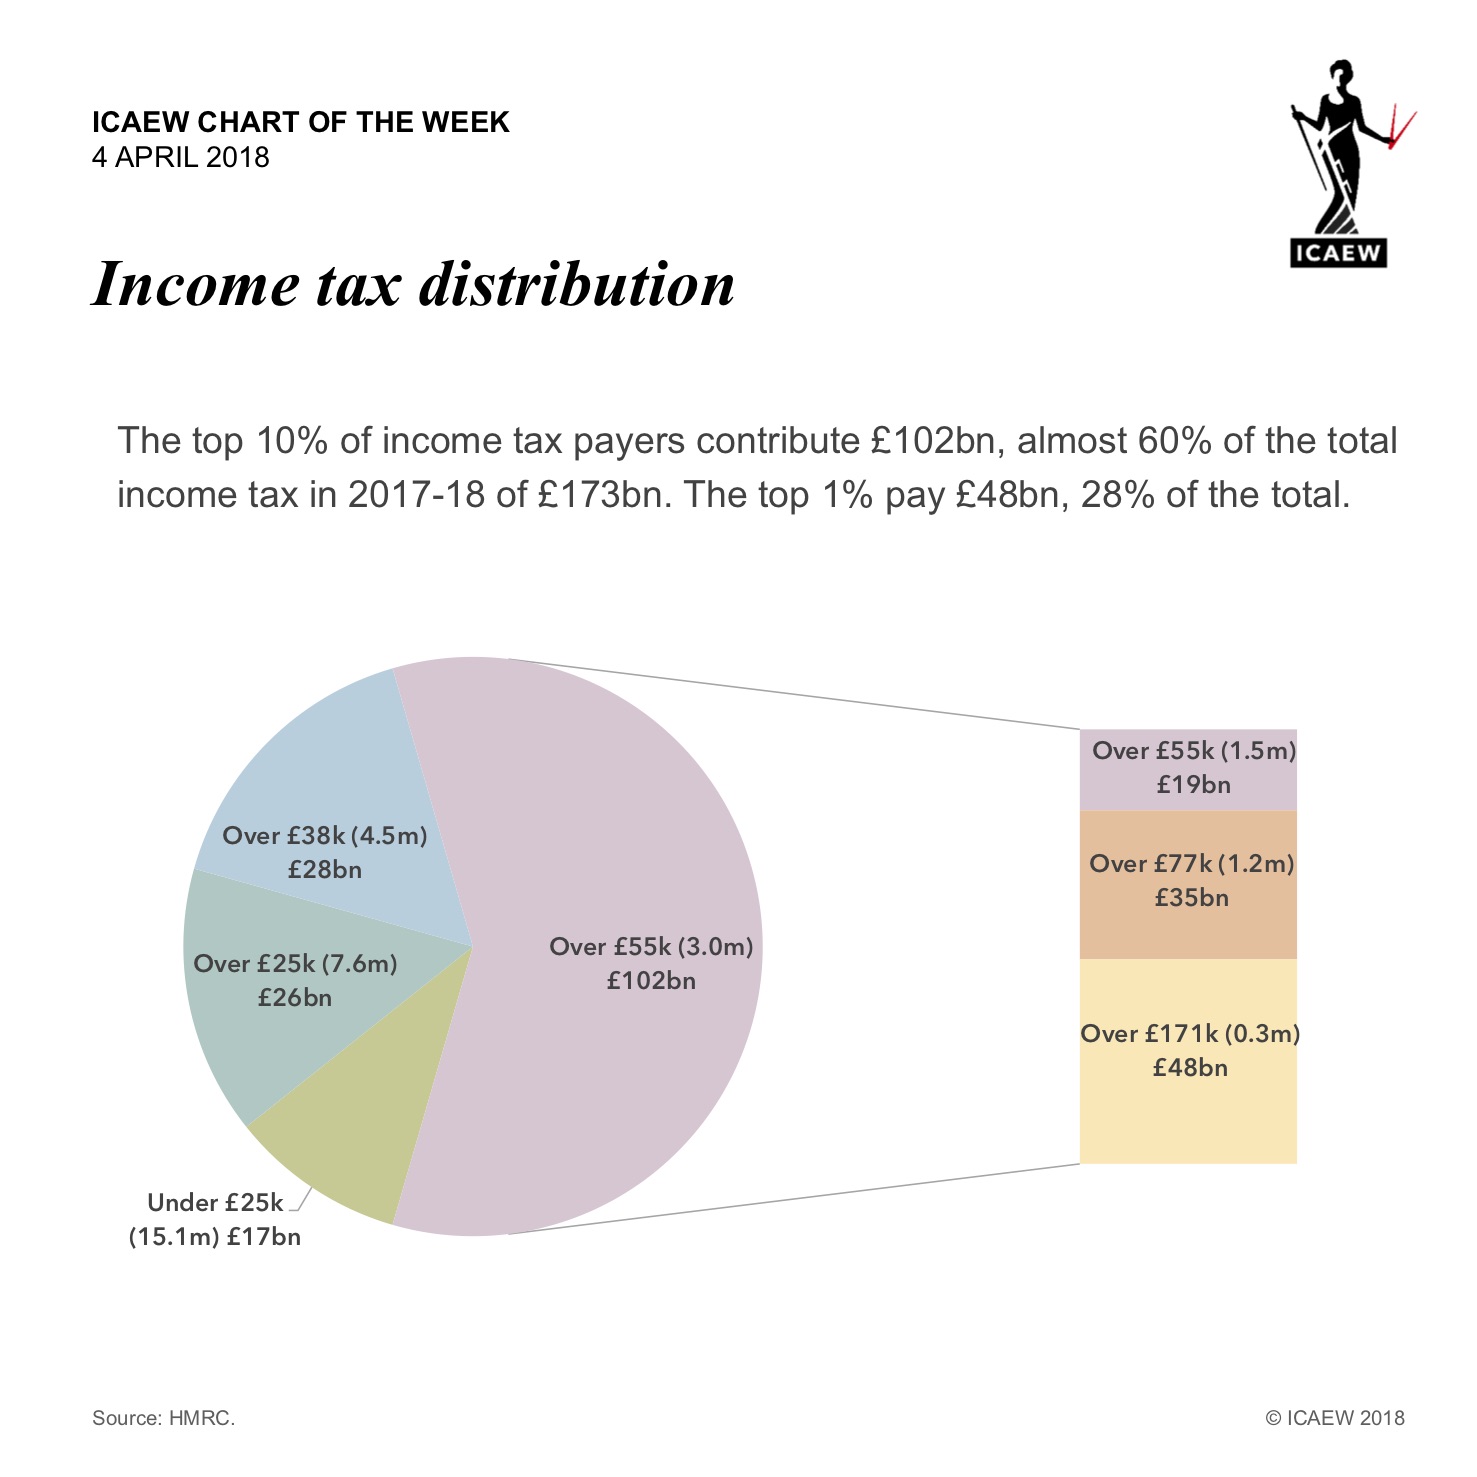
“Our chart this week looks where the government gets its money, or at least the element that comes in in the form of income tax, which is expected to generate around £173bn in 2017-18.
It is important to note that income tax constitutes only 24% of total government income, so this chart does not represent the full picture of how much is contributed by different groups.
The highest earning 10% (5% of the total population) contribute £102bn, almost 60% of total income tax, while the top 1% of earners pay £48bn (28%).
As a ‘progressive’ tax, the average tax rate paid by each group goes up with income, increasing from 10% for the bottom half of income tax payers (earning less than £25k).
In comparison other taxes such as national insurance, council tax and VAT are considered “regressive”, with poorer households paying a much greater proportion of their earnings on these taxes.
Interestingly, despite the impression given by a top marginal rate of 45%, the overall amount collected by income tax is just 16% of the total personal income of £1,050bn declared on tax returns and PAYE submissions.”
To comment on the ICAEW chart of the week, visit the ICAEW Talk Accountancy blog by clicking here.