The Office for National Statistics has updated its national population projections, lifting its expectations for 2025 by one million to just under 70 million people living in the UK and for 2050 by four million to 78 million.
My chart for ICAEW this week takes the latest principal population projections for the UK published by the Office for National Statistics (ONS) on 30 January 2024 and illustrates how the number of people in the UK has increased since 1975 and is projected to increase to 2075.
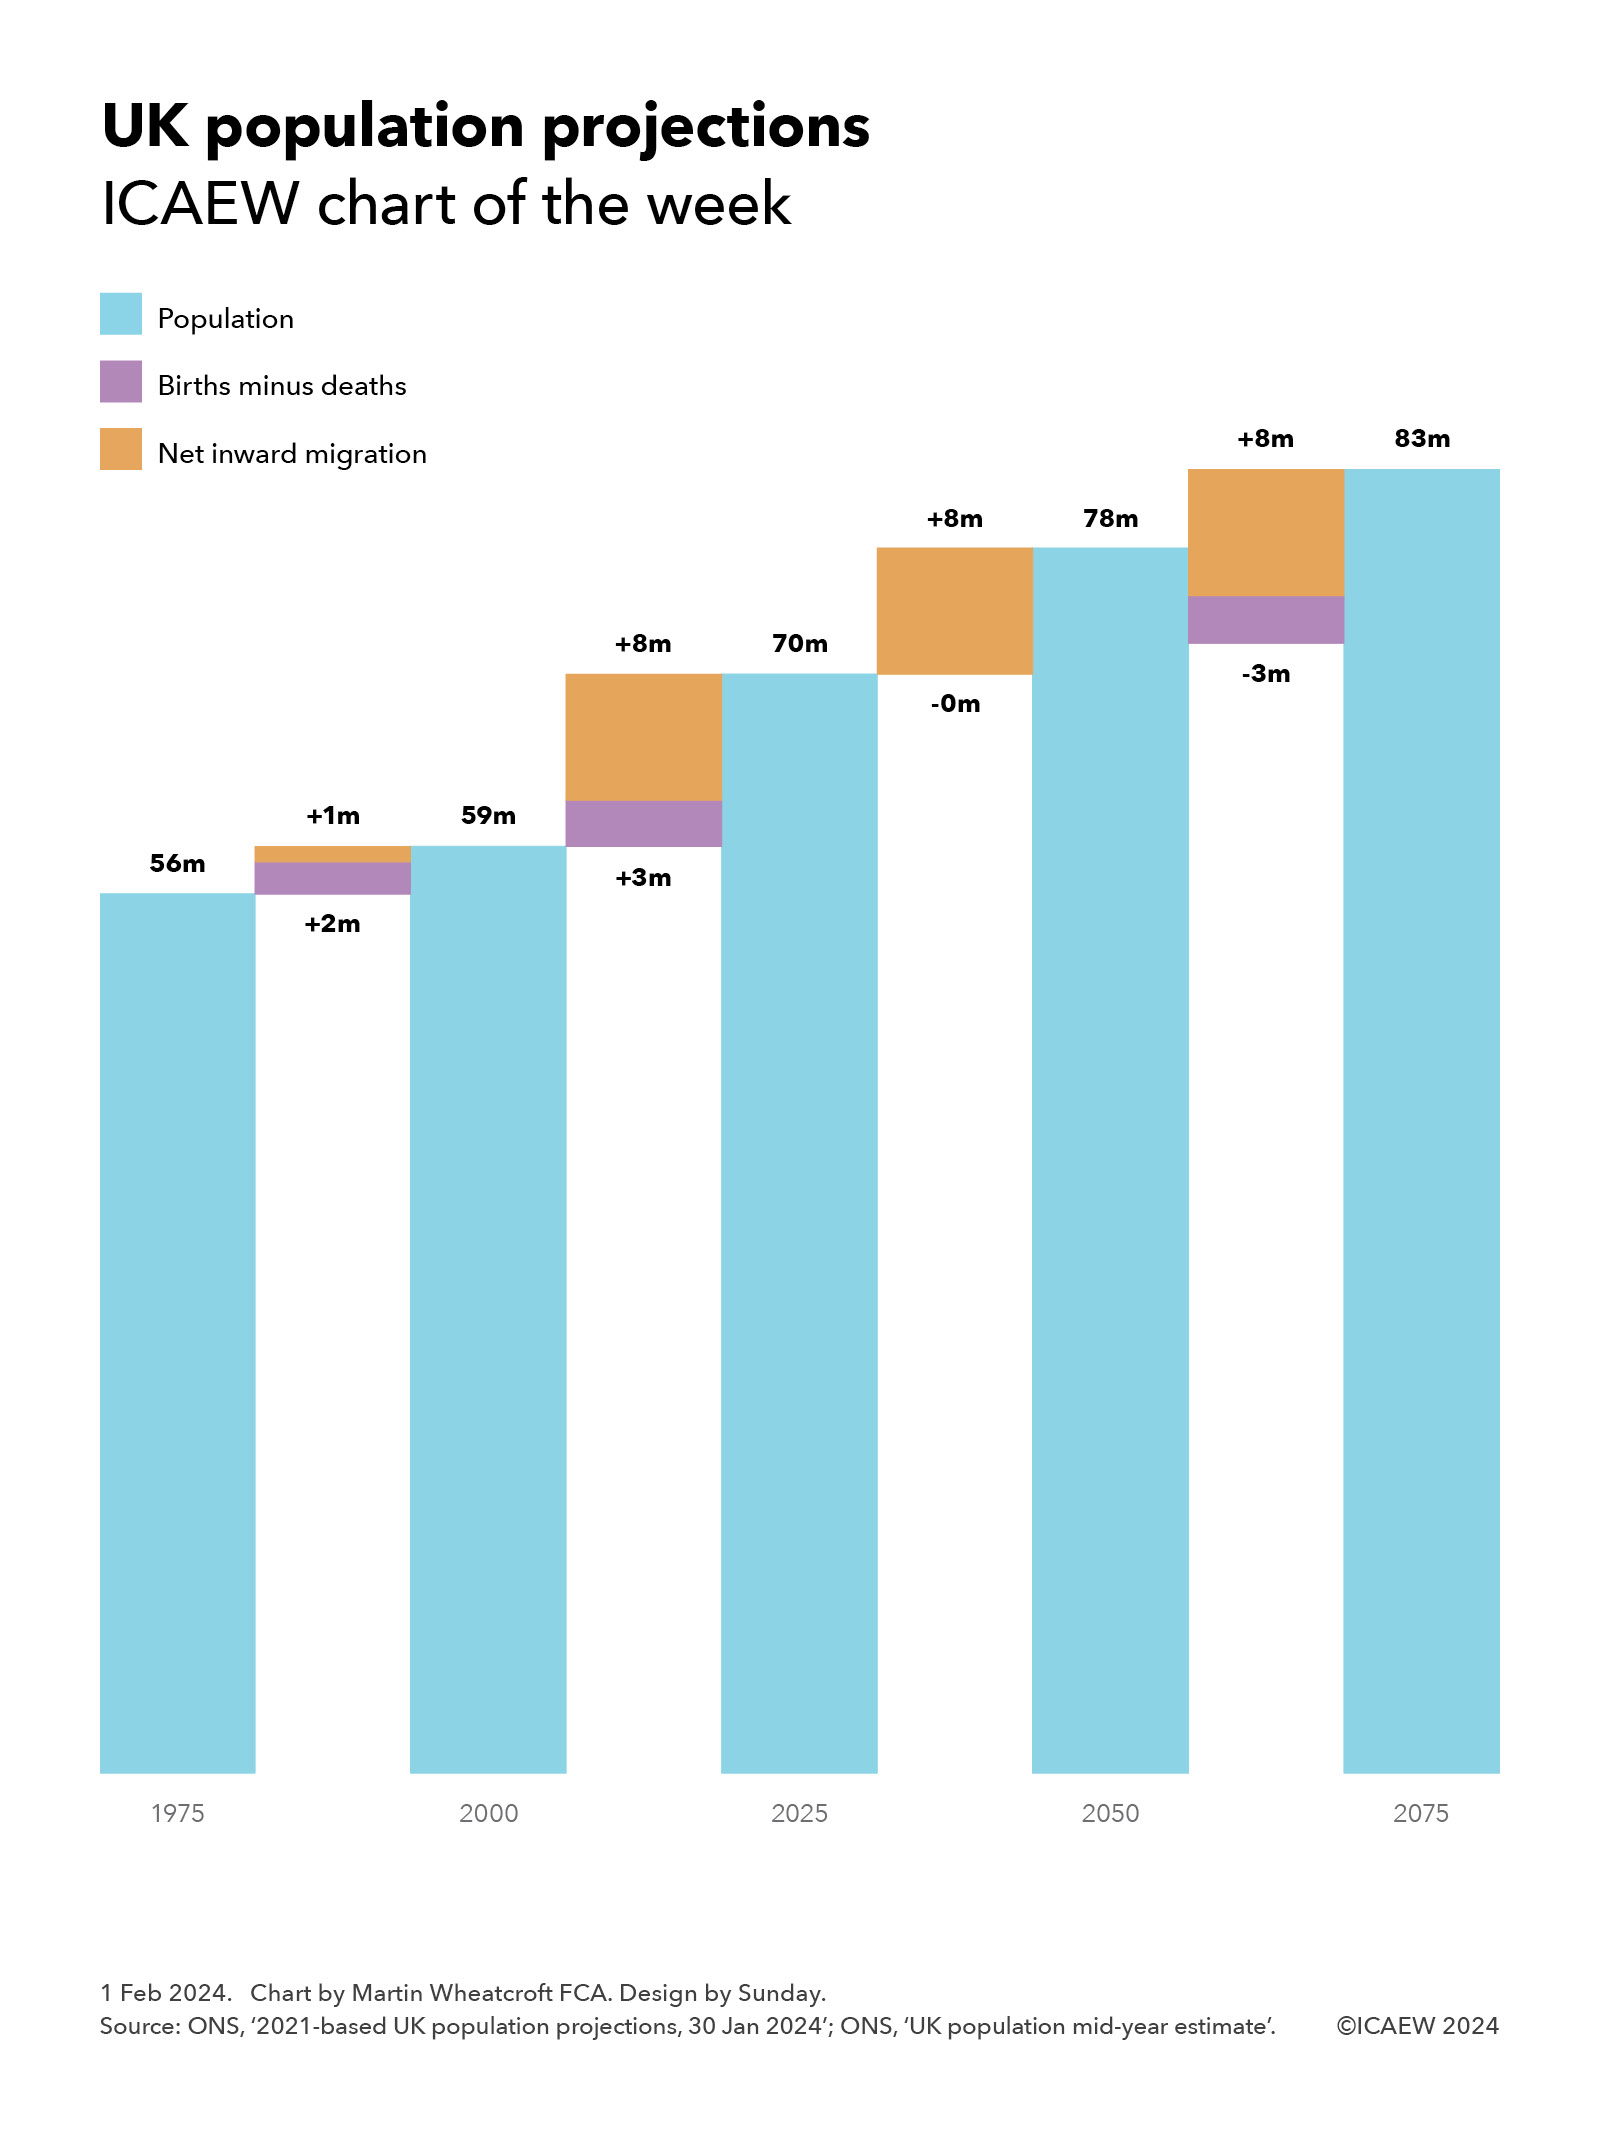
According to the ONS, there were 56m people living in the UK in June 1975 and our chart shows how this increased by 2m from births exceeding deaths (18m births – 16m deaths) and by 1m from net inward migration to reach 59m in June 2000, an average annual population growth rate of 0.2%.
The first quarter of the current century is expected to see the population increase to just under 70m by the middle of 2025, from a combination of 3m births less deaths (18m births – 15m deaths) and net inward migration of 8m, an average of just over 300,000 per year. This is equivalent to an average annual population growth rate of 0.7%.
From there, the population is projected to increase by approximately 8m to 78m in 2050, an average annual growth rate of 0.4%. This is driven by an assumption that immigration will continue to exceed emigration in the long-term by 315,000 a year, contributing 8m to the increase, while projected deaths are expected to marginally exceed births (18m deaths – 18m births) over the same period. The latter is also affected by the assumed level of immigration, with the ONS estimating that if net migration was zero then the population would fall by 3m over the 25 years to 2050 (18m deaths – 15m births).
The chart concludes with the projection for the following quarter-century from 2050 to 2075, with deaths exceeding births by 3m (21m deaths – 18m births) to partially offset an 8m projected increase from net inward migration to reach 83m in 2075, an average annual population growth of 0.3%.
These numbers are higher than the previous projection published by the ONS in January 2023 by 1m in 2025, 4m in 2050 and 8m in 2075, partly as a consequence of updating the baseline numbers to reflect the 2021 Census, but mainly because of higher assumptions for net inward migration. The ONS doubled the expected number of net inward migrants over the three years to June 2025 from approximately 300,000 per year to around 600,000 per year, and increased its long-term assumption from 245,000 net inward migrants per year to 315,000.
The challenge for policymakers is in balancing the needs of the economy and the public finances for more workers in order to pay for the pensions and health care costs of a rapidly growing number of pensioners, and fee-paying international students to subsidise the domestic university system, with political pressures to control immigration. Perhaps unsurprisingly this had led to a degree of unpredictability in immigration policy.
The challenge for the ONS is trying to reflect in its projections a highly unpredictable immigration policy, which in this case has resulted in it increasing its assumptions for net inward migration just as the government introduces a series of new restrictions that should significantly reduce the incoming flow of migrants.
The irony is that the ONS might have been better off just leaving its previous projections in place – but then that’s life in the forecasting game.