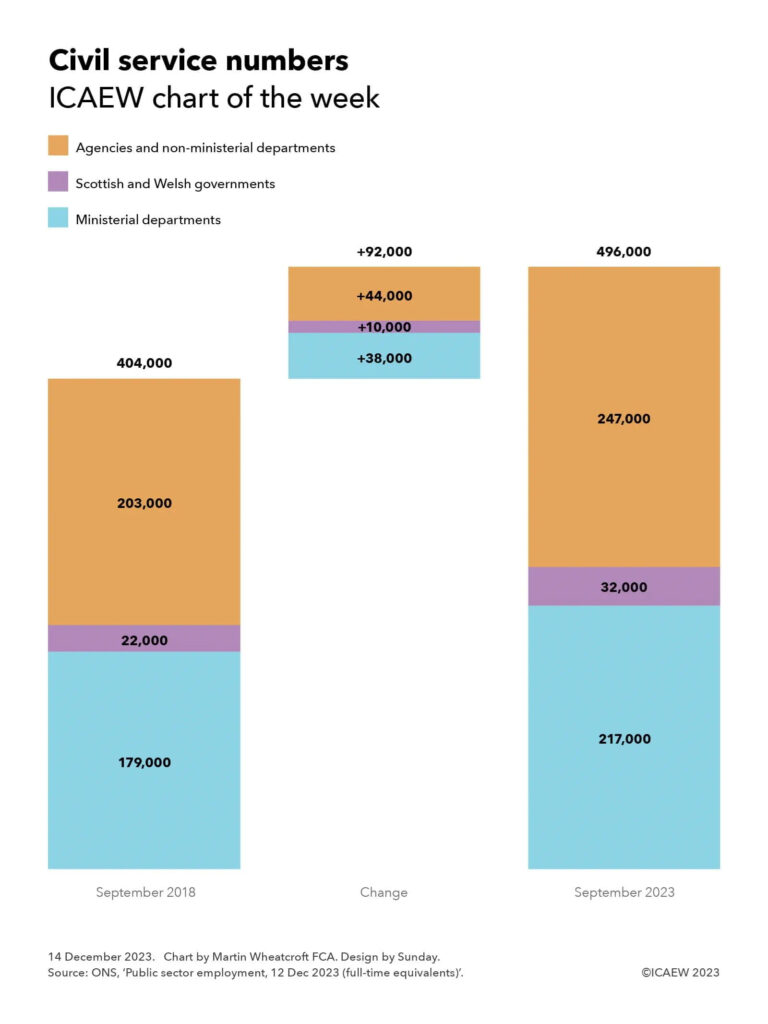
My chart for ICAEW this week illustrates how the civil service has grown by 92,000 or 23% to 496,000 FTEs over the past five years.

The number of civil servants has increased by 92,000 or 23% from 404,000 full-time equivalents (FTEs) in September 2018 to 496,000 FTEs in September 2023, which may be surprising in the light of government rhetoric about cutting public spending.
As my chart for ICAEW this week illustrates, the size of the UK civil service has grown significantly over the past five years. FTEs in ministerial departments have grown by 38,000 or 21% from 179,000 to 217,000, in the Scottish and Welsh governments by 10,000 or 45% from 22,000 to 32,000, and in agencies and non-ministerial departments by 44,000 or 22% from 203,000 to 247,000.
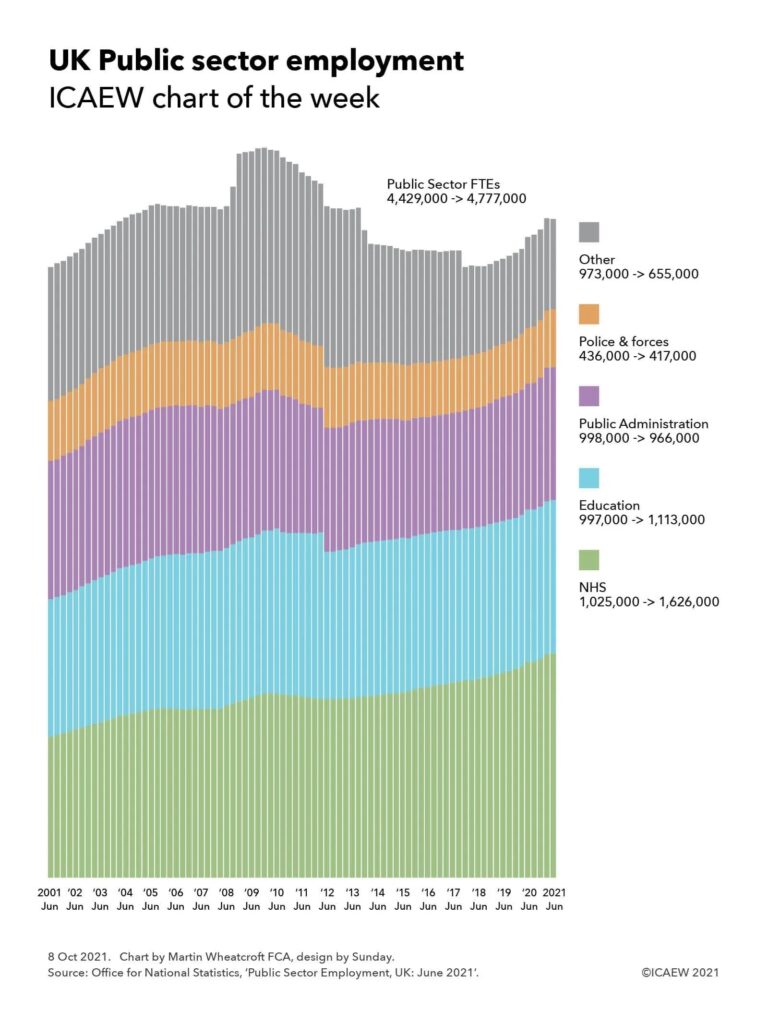
The civil service is just one part of the public sector workforce, which has increased by 571,000 or 13% from 4,433,000 to 5,004,000 FTEs over the same period. 300,000 of the increase has been in the NHS (up 21% from 1,451,000 to 1,751,000 FTEs in September 2023), which after taking account of the 92,000 increase in the civil service means the rest of the public sector workforce (schools, police, army, local government and others) has grown by a relatively slower number of 179,000 or 7% from 2,578,000 to 2,757,000 over the same period.
The increases in the civil service reverse cuts in the austerity years that saw the civil service fall from 493,000 FTEs in September 2009 to 384,000 in June 2016, just before the Brexit referendum.
The UK’s departure from the EU Single Market and the EU Customs Union on 31 December 2020 has been a major driver in the increase, most prominently in the Home Office, which has grown by 15,000 from 29,000 to 44,000 FTEs. Machinery of government changes make it difficult to track the other impacts, but it is likely that another 20,000 of the increase is likely driven by Brexit, made up of small changes across Whitehall departments and individual agencies, such as the 80% increase in the size of the Rural Payments Agency (from 1,400 to 2,600),
The individual agency with the largest increase is HM Prisons and Probation Service, up 15,000 from 49,000 to 64,000 as the outsourced probation was re-absorbed back into the civil service.
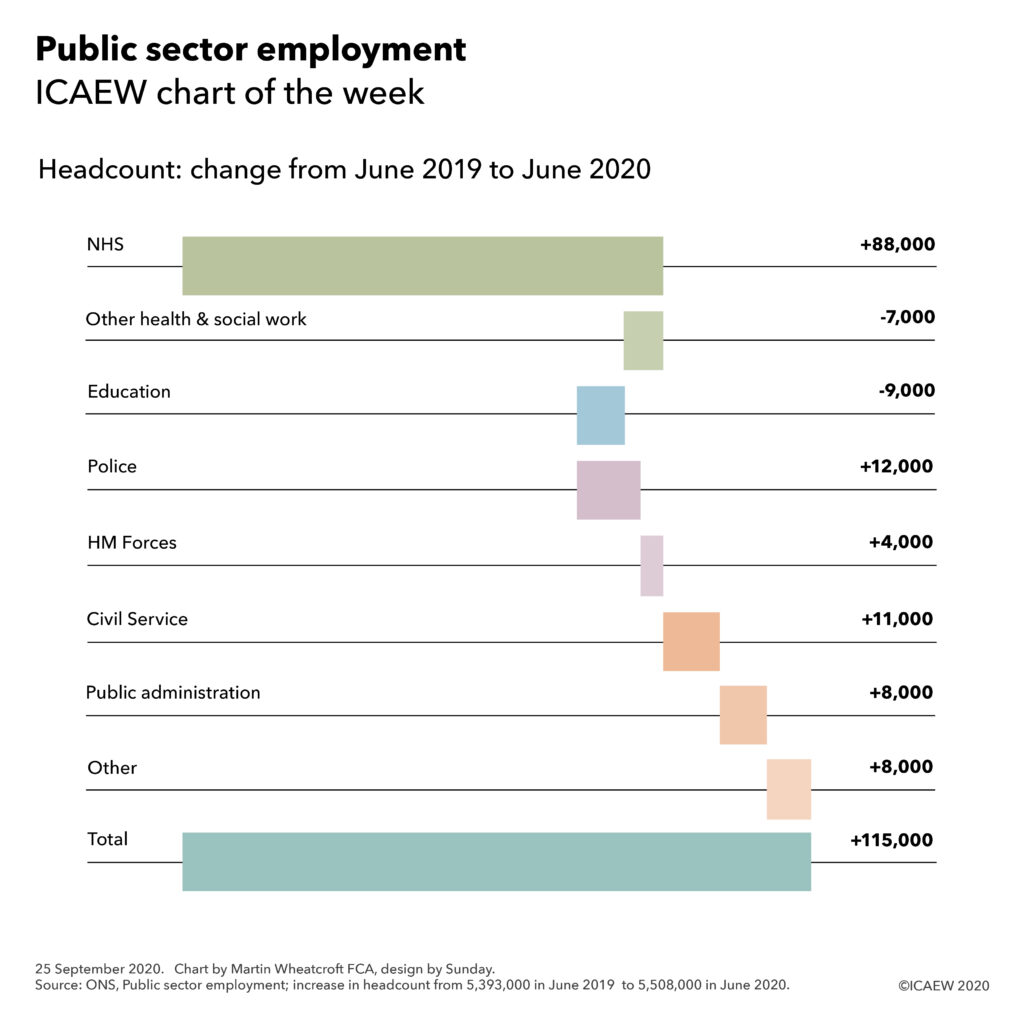
The pandemic also had a small impact on the civil service (as opposed to the NHS) with the Department of Health and Social Security more than doubling in size from just under 1,500 FTEs in September 2018 to almost 3,200 in September 2023.
Some increases are more difficult to attribute, such as the 30% increase in the size of the National Crime Agency from 4,200 to 5,500 or the 9% increase in the size of HM Revenue and Customs from 57,100 to 62,000. Brexit is likely to be part of the story following the reversion of responsibilities from Brussels to London, but the growth of cybercrime (for example) in the past few years will also have been a factor.
The civil service numbers reported by the Office for National Statistics exclude civil servants working for the Northern Ireland Executive and its agencies, but do include both the Scottish and Welsh governments. Most of the growth in numbers from 22,000 to 32,000 has been in Scotland as more powers have been devolved to its devolved administration, with the 16,800 FTEs in September 2018 growing by 9,700 or 58% to 26,500 in September 2023. The size of the civil service in Wales has gone up by a much more modest 700 or 13% from 5,200 to 5,900 in the same period.
One possible driver for some of the other increases is that cuts in the civil service made during the austerity years were never sustainable in the longer-term, with the demands that drove those numbers never having gone away. Another is that governments tend to want to “get things done” and there is therefore a need to find people to do them.
Both of these factors may explain why both government departments and agencies have grown in size over the past half a decade.
While the civil service is less than 10% of the public sector workforce, it is often the first place that the government looks when it wants to find cost savings – and the current government is no different in seeking to cut the size of the civil service again. Whether those costs savings are sustainable in the long-term without more fundamental reform is another matter.


