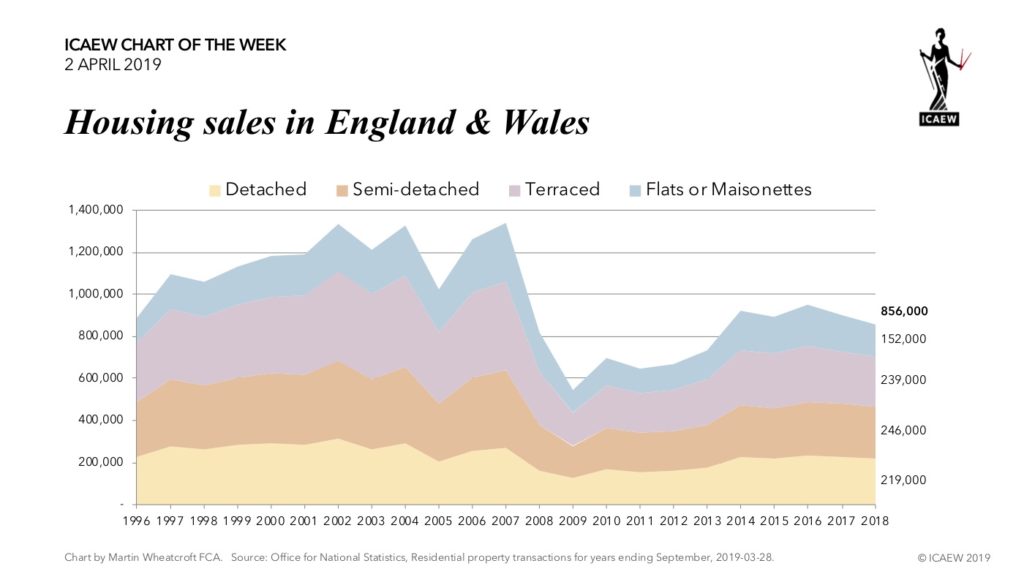
The ICAEW chart of the week this week is on the topic of the residential housing market, one of the swathe of economic statistics published by the Office for National Statistics last week.
While there is often great interest in what is happening to house prices, data on the number of transactions tends to get less publicity – despite perhaps being more important to the economy. After all, people moving home often generate a great deal of additional economic activity, such as redecorating and buying new furniture.
There were 856,000 housing sales in the year ended 30 September 2018, down from 948,000 in 2016 and 36% lower than the pre-crisis peak of 1,340,000 in 2007.
Much of the decline in the volume of transactions has been put down to the weak economic recovery, with low real family incomes making it difficult for many to buy, despite extremely low mortgage rates. Another culprit may be stamp duty, a friction in the housing market as it significantly increases the cost of moving home.
The total value of the transactions in 2018 was £253bn, meaning that the average price paid for house in England & Wales was £296,000.
The statisticians prefer to focus on the median value, which was £232,000 in 2018. The ONS uses this to calculate affordability, with the ratio to gross annual earnings at 7.83 in 2018, up from the 7.77 seen in 2017. Surprisingly this is higher than the 7.17 calculated for the peak in 2007, which in turn was significantly higher than the ratio of 4.13 back in 2000.
With politicians of all parties keen to increase housing supply, the hope is that more people will be able to get on the housing ladder and the volume of transactions will start to increase again. Whether that will actually happen remains to be seen.