ICAEW chart of the week: Inflation

My chart for ICAEW this week illustrates how core inflation has only dropped from 6.3% in December 2022 to 5.1% in December 2023, even as the headline rate has come down from 10.5% to 4.0%.

Two step charts under the title 'Inflation'.

Step chart 1: 2022
(12 months to Dec 2022)

Core inflation +6.3% (corresponding to 5.0% in height)
+ Food prices +16.8% (height 1.8%)
+ Alcohol & tobacco +3.7% (height 0.2%)
+ Energy prices +52.8% (height 3.5%)

= CPI all items +10.5% (height 10.5%)

Step chart 2: 2023
(12 months to Dec 2023)

Core inflation +5.51% (height 4.0%)
+ Food prices +8.0% (height 0.9%)
+ Alcohol & tobacco +12.9% (height 0.5%)
+ Energy prices -17.3% (height -1.4%)

= CPI all items +4.0% (height 4.0%)


18 Jan 2024.
Chart by Martin Wheatcroft FCA. Design by Sunday.
Source: ONS, 'Consumer price inflation, UK: Dec 2023'.

(c) ICAEW 2024

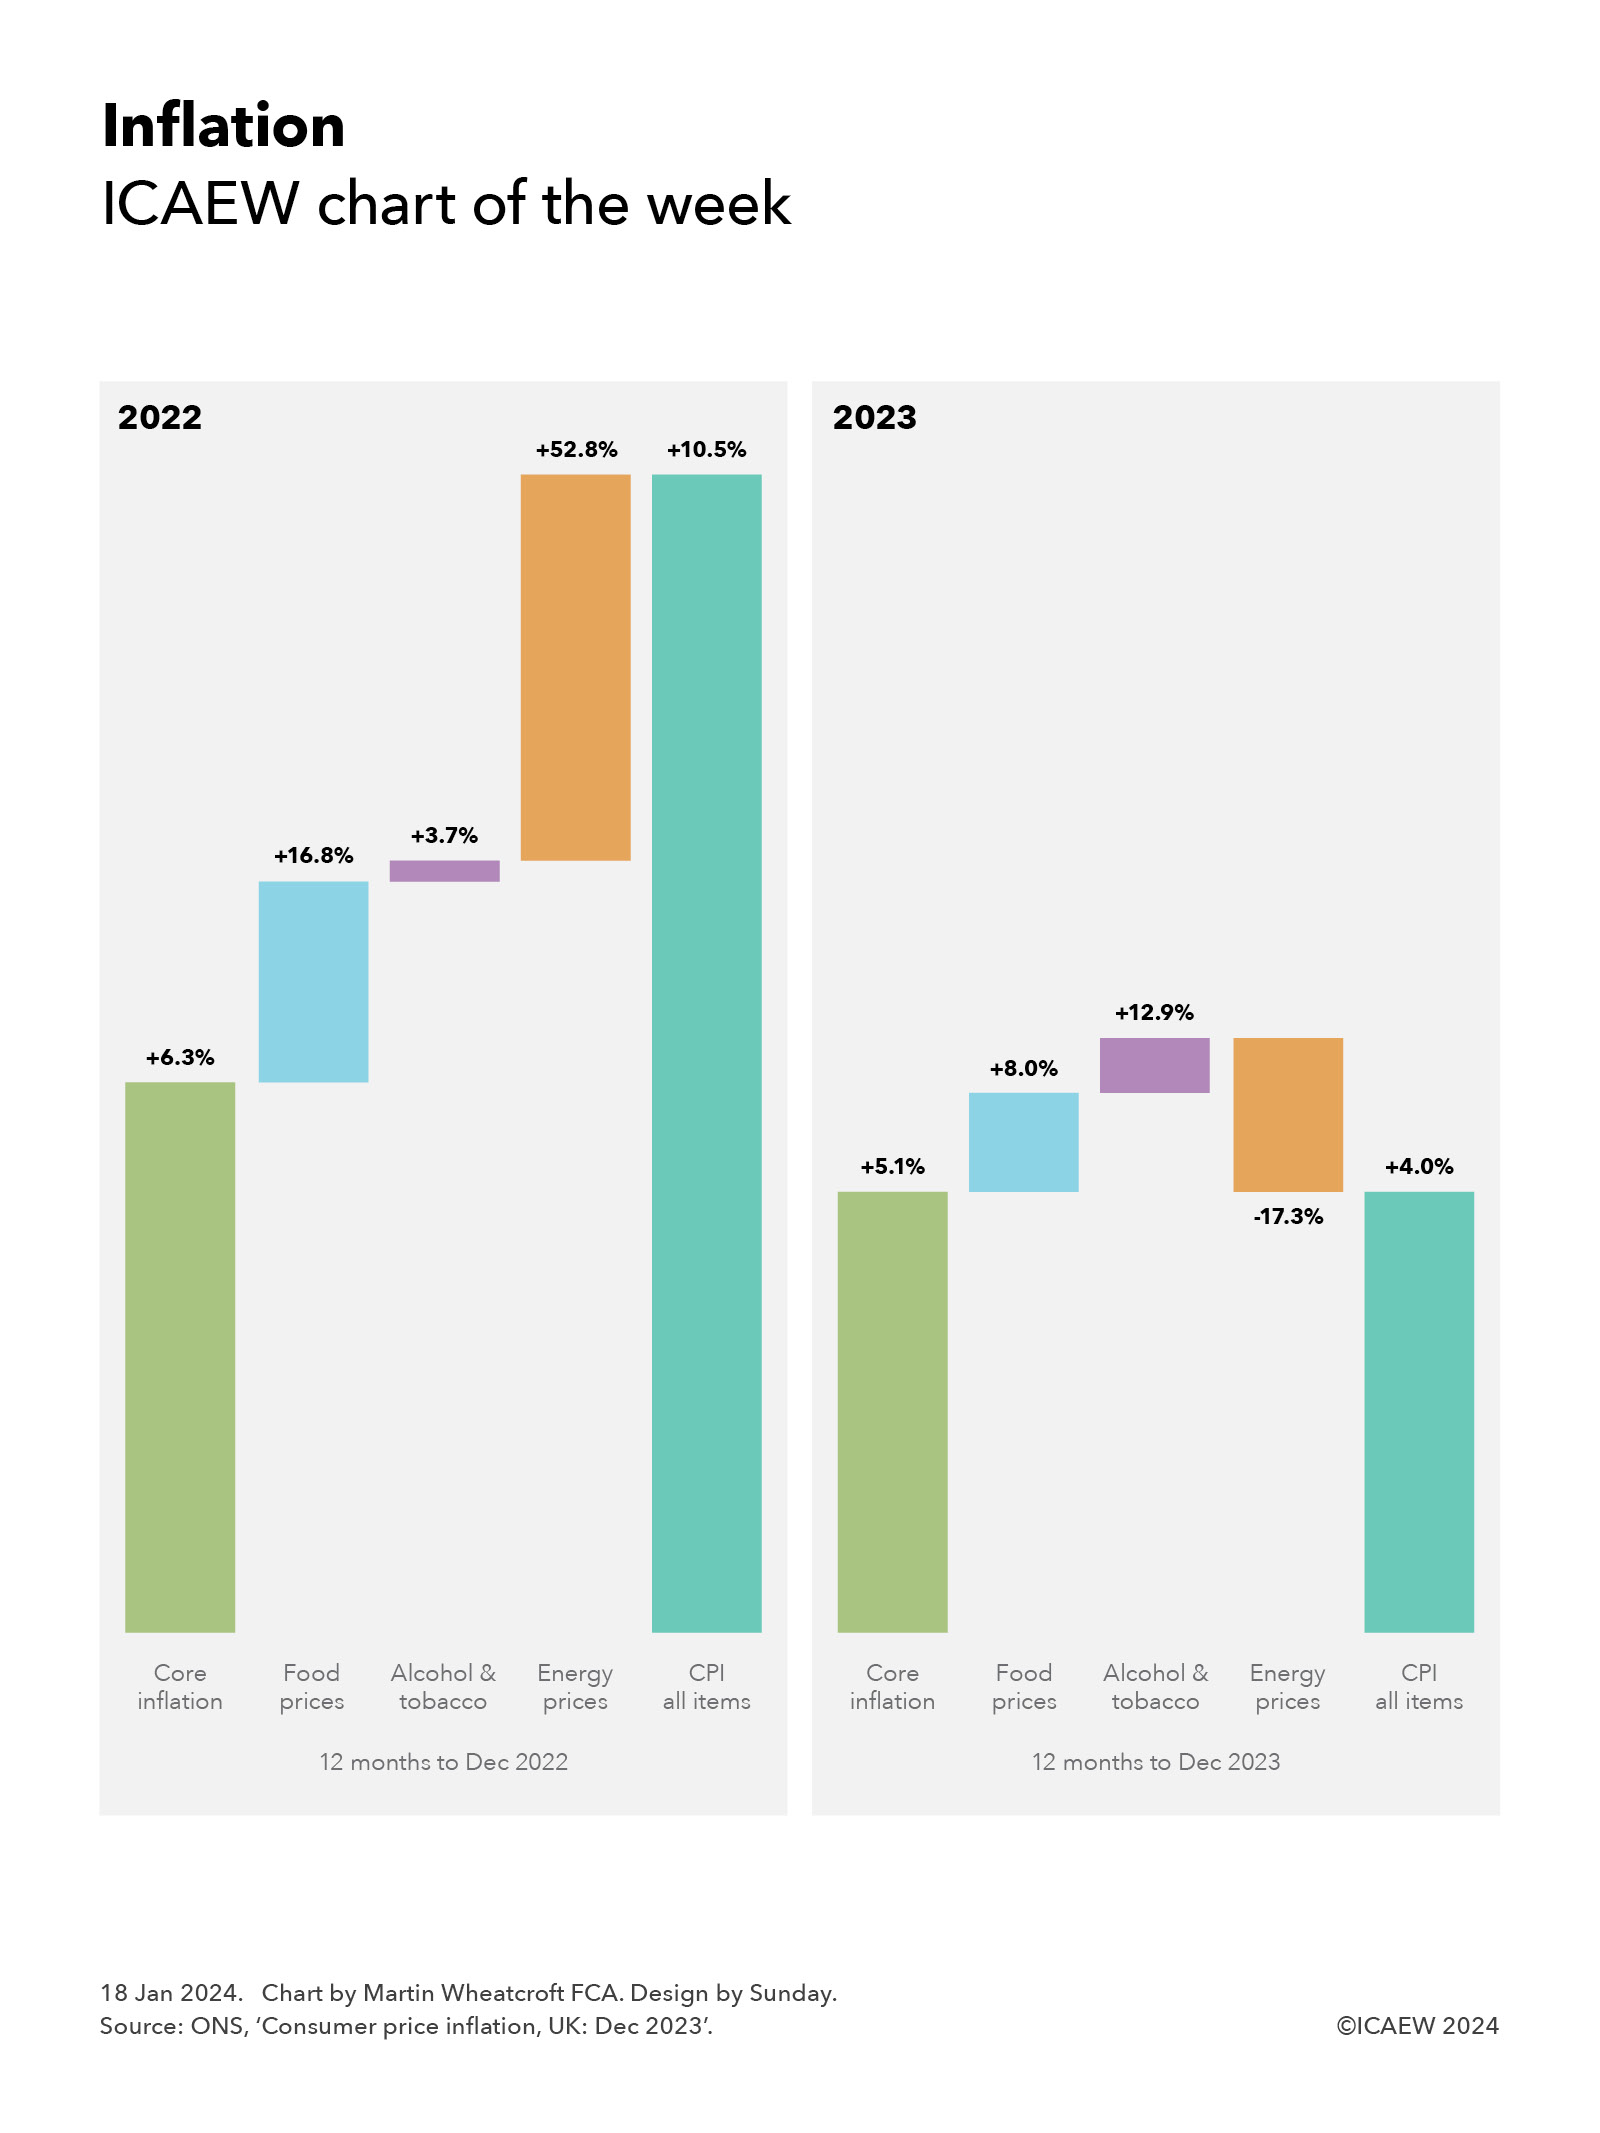
On 17 January 2023, the Office for National Statistics (ONS) published its latest consumer price inflation (CPI) statistics for the 12 months to December 2023, reporting that headline inflation has fallen to an annual rate of 4.0% compared with 10.5% a year earlier – a more than halving of the annual rate of price growth.

This contrasts with CPI excluding energy, food, alcohol and tobacco (typically described as core inflation), which was 6.3% and 5.1% in the 12 months to December 2022 and 2023 respectively.

The left-hand side of my chart this week illustrates how core inflation in the 12 months to December 2022 of 6.3% contributed just under 5.0% to the weighted average total inflation rate of 10.5%, with food prices up 16.8%, alcohol and tobacco up 3.7%, and energy prices up 52.8% contributing a further 1.8%, 0.2% and 3.5% respectively.

The right-hand side shows the 12 months to December 2023, where core inflation of 5.1%, food price inflation of 8.0%, alcohol and tobacco inflation of 12.9%, and a fall in energy prices of 17.3% contributed approximately 4.0%, 0.9%, 0.5% and -1.4% respectively to the weighted average total rate of consumer price inflation of 4.0%

The relative weightings may explain why many people feel that inflation is still running faster than the headline rate. Food prices, up 8.0% in the past 12 months, have increased twice as fast as CPI of 4.0%, while alcohol (up 9.6%) and tobacco (up 16.0%) have gone up by even more. These may have been offset by energy prices coming down by 17.3% over the past 12 months, but this may not be perceived as that beneficial given how energy is still significantly more expensive than it was before the cost-of-living crisis started.

For policymakers, the bigger concern will be the stickiness in core inflation, which remains stubbornly higher than the Bank of England’s target for overall CPI of 2.0%. While the expectation is that both core and headline rates will come down further during the course of 2024, the Bank is likely to remain cautious about declaring victory in the fight against inflation despite worries about the effects of high interest rates on the struggling economy.

This chart was originally published by ICAEW.

ICAEW chart of the week: Exploding debt

My chart for ICAEW this week takes a look at how UK public debt has exploded since the financial crisis to more than quintuple from £0.6trn in March 2008 to a projected £3.1trn in March 2029.

Exploding debt

Step chart showing how UK public sector net has changed between March 2008 and the projected position in March 2029.

[debt bars shaded orange, changes shaded in purple]

March 2008: £0.6trn
Financial crisis: +£0.7trn
March 2012: £1.3trn
Austerity years: +£0.5trn
March 2020: £1.8trn
Pandemic / energy crisis: +£0.9trn
March 2024: £2.7trn

[bar colours shaded by 50% to indicate the following are projected numbers]

Latest plan: +£0.4trn
March 2029:  £3.1trn

30 Nov 2023.
Chart by Martin Wheatcroft FCA. Design by Sunday.
Source: OBR, 'Public finances databank - Nov 2023'.

As illustrated by our chart this week, the sums borrowed by the government since the financial crisis of a decade and half ago have been truly astonishing. 

In March 2008, the official measure of net debt for the UK public sector was less than £0.6trn. During the financial crisis, government borrowing totalled £0.7trn over a four-year period, causing public sector net debt to more than double to £1.3bn in March 2012. 

The eight austerity years saw government cut spending on public services to a significant degree but still borrow a further £0.5trn to see net debt reach £1.8trn in March 2020 – arguably not mending the roof while the sun was shining. This was then followed by an exceptional amount of borrowing during four years of pandemic and energy crisis (including the current financial year) that is expected to see net debt increase by a total of £0.9trn to reach £2.7trn in March 2024.

The Autumn Statement 2023 on Wednesday 22 November saw the Chancellor set out his latest plan for the UK public finances over the next five financial years. This includes a further £0.4trn of borrowing, with public sector net debt projected to amount to £3.1trn in March 2029 – more than quintuple the net amount owed by the UK state 21 years earlier in March 2008.

This assumes that the government can stick to its borrowing plans – many commentators have suggested that planned cuts in spending on public services are unrealistic, meaning more borrowing if taxes are not to rise.

The £2.5trn increase in debt between 2008 and 2029 comprises £2.2trn in borrowing to fund 21 years of deficits (the annual shortfall between receipts and spending) and £0.3trn in other borrowing to fund government lending (such as student loans) and working capital requirements.

As a share of the economy, the increase is less dramatic but still significant – rising from a net debt to GDP ratio of 35.6% in March 2008, to 74.3% in March 2012, to 85.2% in March 2020, to an anticipated 97.9% in March 2024. However, the good news is that net debt / GDP is expected to fall to 94.1% in March 2029 as inflation and economic growth offset the additional borrowing.

The worry for this (or any alternative) government is that while borrowing levels in the OBR’s forecast spreadsheet for the next five years appear manageable and are (just) within the current fiscal rules, the numbers assume that we don’t enter another recession or other economic crisis in that time. Otherwise, we could see debt exploding again.

This chart was originally published by ICAEW.