Public spending is expected to approach £1.2trn this year, an extremely large and incomprehensible number to most of us. Our chart this week attempts to make that number more digestible.
Public spending in the current financial year is budgeted to amount to £1,189bn or just under £1.2trn. But what does such a large number really mean?
It can be difficult to comprehend the sheer scale of public spending that a major economy such as the UK incurs each year. The 2023/24 budget of £1,189,000,000,000 is just a huge amount of money to think about.
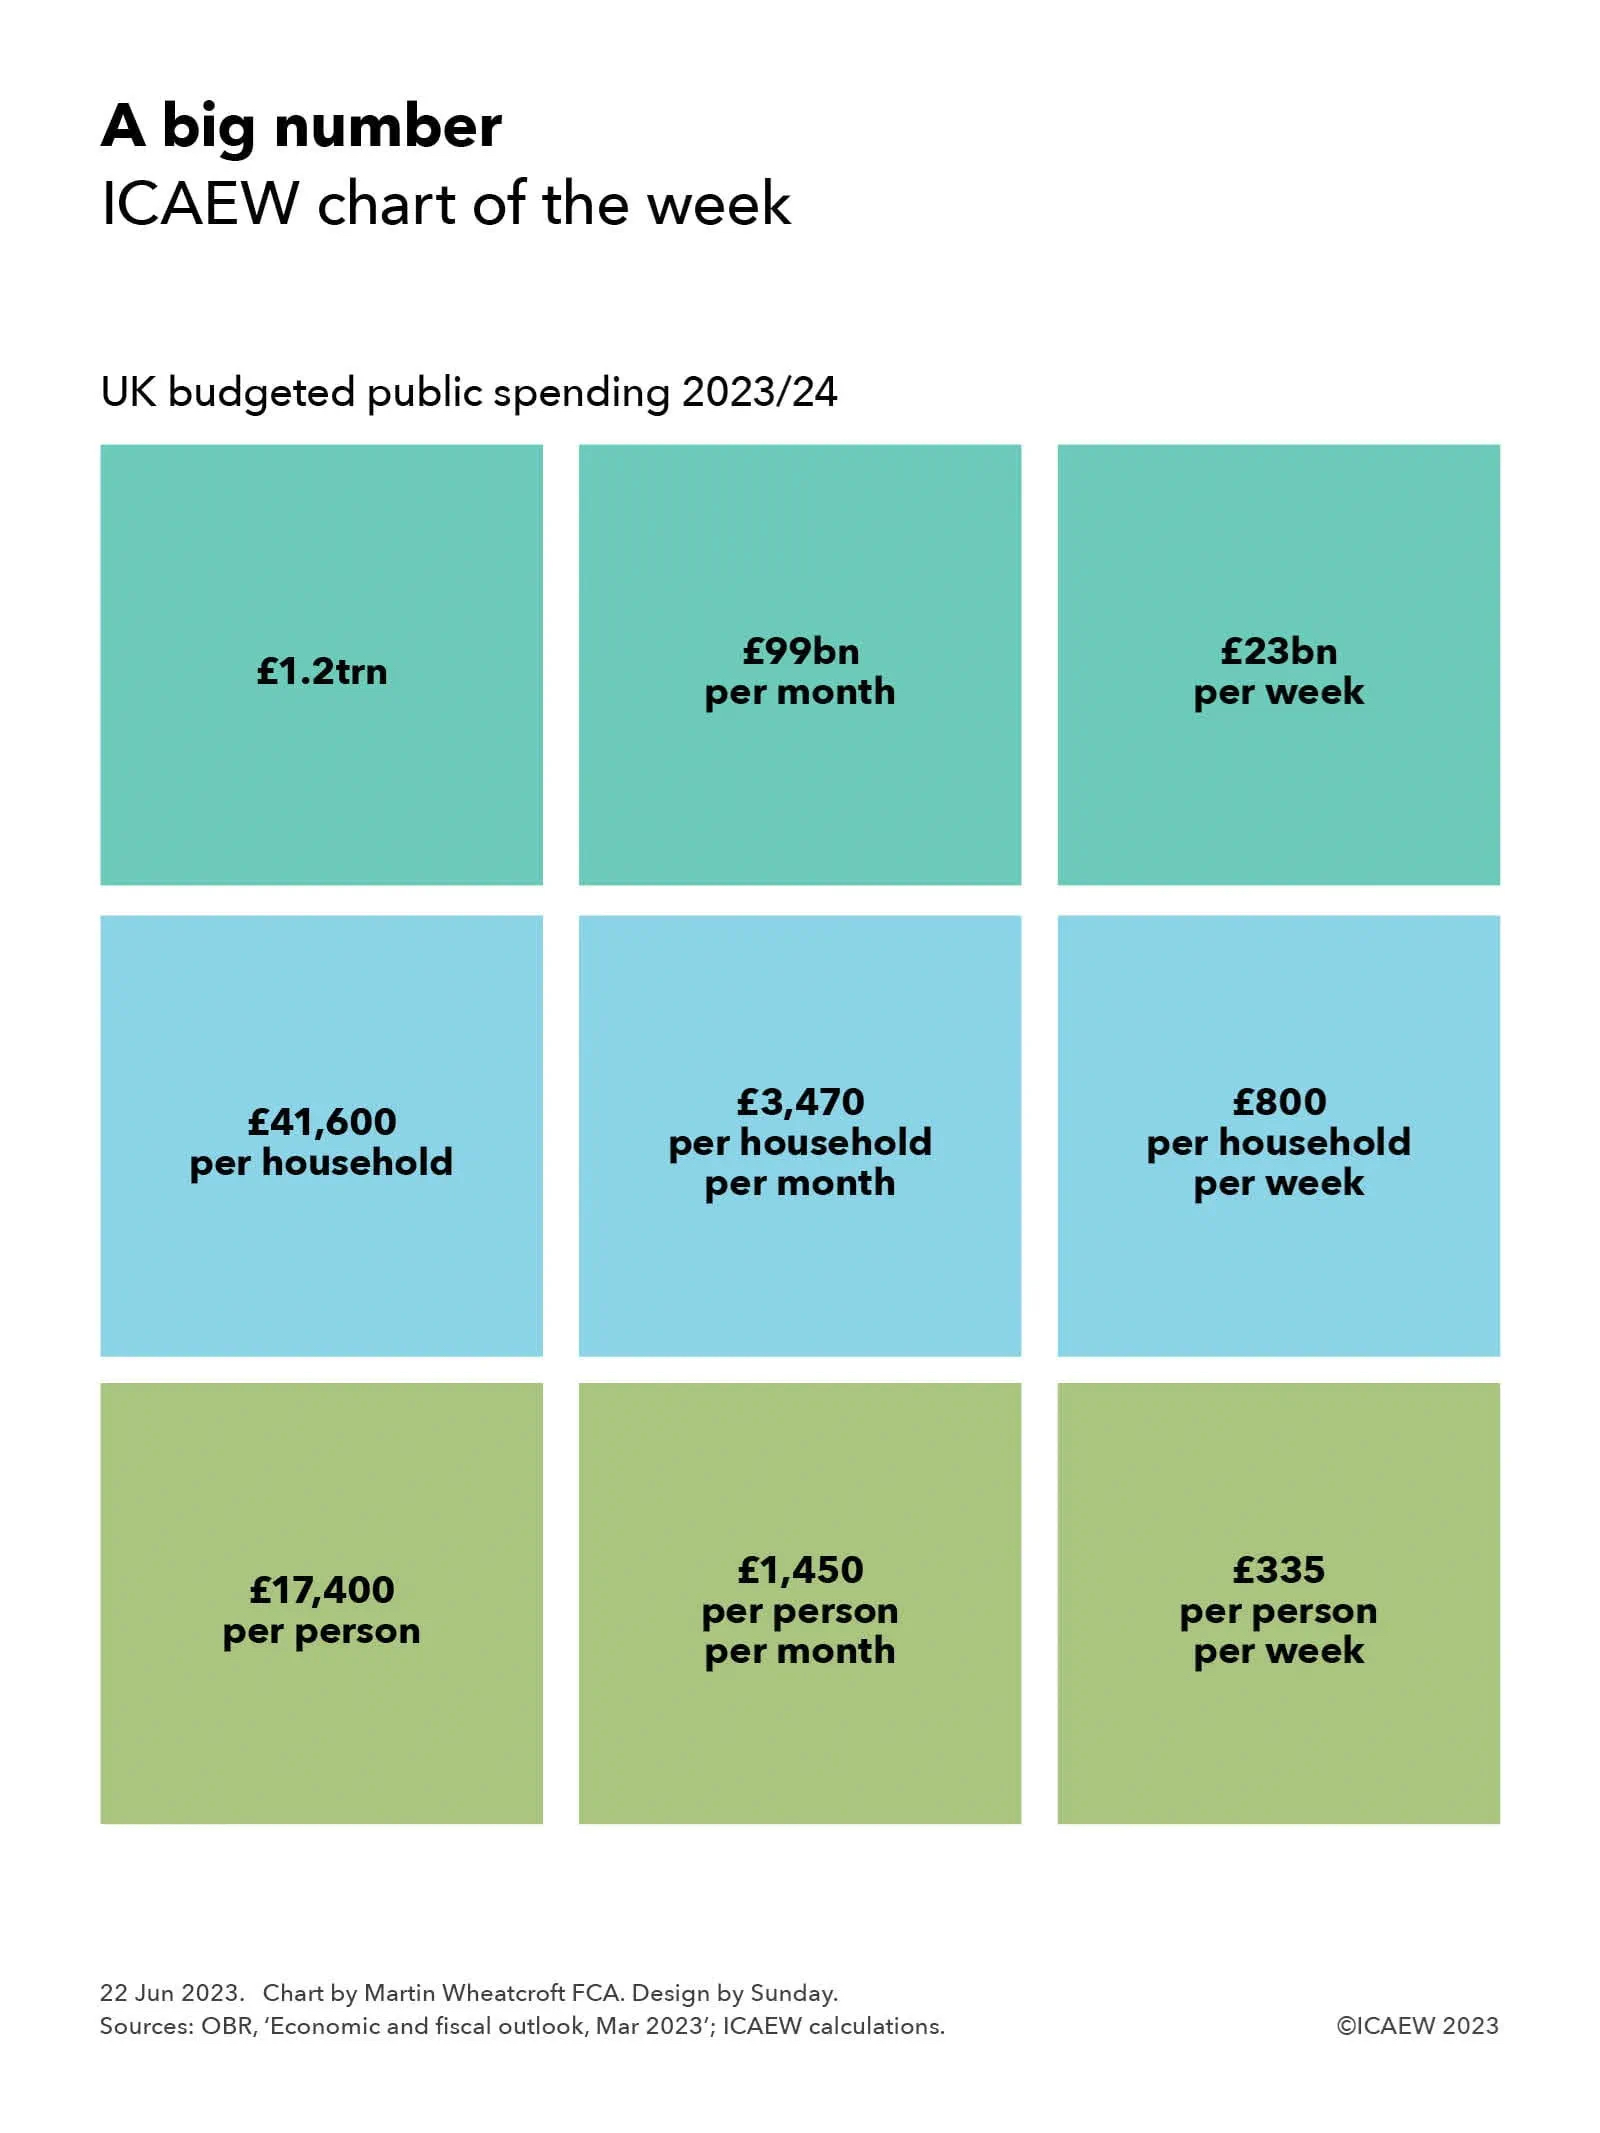
One way to understand the number is to break it down a little; knowing that the UK public spending is expected to be an average of £99bn a month or £23bn a week during the current financial year helps a little. However, smaller but still exceptionally large amounts can be equally difficult to understand.
The traditional way to look at the public finances, not shown in the chart, is to relate it to the size of the UK economy. GDP is projected to amount to £2,573,000,000,000 in 2023/24, meaning that public spending should be equal to around 46% of the overall economy. However, while this is helpful in putting public spending into context, it is still just a ratio between two incredibly large numbers that very few of us really comprehend. Surely there must be a better way of getting to grips with the public finances.
Our chart this week attempts to do so. By dividing the total for public spending by the number of households in the UK (expected to reach around 28.6m in September, the middle of the financial year) and by the size of the UK population (anticipated to be approximately 68.2m) as well as by month and by week, we can hopefully get a better a feeling for what is going on.
As our chart this week illustrates, average public spending in 2023/24 is equivalent to £41,600 per household, which breaks down to £3,470 per household per month or £800 per household per week, and it may be helpful to think about public spending. Whether you prefer to think in annual, monthly or weekly time periods, they are pretty big numbers in the context of most people’s household budgets.
Alternatively, you may find it easier to identify with how public spending in 2023/24 is equivalent to an average of £17,400 per person living in the UK, breaking down to £1,450 per person per month or £335 per person per week. Again, a very large number, particularly when you realise the average covers children as well as the adult population.
In some ways these much smaller versions of a big number – such as public spending of £3,470 per household per month – feel a lot larger when brought into a more relatable context. The figure of £1.2trn is baffling, but when you know the UK public sector plans to spend £800 per week for each of its 28.6m households, you get a better sense of just how much the UK state spends.
Of course, in working out averages it is important to be clear that they are just that – averages. Many people will benefit more, or less, from public spending than others, while conversely different groups will pay more or less in the taxes needed to fund that spending. Pensioners and children generally pay much less in taxes than those of working age, while benefiting from a much greater proportion of public spending. Similarly, poorer households will receive more in benefits and other forms of support, while richer households pay more in taxes.
Despite that, per household and per person averages give us an opportunity to compare public spending with reference points we can relate to, such as our own salary or household budget.
One of the reasons the numbers are so high, whichever way you look at them, is that the state does an awful lot. Average spending planned of £1,450 per person per month can be broken down further to approximately £420 on pensions and welfare, £350 on health and social care, £160 on education, £140 on defence, security, policing and justice, £140 on debt interest, £75 on transport, and £165 per person per month on everything else. Each of these in turn are made up of hundreds if not thousands of different central and local government programmes, many costing mere fractions of a penny per person per month, but that together add up to a lot of money.
No matter how you break it down, public spending will always be a huge number.