An inflation rate of 10.1% in the year to March 2023 conceals a huge variation in individual price rises, as illustrated by this week’s chart on food prices.
One of the problems in measuring inflation is that a weighted average of thousands of different prices is very different from our individual experience of inflation. Not only are we unique in terms of the basket of goods and services that we buy, but we also tend to notice some price changes more than others – making our personal experience very different from everyone else’s.
Nowhere is this more pronounced than in our regular trips to the shops to buy groceries, where we can see higher prices both on the shelves and when we come to pay at the till. This can be much more visible to us than bills paid by direct debit, for example, where money just disappears from our bank account and we need to make an effort to work out what is going on.
The Office for National Statistics has recently launched a shopping prices comparison tool that allows you to choose a basket of goods and see how retail prices have increased across different types of purchases: food and drink, clothing and footwear, restaurants and bars, health, household items, recreation and culture, services, and transport. Even there, the prices they quote are averages from many different retail outlets, specific products, and brands – and so won’t exactly match what is happening to your individual basket.
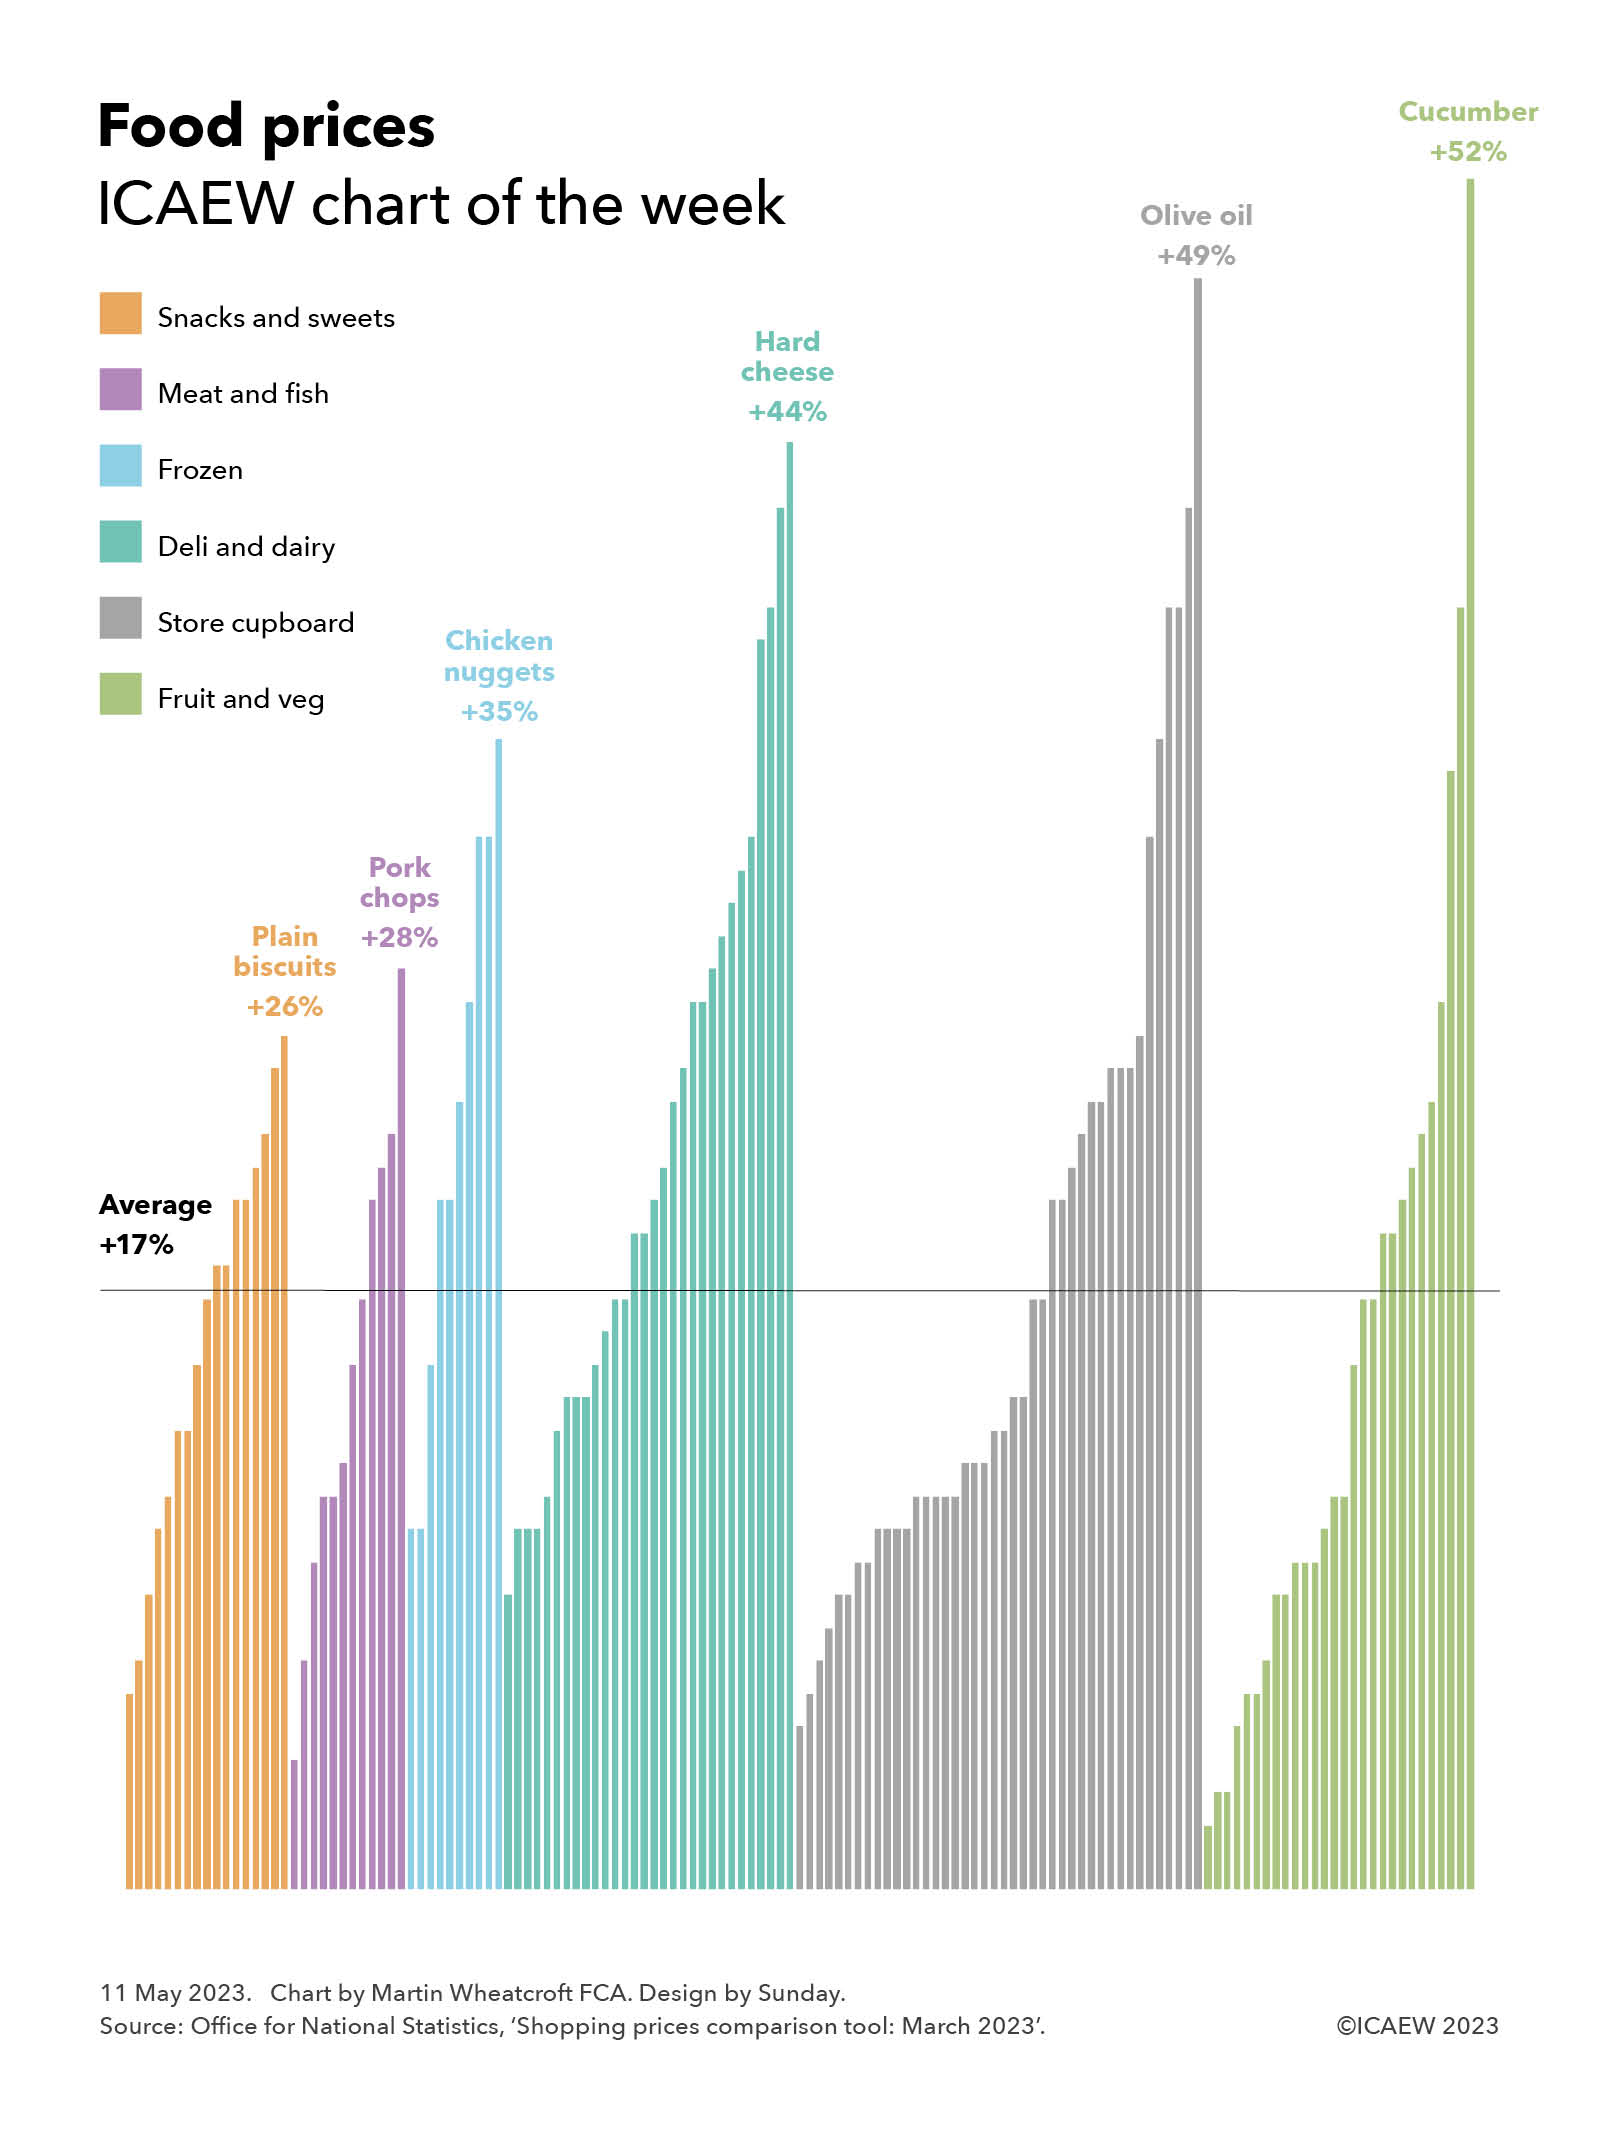
For our chart this week, we have chosen to look at food prices, choosing a basket that in total has increased by 17% over the past year, rising from £422.40 if you had bought everything on the list in March 2022 to £495.43 in March 2023. We have allocated these into six different categories to give a bit more flavour (pun intended) to what is going on.
There is a huge amount of variation between different foodstuffs, with our chart illustrating how in the snacks and sweets category the average price of 200-300g of plain biscuits has increased by 26% (from 98p to £1.24), while in meat and fish, pork loin chops have gone up by 28% (from £6.35 per kg to £8.12 per kg). In the frozen category, chicken nuggets are up 35% (from £1.79 to £2.41), while in deli and dairy, hard cheese has gone up the most on average, by 44% (from £6.92 per kg to £9.98 per kg). Olive oil tops our store cupboard classification, up 49% (from £3.87 to £5.78 on average between 500ml and 1 litre), but the king of food price inflation is the humble cucumber, up a massive 52% over a one year period from 55p to 84p each.
Not highlighted in the chart are the smallest price rises in each category, with peanuts up 5% (from £1.23 to £1.29 for 150-300g), lamb loin chop/steaks up 4% (from £15.49 to £16.13 per kg), frozen vegetable burgers up 11% (£1.99 to £2.21), sliced ham up 9% (£2.41 to £2.64 for 100-200g), low-sugar/non-chocolate breakfast up 6% (£2.08 to £2.20), and sweet potato up a mere 2% (from £1.17 to £1.19 per kg).
The Bank of England continues to tighten the screws on inflation, raising its base rate to 4.5% on 11 May 2023, and the projections are that inflation overall should start to reduce quite rapidly over the next few months.
However, as ICAEW Economies Director Suren Thiru recently said in a TV interview on BBC Breakfast, inflation is now becoming embedded into the everyday things that we buy. This makes the challenge for the Bank of England to bring inflation back down to its target range of 1% to 3% that much harder.