ICAEW chart of the week: Inflation (again)

My chart for ICAEW this week shows that while headline inflation slowed to 2.3% in April, a core inflation figure of 3.9% means the fight against inflation is far from over.

Inflation (again)
ICAEW chart of the week

Step chart combined with five individual line graphs under each step.

Annual CPI: Apr 2023 to Apr 2024

Core inflation +3.9% (height = 3.0%) 
Food prices +2.8% (height = 0.3%)
Alcohol & tobacco +8.1% (height = 0.3%)
Energy -16.7% (height = -1.3%)
=CPI all items +2.3% (height 2.3%)

Core inflation line graph: gradual slope downwards from +6.8% to +3.9%.

Food prices line graph: steep slope downwards from +19.3% to +2.8%.

Alcohol & tobacco line graph: flattish line from +9.1% which then rises, falls and rises before falling to +8.1%.

Energy prices line graph: sharply falling line with a couple of zig zags upwards and then a final fall - from +10.8% to -16.7%.

CPI all times - a gradual fall (with bumps) from +8.7% tp +2.3%.23 May 2024.


Chart by Martin Wheatcroft FCA. Design by Sunday.

Source: ONS, 'Consumer price inflation, UK: Apr 2024'.


© 2024.

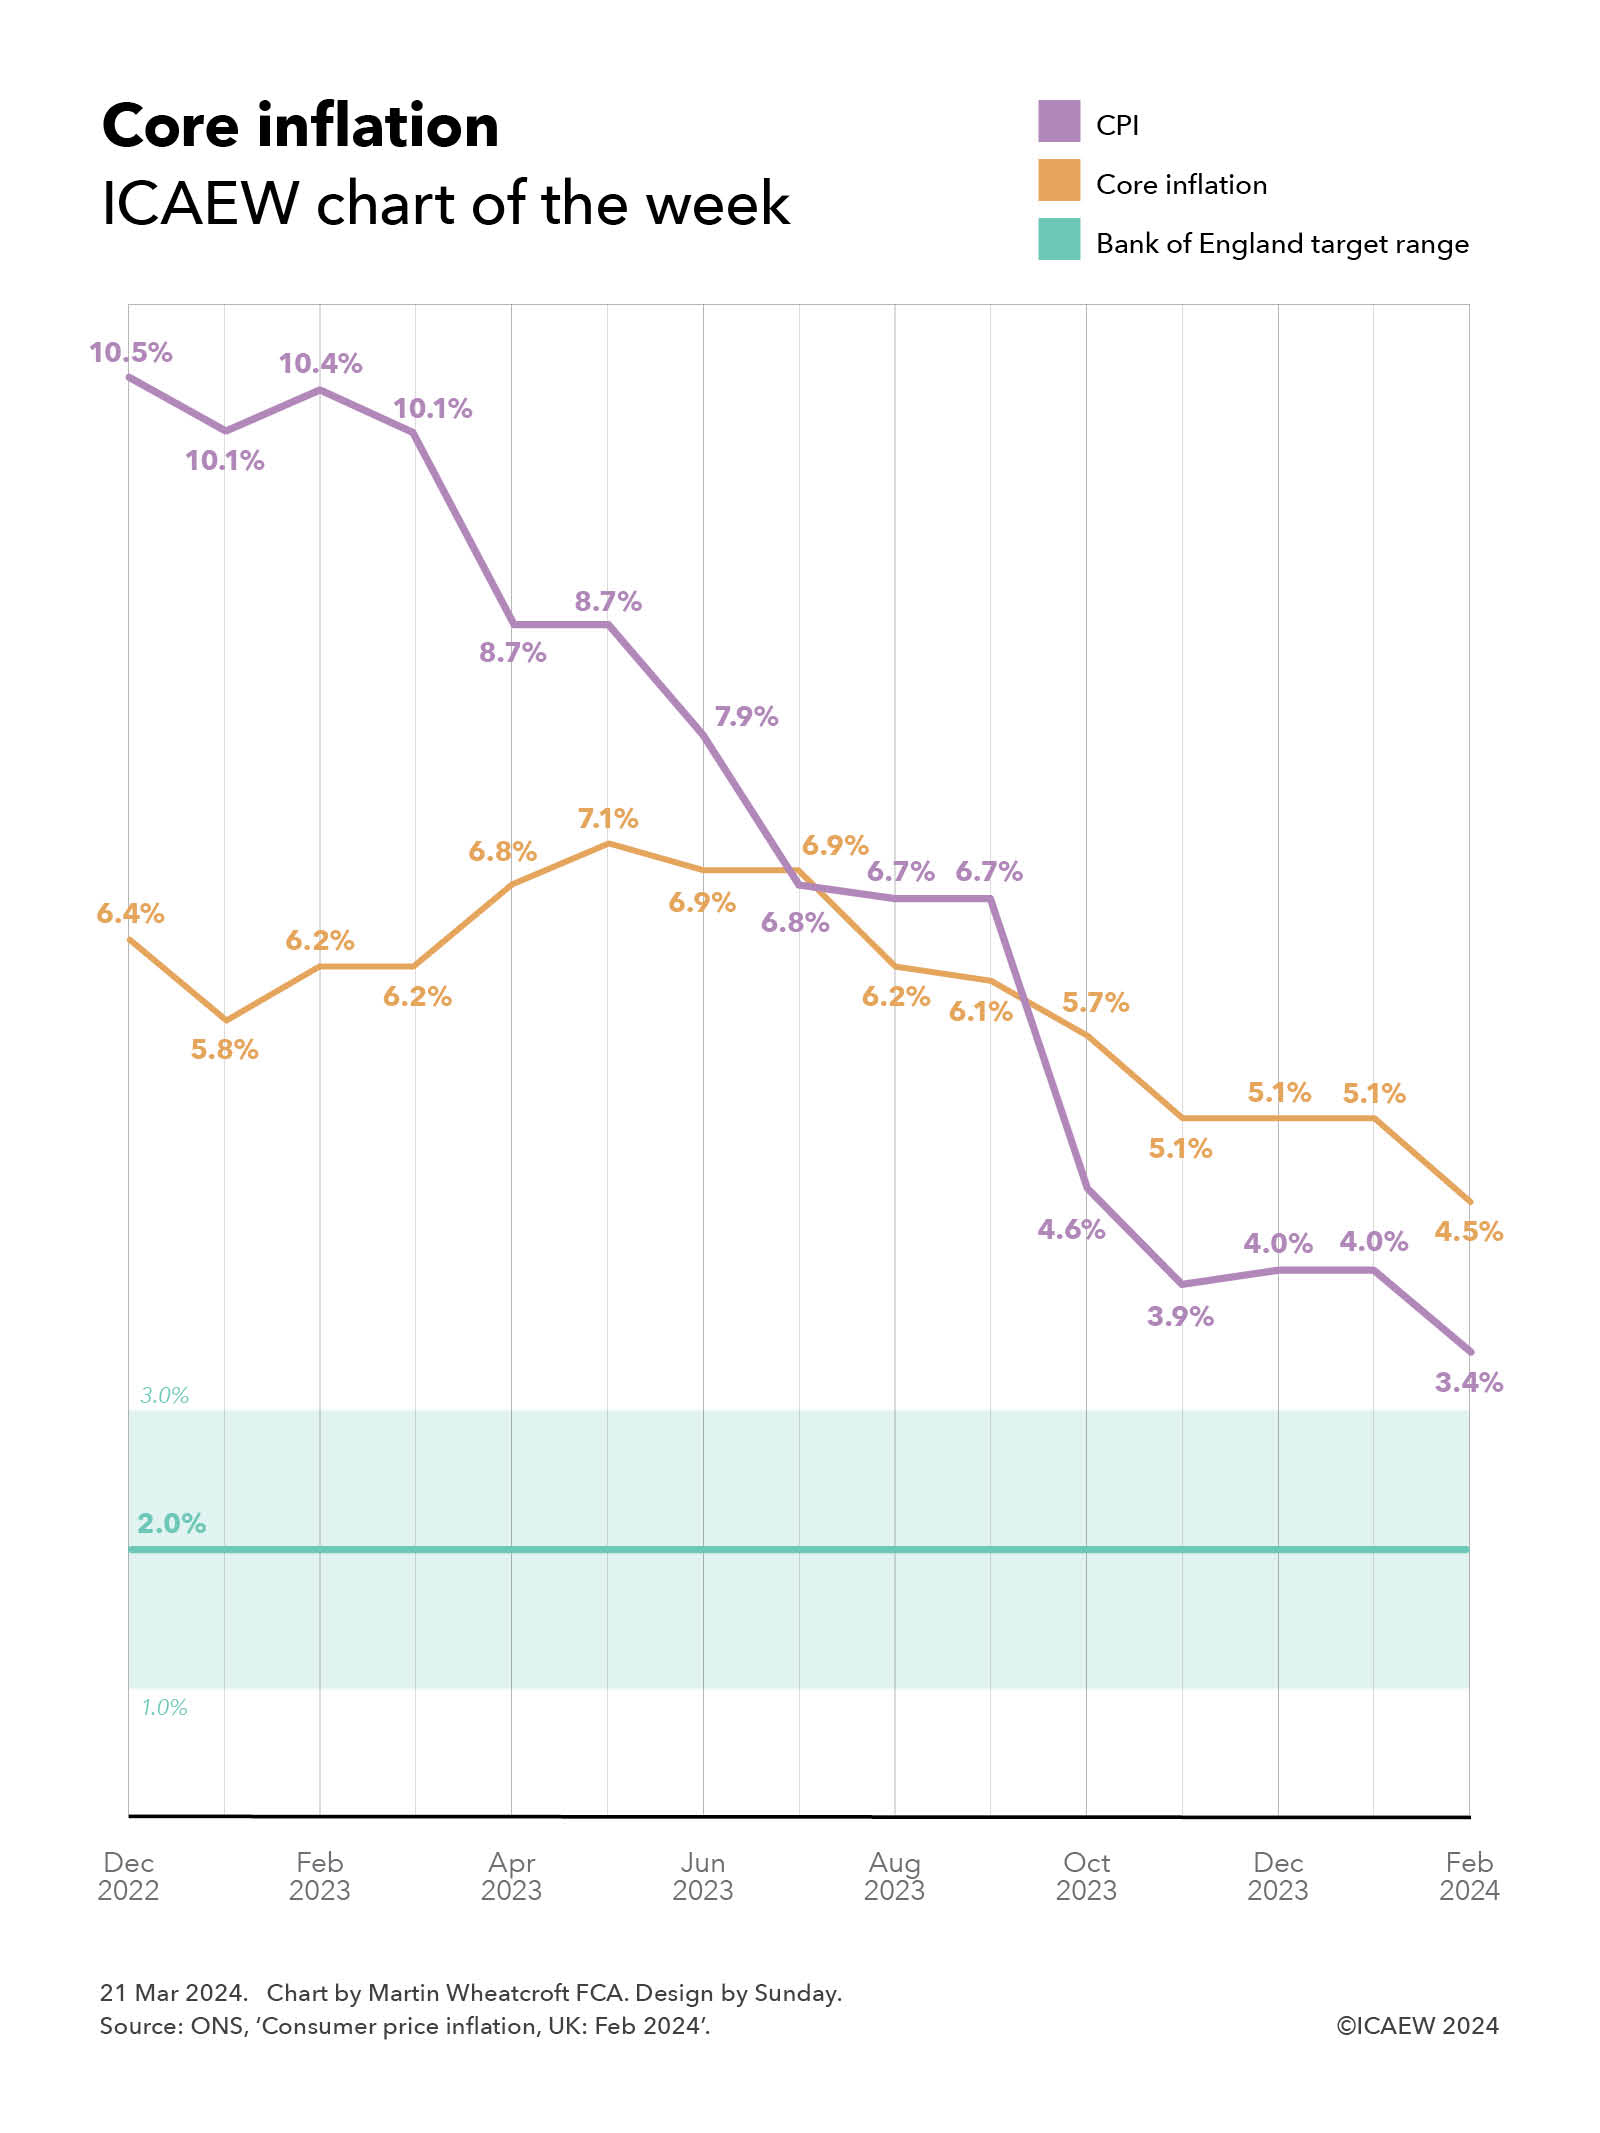
We return to the topic of consumer price inflation (CPI) this week following the news that it has returned to within its target range of 2% plus or minus 1% for the first time since July 2021. 

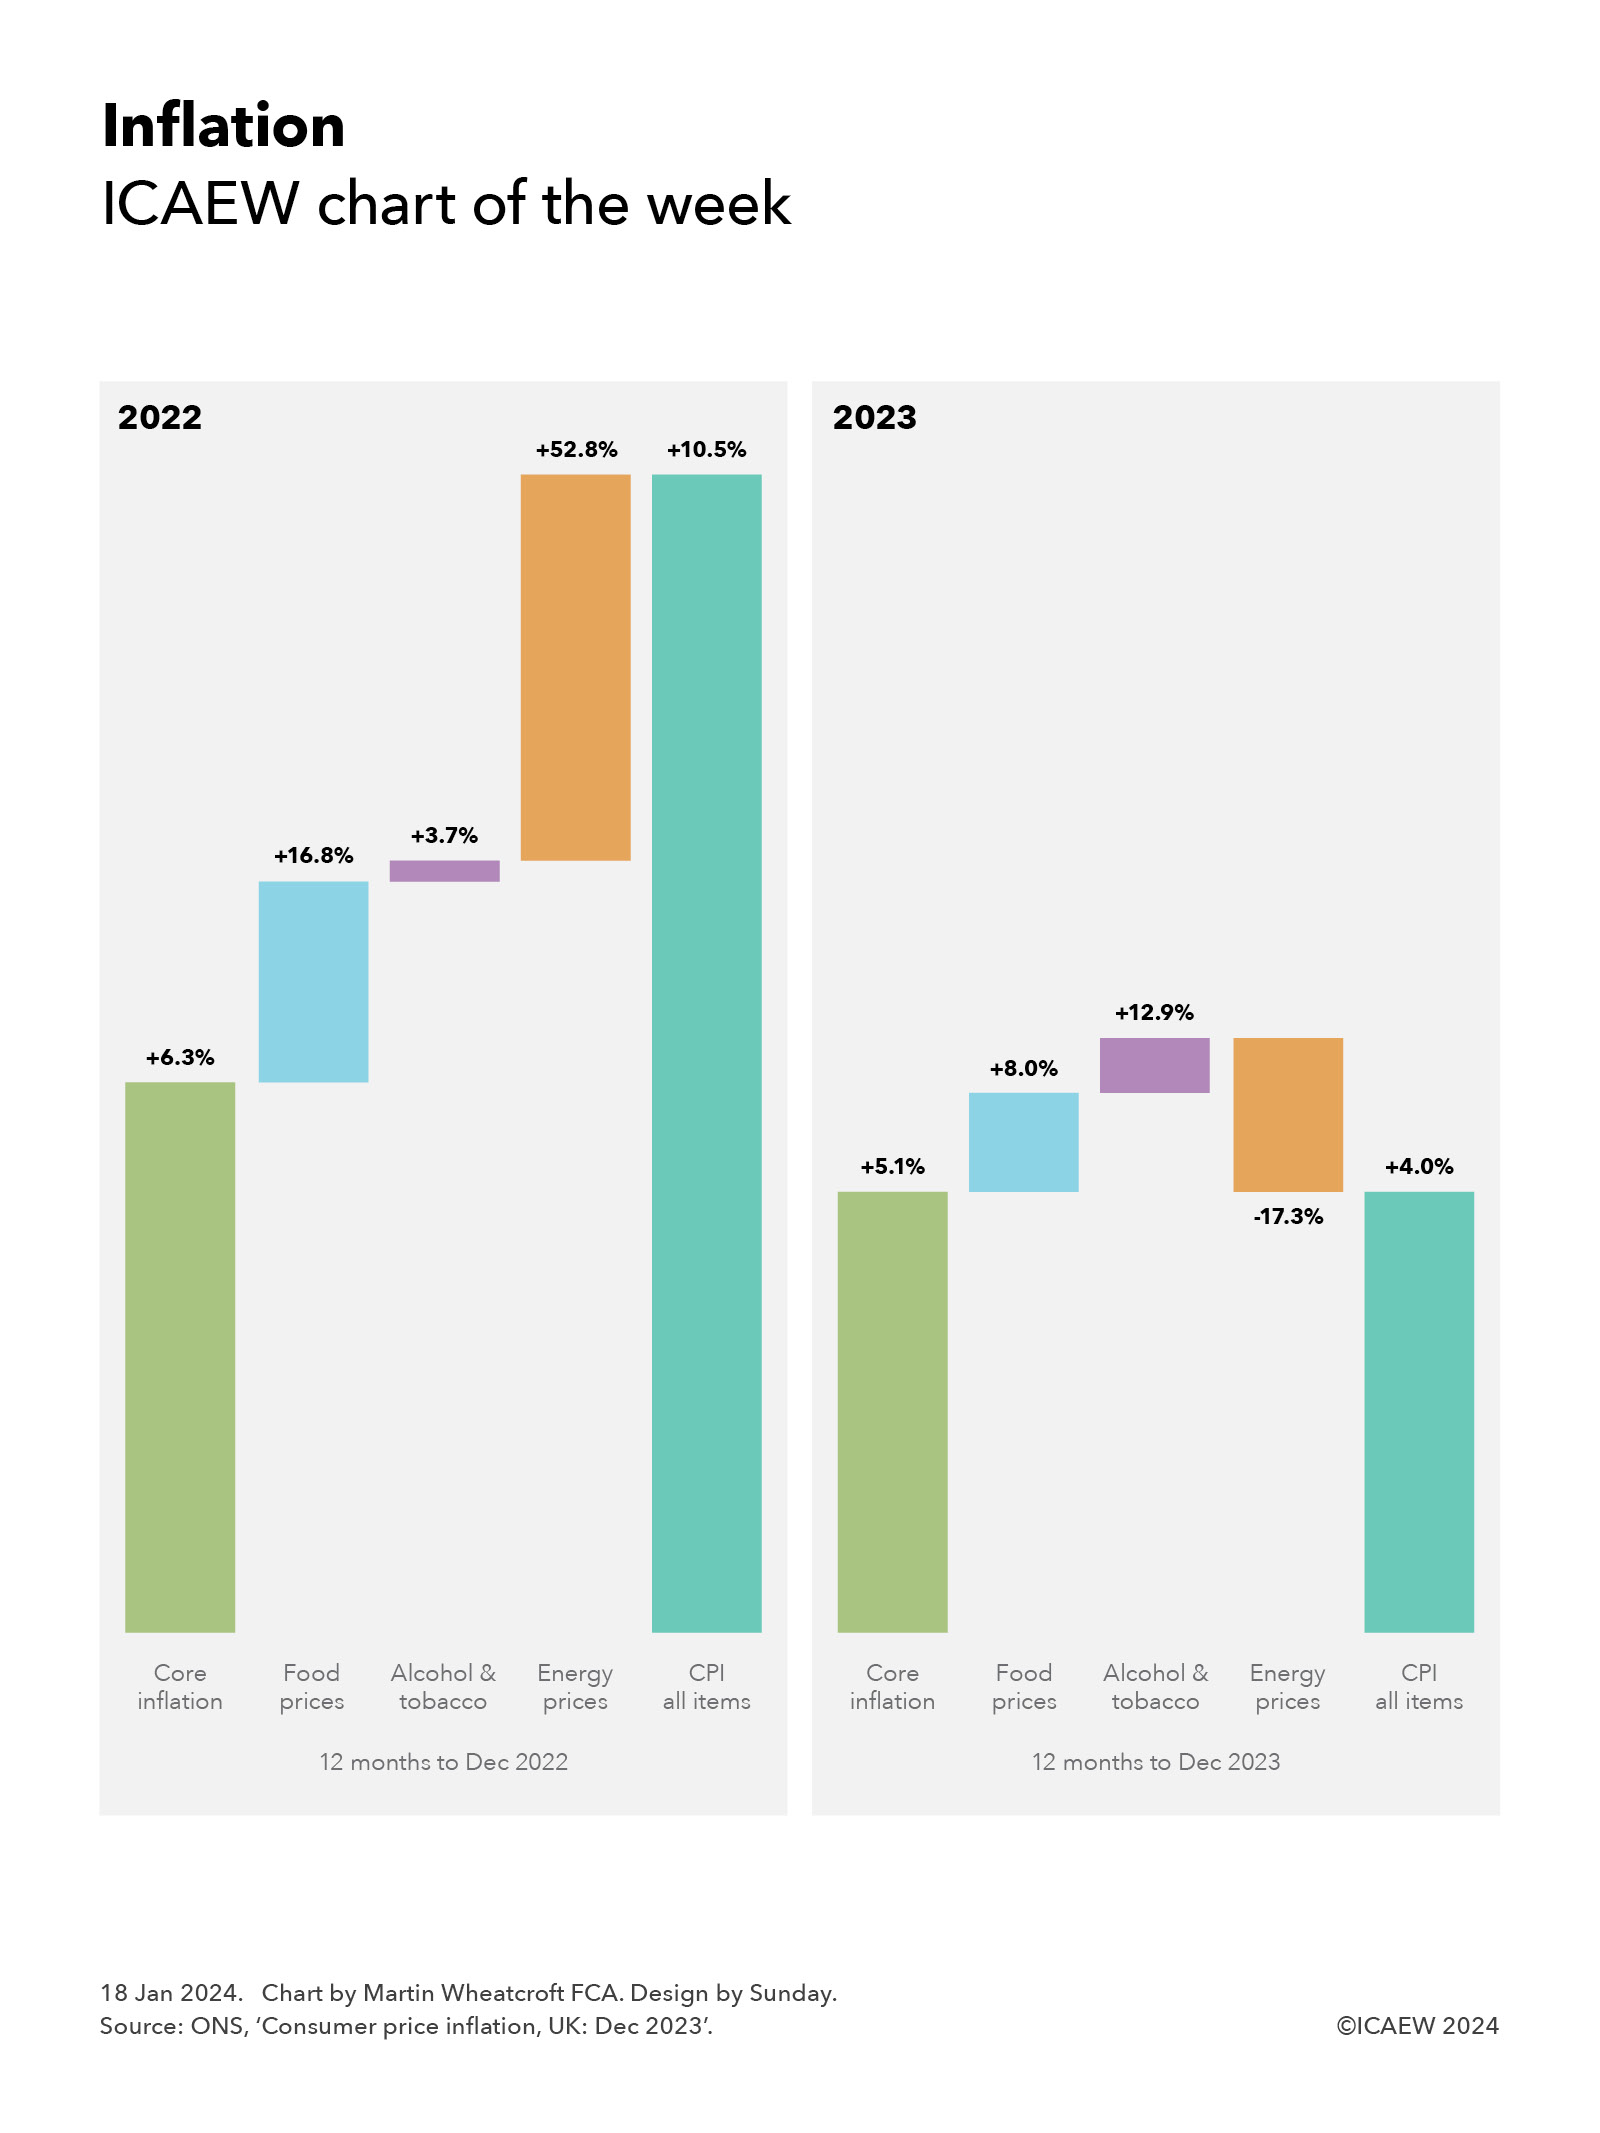
Our chart illustrates how a 16.7% fall in energy prices between April 2023 and April 2024, have partially offset core inflation of 3.9%, food price rises of 2.8% and alcohol and tobacco prices rises of 8.1%, to result in annual CPI of 2.3%.

It also shows how each of these components of inflation have changed over the last 12 months. Core inflation has slowed from an annual rate of 6.8% in April 2023 to 3.9% in April 2024, food price inflation from 19.3% to 2.8%, and alcohol and tobacco price inflation from 9.1% to 8.1%. Meanwhile, energy prices have fallen over the last year with the annual rate of change going from +10.8% in April 2023 to -16.7% in April 2024.

These components of the inflation index combine to see CPI slow from an annual rate of 8.7% in April 2023 to 2.3% for the 12 months to April 2024, positive news for the Bank of England. It has spent the last few years writing letters to the Chancellor, explaining why inflation is off target and the actions the Bank is taking to bring inflation back on target.

The challenge for the Bank of England’s Monetary Policy Committee is when to take the foot off the brake and start cutting interest rates. The indications are that this won’t be in June as some had hoped, with policymakers concerned about the persistence of services inflation (5.9% in the year to April 2024, a component of core inflation not shown in the chart) and the level of wage rises (5.7% in the year to March 2024), neither of which are consistent with inflation staying within its target range. 

This chart was originally published by ICAEW.

ICAEW chart of the week: Core inflation

The Bank of England Monetary Policy Committee held interest rates constant at its latest meeting, despite CPI falling to 3.4% in February and core inflation dropping to 4.5%.

Line chart:

Core inflation
ICAEW chart of the week

CPI (purple) - line
Core inflation (orange) - line
Bank of England target range - shaded area

Annual inflation rates for the years to Dec 2022 to Feb 2024:

CPI: 10.5%, 10.1%, 10.4%, 8.7%, 8.7%, 7.9%, 6.8%, 6.7%, 6.7%, 4.6%, 3.9%, 4.0%, 4.0%, 3.4% (just above the Bank of England target range).

Core inflation: 6.4%, 5.8%, 6.2%, 6.8%, 7.1%, 6.9%, 6.9% (crossing over CPI and back again), 6.2%, 6.1% (crossing over CPI), 5.7%, 5.1%, 5.1%, 5.1%, 4.5%.

Bank of England target range: shaded area across the chart between 1.0% and 3.0% with 2.0% solid line through the middle.


21 Mar 2024.
Chart by Martin Wheatcroft FCA. Design by Sunday.
Source: ONS, 'Consumer price inflation, UK: Feb 2024'.

(c) ICAEW 2024

The Office for National Statistics reported its latest estimates for inflation on Wednesday 20 March 2024, with both annual consumer price inflation (CPI) and annual consumer price inflation excluding food, alcohol, tobacco and energy (core inflation) in February falling by 0.6 percentage points to 3.4% and 4.5% respectively.

Our chart this week illustrates how CPI fell from 10.5% in the year to December 2022 to 4% in December 2023 and to 3.4% in February 2024, a rapid decline in the headline measure. This contrasts with the annual rate of core inflation, which increased from 6.4% in December 2022 to a peak of 7.1% in May 2023, before declining more gradually to 5.1% in December 2023 and to 4.5% in February 2024.

Annual food price inflation (5% in February 2024), alcohol and tobacco (11.9%), and energy prices (-13.8%) are of course many of the prices that we as consumers notice the most – what we buy in the supermarket, off-licence, at the fuel pump, or pay to heat and power our homes. However, food, alcohol, tobacco and energy prices are often very volatile and so core inflation allows us to understand what is happening to the (generally less volatile) prices of the other 78% of the things we buy as measured by the CPI Index. 

The drop in core inflation to 4.5% is a positive sign for the Monetary Policy Committee, even if it didn’t reduce interest rates at its most recent meeting on Thursday 21 March 2024. The headline measure of CPI is coming down, and is expected to fall further over the next few months as large food price increases a year ago drop out of the annual comparison, a factor that won’t affect core inflation directly.

Policymakers are expected to remain cautious about cutting interest rates for several more months, as they will want to see how inflationary the scheduled increases in April of 9.8% in the minimum wage, 8.5% in the state pension and 6.7% in universal credit and other welfare benefits will be. Salaries are a significant input cost for the majority of businesses and it is likely that many will seek to pass on higher salary costs to their customers, while higher spending by pensioners and those in receipt of benefits could start to push up prices again just at the point that the Bank of England hopes to have brought inflation under control. 

While there is likely to be much celebration and declaration of victory once the headline CPI measure drops into the target range over the next few months, how long it takes to bring down core inflation to within the target range is likely to be a better indicator of whether inflation has actually been tamed.

For more ICAEW analysis on the economy, click here.

This chart was originally published by ICAEW.

ICAEW chart of the week: Inflation

My chart for ICAEW this week illustrates how core inflation has only dropped from 6.3% in December 2022 to 5.1% in December 2023, even as the headline rate has come down from 10.5% to 4.0%.

Two step charts under the title 'Inflation'.

Step chart 1: 2022
(12 months to Dec 2022)

Core inflation +6.3% (corresponding to 5.0% in height)
+ Food prices +16.8% (height 1.8%)
+ Alcohol & tobacco +3.7% (height 0.2%)
+ Energy prices +52.8% (height 3.5%)

= CPI all items +10.5% (height 10.5%)

Step chart 2: 2023
(12 months to Dec 2023)

Core inflation +5.51% (height 4.0%)
+ Food prices +8.0% (height 0.9%)
+ Alcohol & tobacco +12.9% (height 0.5%)
+ Energy prices -17.3% (height -1.4%)

= CPI all items +4.0% (height 4.0%)


18 Jan 2024.
Chart by Martin Wheatcroft FCA. Design by Sunday.
Source: ONS, 'Consumer price inflation, UK: Dec 2023'.

(c) ICAEW 2024

On 17 January 2023, the Office for National Statistics (ONS) published its latest consumer price inflation (CPI) statistics for the 12 months to December 2023, reporting that headline inflation has fallen to an annual rate of 4.0% compared with 10.5% a year earlier – a more than halving of the annual rate of price growth.

This contrasts with CPI excluding energy, food, alcohol and tobacco (typically described as core inflation), which was 6.3% and 5.1% in the 12 months to December 2022 and 2023 respectively.

The left-hand side of my chart this week illustrates how core inflation in the 12 months to December 2022 of 6.3% contributed just under 5.0% to the weighted average total inflation rate of 10.5%, with food prices up 16.8%, alcohol and tobacco up 3.7%, and energy prices up 52.8% contributing a further 1.8%, 0.2% and 3.5% respectively.

The right-hand side shows the 12 months to December 2023, where core inflation of 5.1%, food price inflation of 8.0%, alcohol and tobacco inflation of 12.9%, and a fall in energy prices of 17.3% contributed approximately 4.0%, 0.9%, 0.5% and -1.4% respectively to the weighted average total rate of consumer price inflation of 4.0%

The relative weightings may explain why many people feel that inflation is still running faster than the headline rate. Food prices, up 8.0% in the past 12 months, have increased twice as fast as CPI of 4.0%, while alcohol (up 9.6%) and tobacco (up 16.0%) have gone up by even more. These may have been offset by energy prices coming down by 17.3% over the past 12 months, but this may not be perceived as that beneficial given how energy is still significantly more expensive than it was before the cost-of-living crisis started.

For policymakers, the bigger concern will be the stickiness in core inflation, which remains stubbornly higher than the Bank of England’s target for overall CPI of 2.0%. While the expectation is that both core and headline rates will come down further during the course of 2024, the Bank is likely to remain cautious about declaring victory in the fight against inflation despite worries about the effects of high interest rates on the struggling economy.

This chart was originally published by ICAEW.