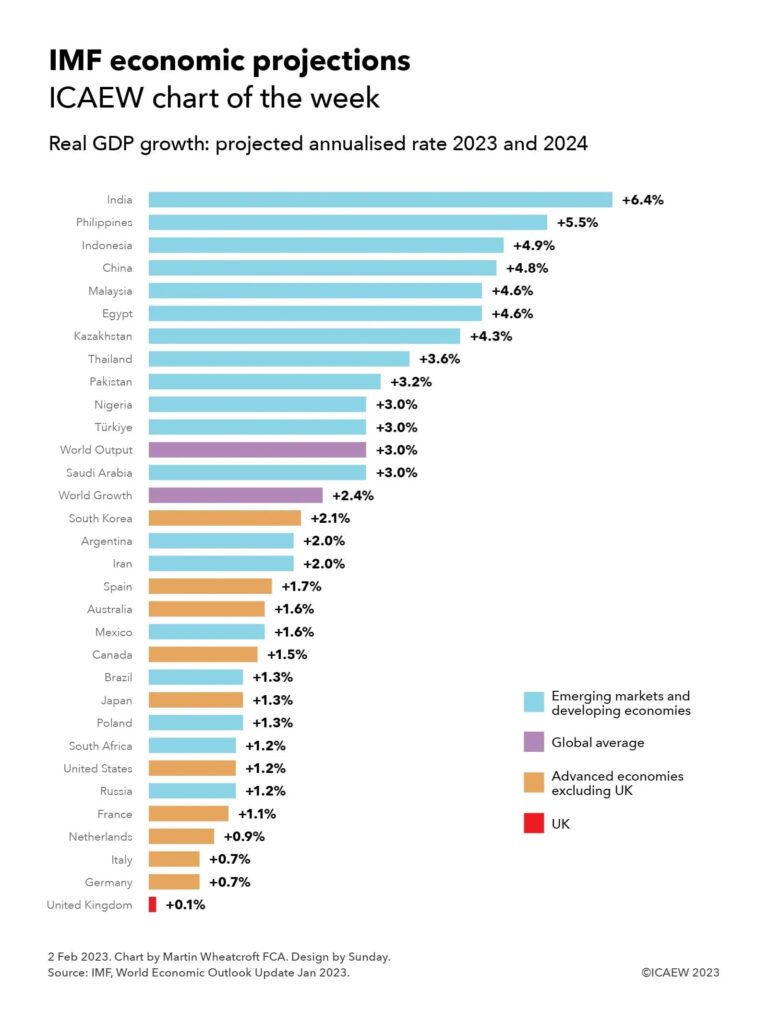
Our chart this week is on the global economy and how the UK is at the bottom of the IMF’s league table for economic growth in 2023 and 2024.

The IMF reported in its World Economic Outlook Update published on 30 January 2023 that it expects global economic output to increase by an average of 3.0% or 2.4% over the course of 2023 and 2024, depending on whether you weight the relative sizes of each economy using purchasing power parity (PPP) or market exchange rates.
While headlines have focused on the more immediate prospects for economies around the world in 2023 and an expected recession in the UK, our chart takes a look at projected economic growth for both 2023 and 2024 for the 30 countries tracked by the IMF.
The UK is at the bottom of this table, with a projected economic contraction of 0.6% in 2023 combined with projected growth of 0.9% in 2024 being equivalent to annualised economic growth after taking account of inflation of 0.1% over two years.
This does not compare well with projected real economic growth in the other G7 nations: Germany 0.7% (0.1% in 2023 and 1.4% in 2024), Italy 0.7% (0.6% and 0.9%), France 1.1% (0.7% and 1.6%), the USA 1.2% (1.4% and 1.0%), Japan of 1.3% (1.8% and 0.9%) and Canada 1.5% (1.5% and 1.5%). It is also below other advanced economies such as the Netherlands 0.9% (0.6% and 1.2%), Australia 1.6% (1.6% and 1.7%), Spain 1.7% (1.1% and 2.4%), and South Korea 2.1% (1.7% and 2.6%).
Average growth in emerging market and developing countries of 4.1% over the two years is much higher than the annualised average of 1.3% in advanced economies. India is expected to grow by 6.4% (6.1% in 2023 and 6.8% in 2024), Philippines 5.5% (5.0% and 6.0%), Indonesia 4.9% (4.8% and 5.1%), China 4.8% (5.2% and 4.5%), Malaysia 4.6% (4.4% and 4.9%), Egypt 4.6% (4.0% and 5.3%), Kazakhstan 4.3% (4.3% and 4.4%), Thailand 3.6% (3.7% and 3.6%), Pakistan 3.2% (2.0% and 4.4%), Nigeria 3.0% (3.2% and 2.9%), Türkiye 3.0% (3.0% and 3.0%), Saudi Arabia 3.0% (2.6% and 3.4%), Argentina 2.0% (2.0% and 2.0%), Iran 2.0% (2.0% and 2.0%), Mexico 1.6% (1.7% and 1.6%), Brazil 1.3% (1.2% and 1.5%), Poland 1.3% (0.3% and 2.4%), South Africa 1.2% (1.2% and 1.3%) and Russia 1.2% (0.3% and 2.1%).
Economic performance is not solely about these percentages, which while adjusting for inflation do not reflect the starting point nor changes in population. Advanced economies are much wealthier and smaller levels of growth represents much bigger increments than higher rates of growth in much poorer countries. Japan’s growth is despite a shrinking population, unlike the UK where the population is still expanding.
A devaluing currency can also mean that some countries can end up poorer at the end of the year despite positive headline growth rates. An example is Türkiye, where annualised average growth of 4.5% over the five years to 2022 was accompanied by a 98.9% fall in the value of the Turkish Lire against the Euro.
One crumb of comfort for the UK is that the IMF’s projections (not forecasts) are of course not what is going to happen. They are based on the IMF’s assessment of both official and unofficial forecasts and projections together with a range of assumptions from global energy prices to business investment, from fiscal policy to the behaviour of consumers, from the effects of climate change to the impact of wars. All of these could easily end up being very different, even if economic forecasting was an exact science, which it isn’t.
Policymakers in the UK will definitely be hoping that the British economy performs much better than these dismal projections suggest. After all, if you are at the bottom of a league, the only direction to aim for is up.