My chart this week looks at the federal deficit of $1.7trn reported by the US government for its recently completed financial year ended 30 September 2023.
The US Department of Treasury published on 20 October 2023 its final monthly treasury statement for the US government’s financial year ended 30 September 2023 (FY2023), enabling our chart this week to look at the actual numbers over the past five years and the budget for the new financial year that started on 1 October.
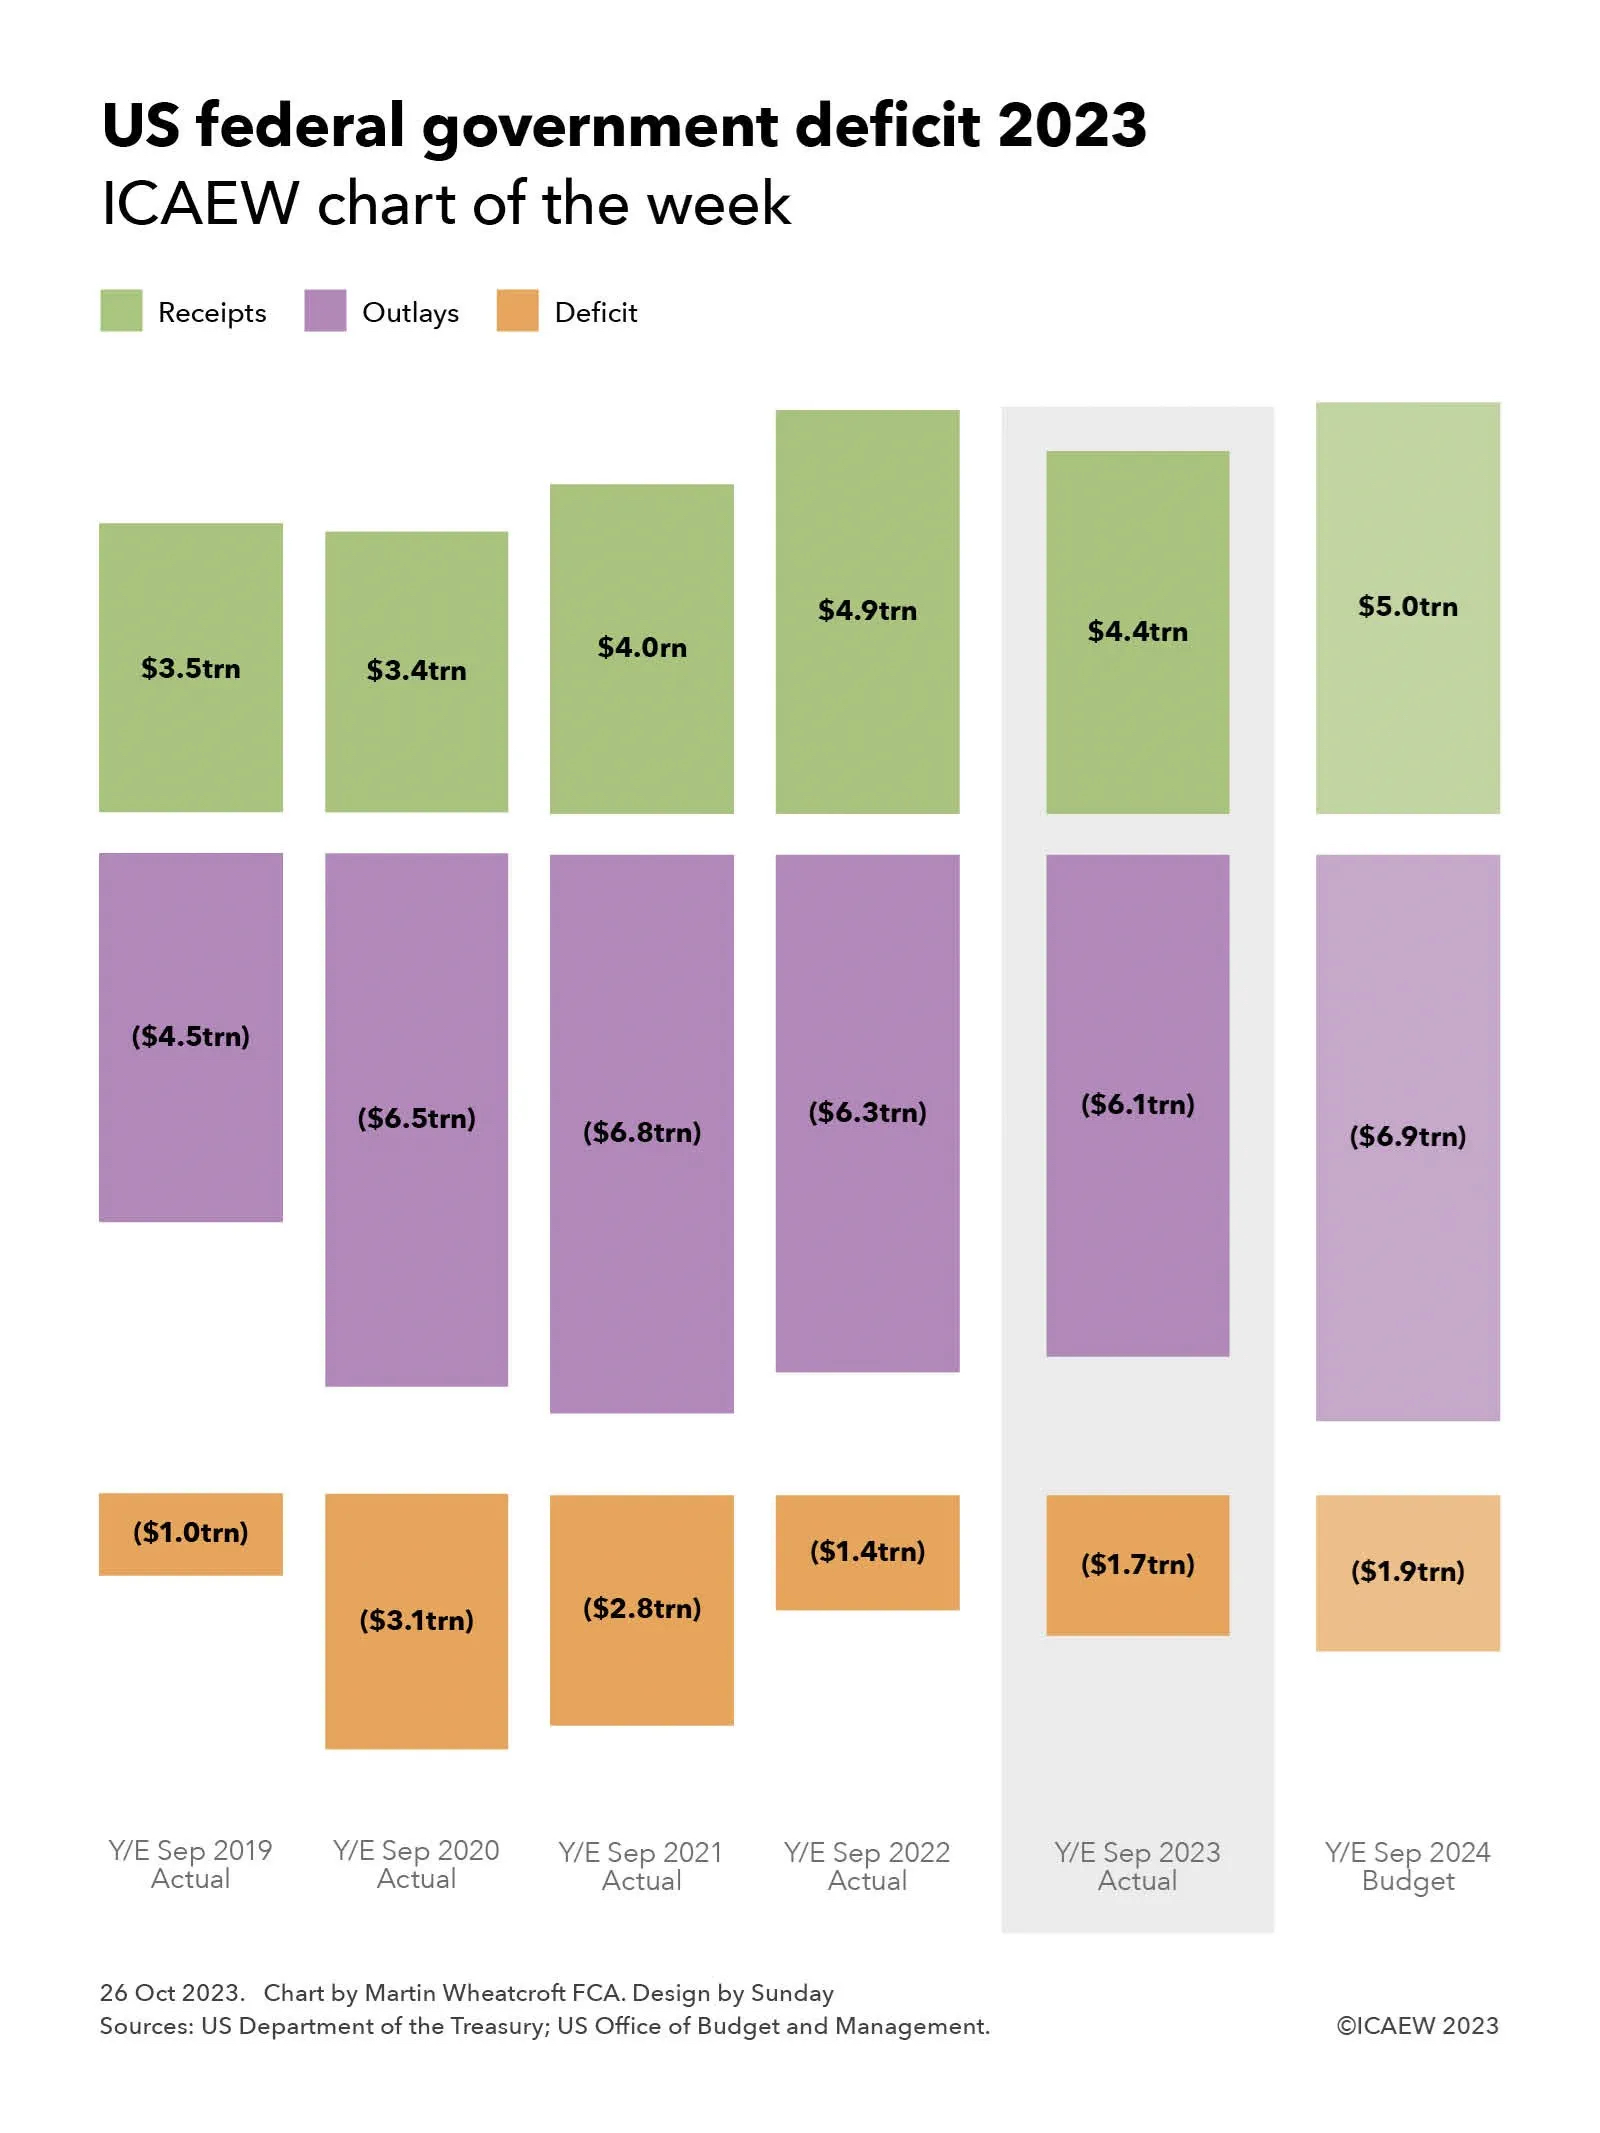
Our chart illustrates how the deficit increased significantly from the $1.0trn reported for FY2019 ($3.5trn receipts less $4.5trn outlays) to $3.1trn in FY2020 ($3.4trn-6.5trn) and $2.8trn in FY2021 ($4.0trn-$6.8trn) at the height of the pandemic, before falling to $1.4trn in FY2022 ($4.9trn-$6.3trn) as the US economy recovered. The deficit by $0.3trn increased to $1.7trn in FY2023 ($4.4trn-$6.1trn) and is budgeted to increase by a further $0.2trn to $1.9trn in FY2024 ($5.0trn forecast receipts-$6.9trn forecast outlays).
Not shown in the chart is the excess of financial liabilities over financial assets, which increased by $1.7trn from $22.3trn on 30 September 2022 to $24.0trn on 30 September 2023. This differs from ‘debt held by the public’ (the headline measure of federal debt), which increased by $2.0trn from $24.3trn to $26.3trn, more than the federal deficit because of movements in other financial assets and liabilities.
Receipts in FY2023 of $4,439bn comprised $2,176bn in individual income taxes, £1,614bn in social security and retirement contributions, $420bn in corporation income taxes, $80bn in customs duties, $76bn in excise taxes, £34bn in estate and gift taxes and $39bn in other receipts. Outlays for same period of $6,134bn comprised $1,737bn on health and Medicare, $1,354bn on social security, $821bn on defence, $774bn in welfare benefits, $659bn in interest, $302bn for veteran services and benefits, $127bn on transportation, $100bn on commerce, and $260bn on other outlays.
The latter includes the administration of justice, agriculture, community and regional development, education, training, employment and social services, energy, general government, general science, space and technology, international affairs, natural resources and environment, and undistributed offsetting receipts.
These amounts are different from the accruals-based US GAAP federal government financial statements for FY2023 that are expected to be published next April, which will show a much larger accounting loss than the federal deficit reported here. For example, the FY2022 net operating cost (ie accounting loss) of $4.2trn was $2.8trn higher than the federal deficit of $1.4trn for last year, of which the largest difference of $2.6trn related to accruals for federal employee and veteran benefits.
These amounts appear astronomical, especially to those of us living in smaller (and unfortunately) less prosperous countries than the 335m people who live in the US, with its estimated GDP of $26.3trn in FY2023 – equivalent to around $6,600 per person per month.
Federal receipts and outlays in FY2023 represented 17% and 23% of GDP respectively or on a per capita basis were approximately $1,105 and $1,525 per person per month. The federal deficit was therefore equivalent to 6% of GDP or $420 per person per month.
The excess of financial liabilities over financial assets and debt held by the public were 91% and 100% of GDP respectively, equivalent to an amount owed of around $71,500 or $78,500 per person, depending on which measure is used.