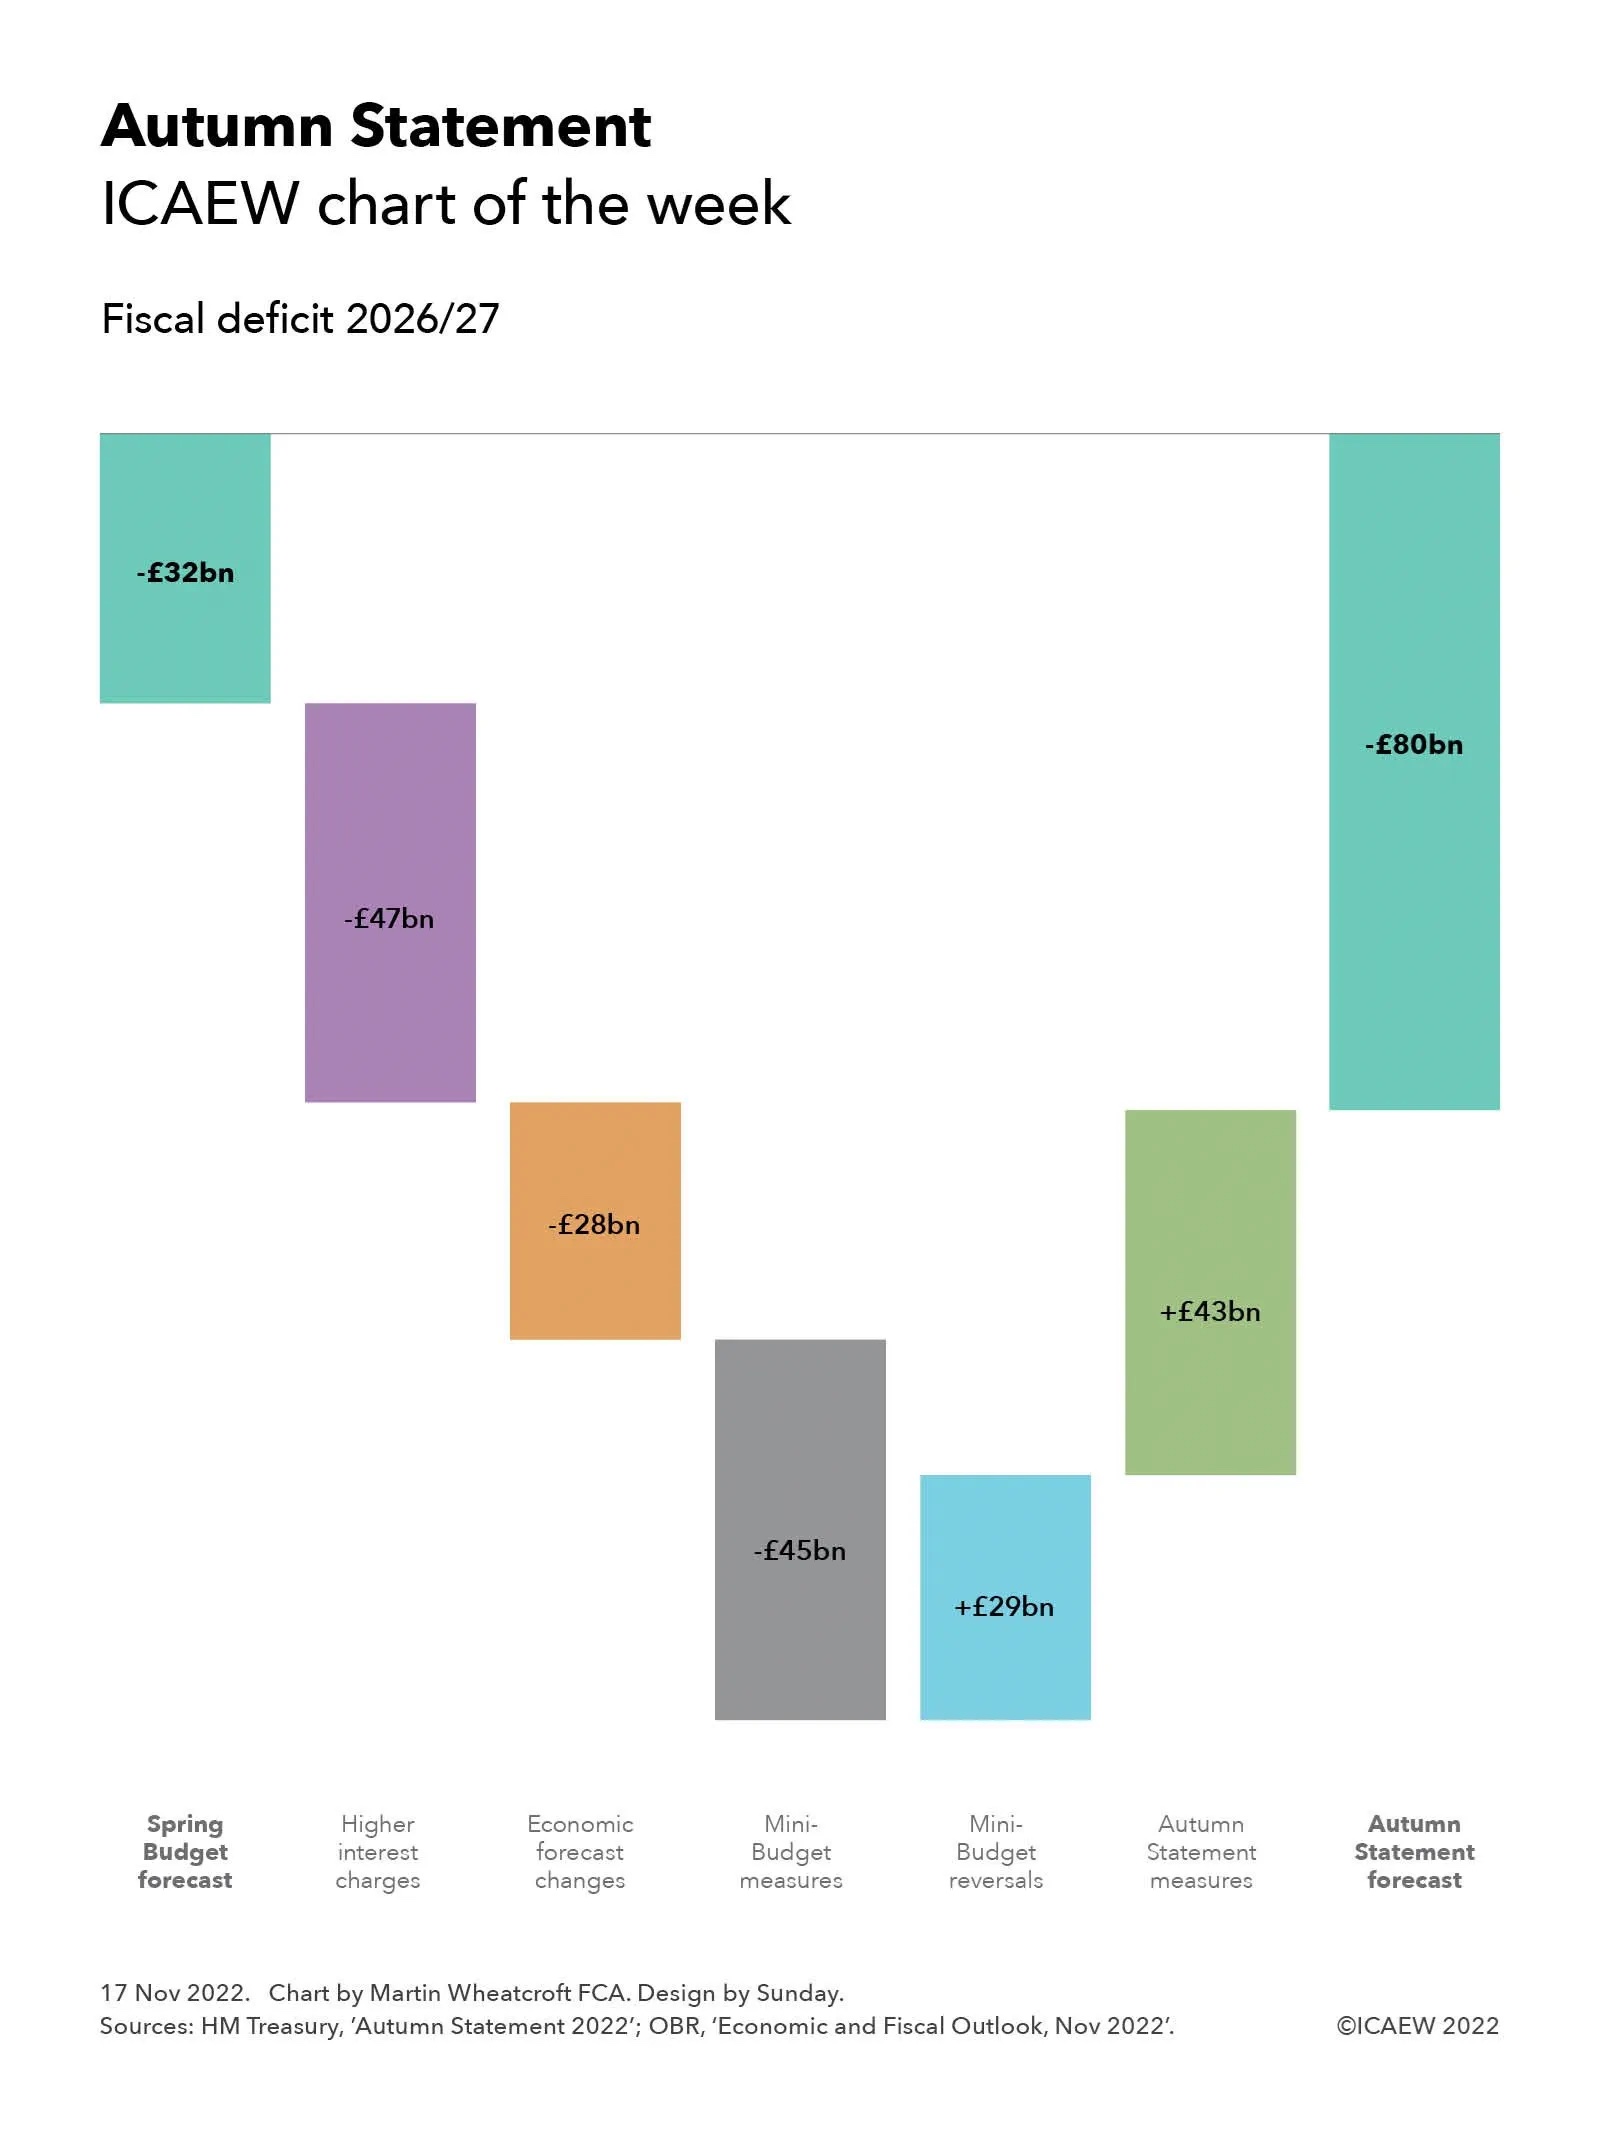
The public finances have been a rollercoaster ride over the last few months, as illustrated by this week’s chart showing how the forecast for the fiscal deficit in 2026/27 has changed since the Spring Budget.
Former Chancellor and now Prime Minister Rishi Sunak expressed some optimism back in March when he presented his Spring Budget, commenting how he remained committed to achieving a current budget surplus despite the huge amounts spent supporting individuals and businesses through the pandemic, and the support he was then offering to help with energy bills as they started to soar.
My chart this week illustrates how the fiscal situation has deteriorated significantly as rising interest rates, accelerating inflation, and an economy entering recession have adversely affected the public finances. Together with the additional energy support measures announced by then Prime Minister Liz Truss in September, the shortfall between receipts and expenditure is expected to be £270bn higher over a five-year period to 2026/27 than was forecast by the Office for Budget Responsibility back in March.
In 2026/27 itself (the year ending 31 March 2027), interest charges are expected to be £47bn higher than previously forecast, while tax receipts and other forecast changes are expected to require an extra £28bn in additional funding (of which £25bn relates to lower tax receipts).
In theory this would result in a deficit of £107bn, which is why it was surprising that then Chancellor Kwasi Kwarteng decided to announce unfunded tax cuts amounting to £45bn a year by 2026/27. Although Kwarteng was hoping his planned tax cuts would help stimulate the economy, if they hadn’t then the deficit could have risen to more than £150bn, an unsustainable level that caused financial markets to take fright – even if they and we didn’t have the official numbers at that point.
Reversals to the mini-Budget followed as Chancellor Jeremy Hunt and Prime Minister Rishi Sunak attempted to reassure markets of their fiscal credibility, with £43bn in tax and spending changes to plug some of the gap. These comprise tax rises amounting to around £23bn a year (more than offsetting the £16bn of tax cuts retained from the mini-Budget), together with £20bn in lower levels of public spending than previously planned.
Together the forecast changes and government decisions give rise to a forecast deficit of £80bn in 2026/27, significantly higher than previously forecast. This is not a comfortable place for the public finances, with the Chancellor having to abandon the government’s previous commitment to achieving a current budget surplus in addition to, as expected, deferring the point at which he expects to see the underlying debt-to-GDP ratio start to fall from three to five years into the future.
Both tax and spending measures primarily involve fiscal drag, freezing tax allowances so that more people are brought into paying tax or paying tax at higher rates, and severely constraining public spending. Although it might be theoretically possible to hold the line on both tax and spending constraint for the next five years, there are likely to be some adjustments needed in the Spring Budget as pressures on public services mount, while the most difficult decisions have been postponed until after the next general election.
This week’s chart is not a pretty picture.