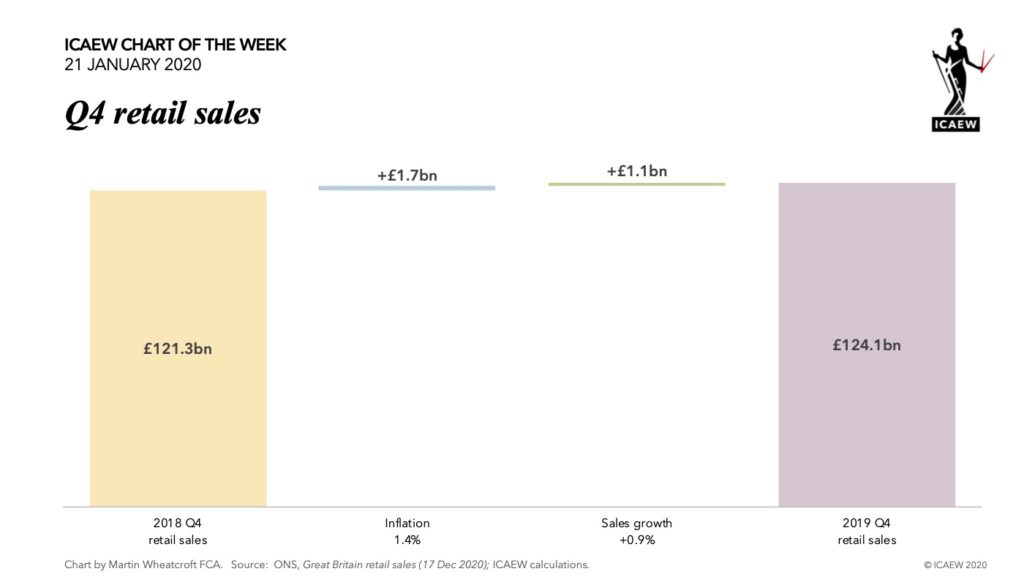
Concerned about the state of the UK economy? Then the latest retail sales numbers will not have helped, with fourth quarter sales in the UK mainland just 0.9% higher after inflation over a year earlier, as illustrated by the #icaewchartoftheweek.
With population growth still estimated to be running at around 0.6% a year, this implies that retail sales per capita in Q4 (at around £635 per month) were just 0.3% higher after inflation than the same period in 2018.
Sales in Q4 of £124.1bn comprised £41.3bn on food, drink and tobacco, £21.3bn on clothing and footwear, £19.6bn on household goods, £11.5bn on automotive fuel and £30.4bn on other non-food purchases. On a per capita basis, this is equivalent to approximately £210 per person per month on food, drink and tobacco, £110 on clothing and footwear, £100 on household goods, £60 on automotive fuel and £155 on other non-food purchases.
This low level of growth on a year earlier reflects a slow-down in retail activity in the fourth quarter of 2019, with the Office for National Statistics reporting that Q4 sales were 0.9% lower than the third quarter on a seasonally-adjusted basis.
This will feed into fourth quarter GDP, which will not be good news for the Chancellor as he puts together what is being rumoured to be a radical first Budget in March – a weak economy will reduce his room for manoeuvre to reform the tax system while boosting public spending at the same time.