My chart for ICAEW this week illustrates how company dissolutions continue to outpace incorporations as the economy remains in first gear.
A key indicator for the health of the economy is the comparison between how many companies are created each year and the number that are dissolved, and our chart this week illustrates how these compare over the last four years up until 1 December 2023.
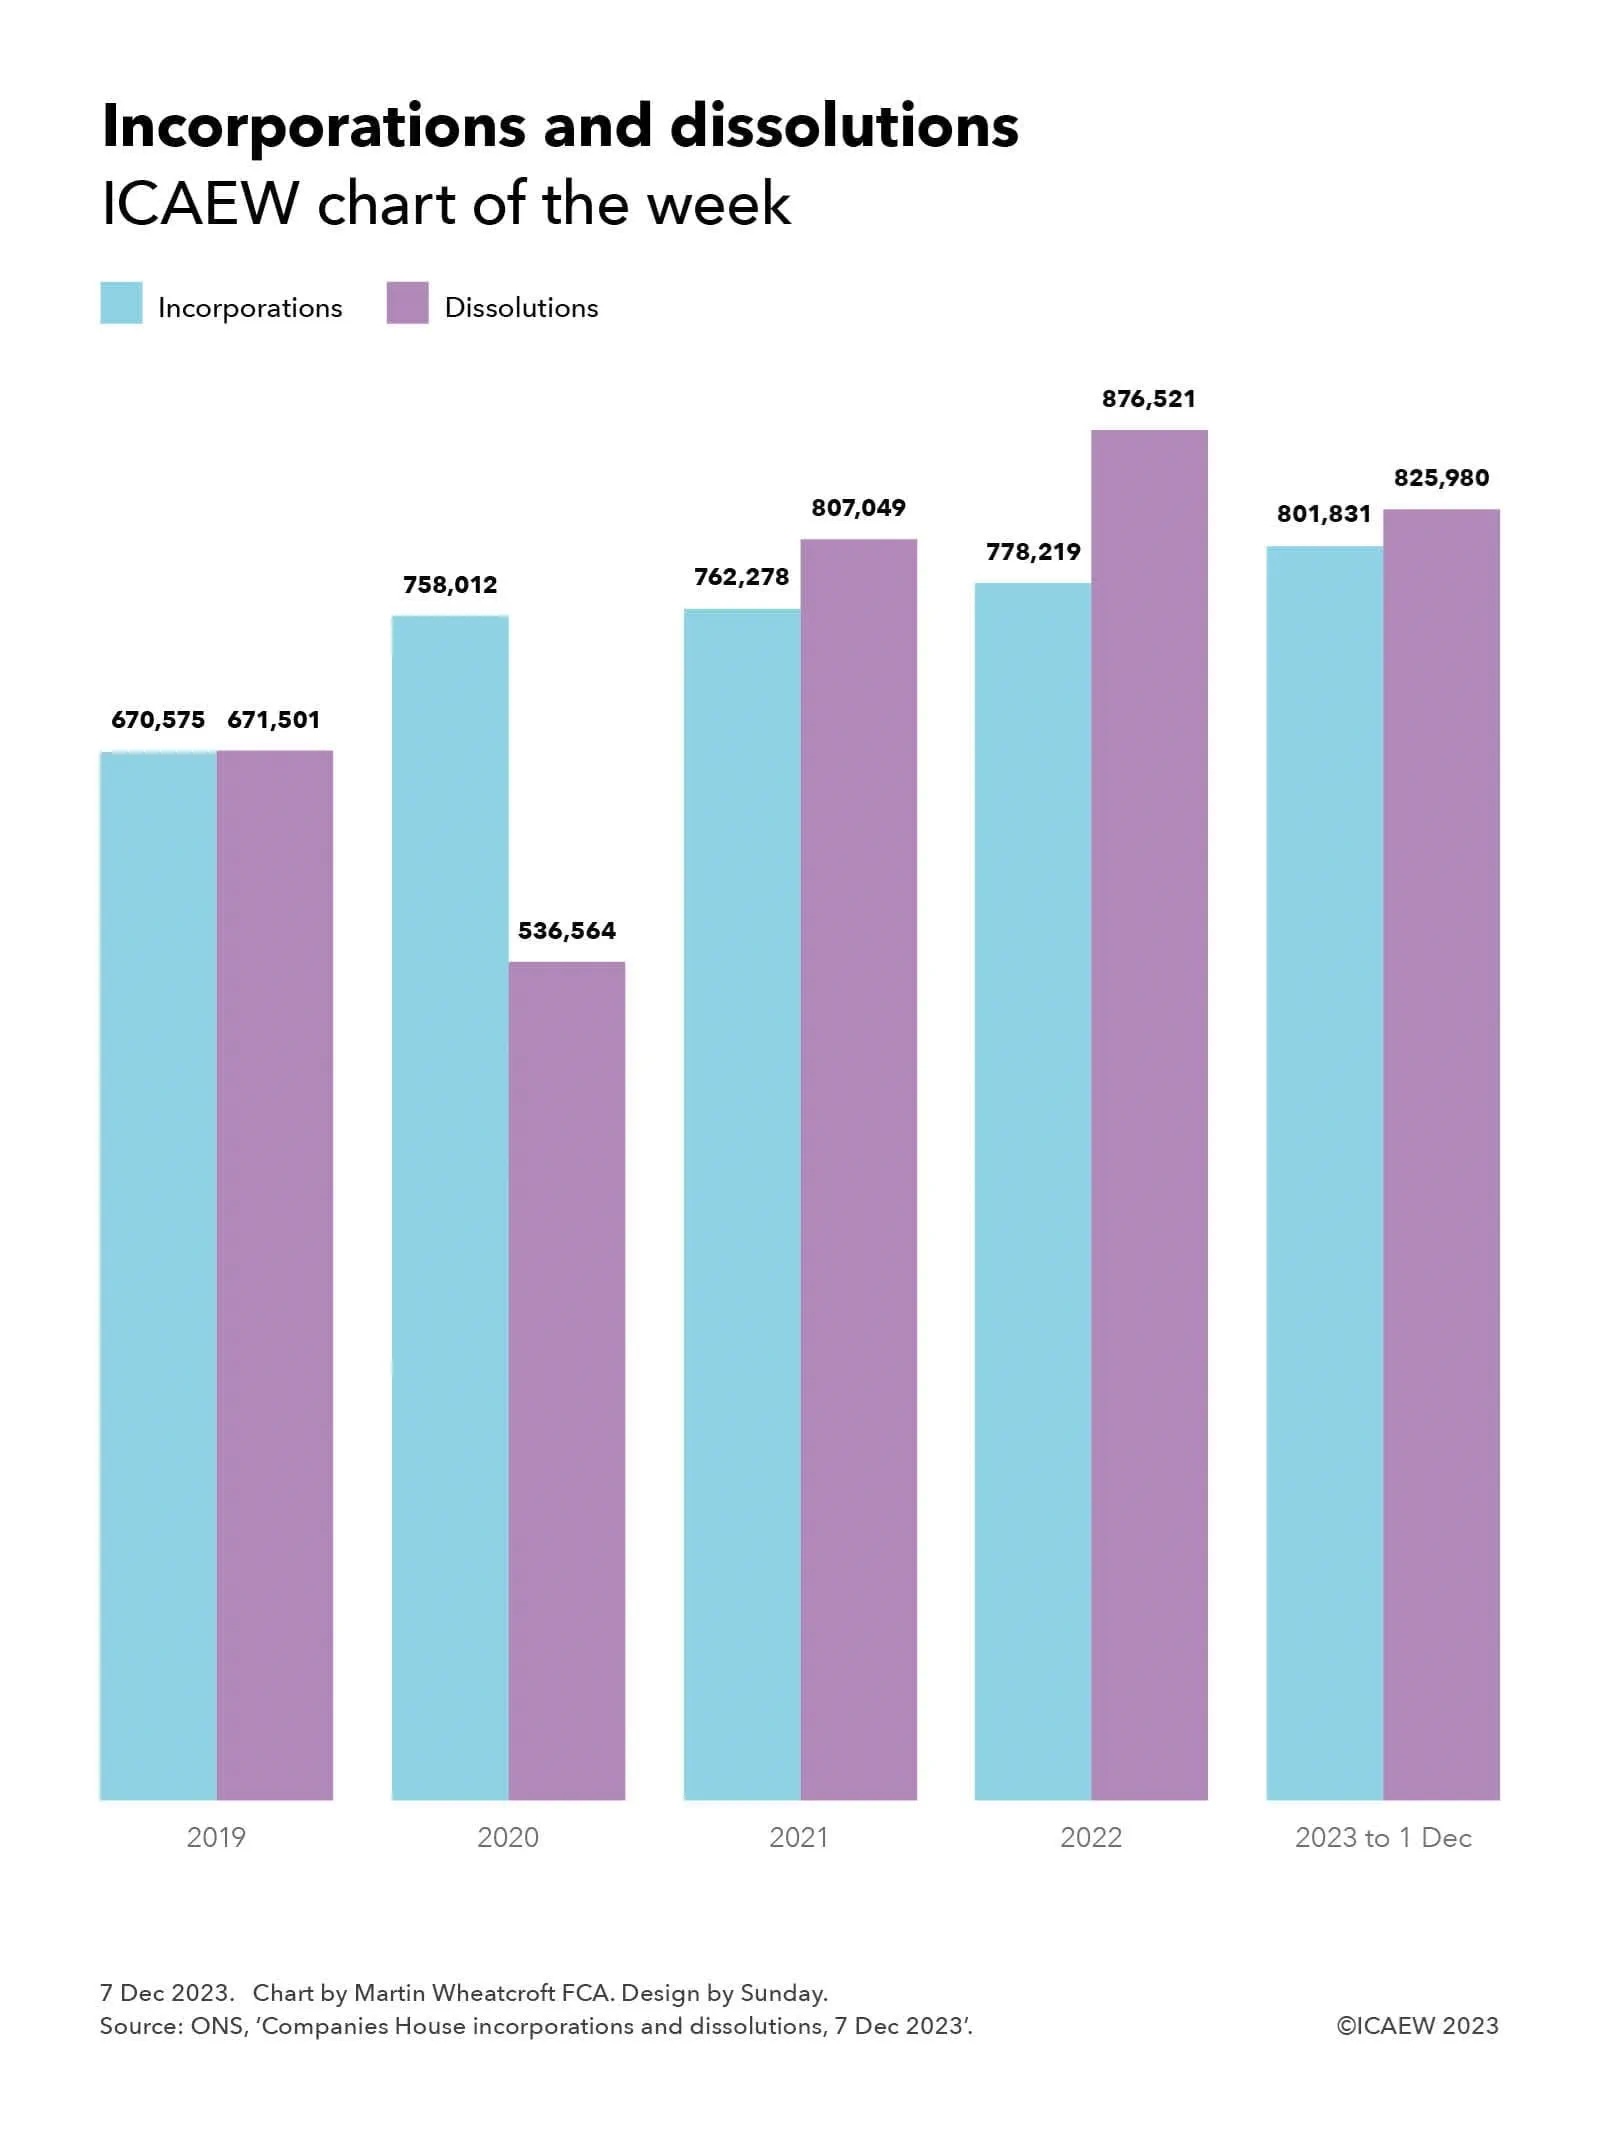
In 2019 there were 670,575 company incorporations and 671,501 dissolutions (391,066 compulsorily and 280,435 voluntarily), a net contraction in the number of companies of 926, consistent with the rather tepid economy we were experiencing in the year before the pandemic.
The numbers for 2020 were distorted by the pandemic, with incorporations rising to 758,012 and dissolutions falling to 536,564 (275,933 compulsorily and 260,631 voluntarily) – a net increase of 221,448. The rise in incorporations was no doubt contributed to by people deciding to start new businesses during lockdown, although bulk incorporations may also have been a factor. The significant fall in companies dissolved in 2020 compared with the previous year reflects government support on offer during the pandemic that propped up many companies that would otherwise have failed during 2020.
Incorporations rose further to 762,278 in 2021 and 778,219 in 2022, but these gains were more than offset by a sharp rise in dissolutions, which jumped to 807,049 (508,448 compulsorily and 289,604 voluntarily) in 2021 and 876,521 (572,646 compulsorily and 304,875 voluntarily) in 2022 as government support was withdrawn and reality caught up with many companies. Extremely high energy costs and high inflation were key factors in the demise of many businesses over this period. The net decrease in the number of companies was 44,771 in 2021 and 98,202 in 2022.
The number of companies incorporated during the first 11 months of 2023 was 801,831, a 9% rise on the equivalent period last year, while 825,980 companies were dissolved (539,643 compulsorily and 286,337 voluntarily), a rise of less than 1%. This has narrowed the gap to a contraction of 24,149 companies in the first 11 months of 2023.
While these numbers may be accurate to the nearest digit (unlike most sample-based statistics), their meaning for the economy is much less precise. Many companies are incorporated but never go on to trade, while some incorporations are merely a corporate wrapper around an existing business, or with personal service companies they can be a conversion of economic activity from one legal form to another. Unfortunately, companies are also sometimes incorporated for fraudulent purposes. Similarly, companies are wound up for a range of reasons and not just because they are all the consequence of failing businesses.
Despite that, they do provide a helpful indicator on what is going on with the economy, as the ‘cycle of business life’ is played out. For example, in theory it should be positive that even after a post-pandemic ‘shakeout’ the total number of companies over the period from 2019 to 1 December 2023 has grown by 53,300.
This may also be a statistic worth watching in 2024 as Companies House uses its new powers to weed out companies in the register. Just how significant will the introduction of new verification procedures and more active enforcement activity be to numbers of companies being incorporated and dissolved each year?