Our chart this week illustrates how in representing more than half of the world economy, decisions taken by the G7 can have a significant impact on the entire planet.
The G7 summit hasn’t formally started yet, but Group of Seven (G7) ministers and their guests have already started to meet ahead of the main event next month, albeit subject to quarantine restrictions.
The #icaewchartoftheweek illustrates how important this gathering is by highlighting how the seven major democratic nations and the European Union that together comprise the G7 represent more than half the global economy – and even more than that, once four invited guest nations are included.
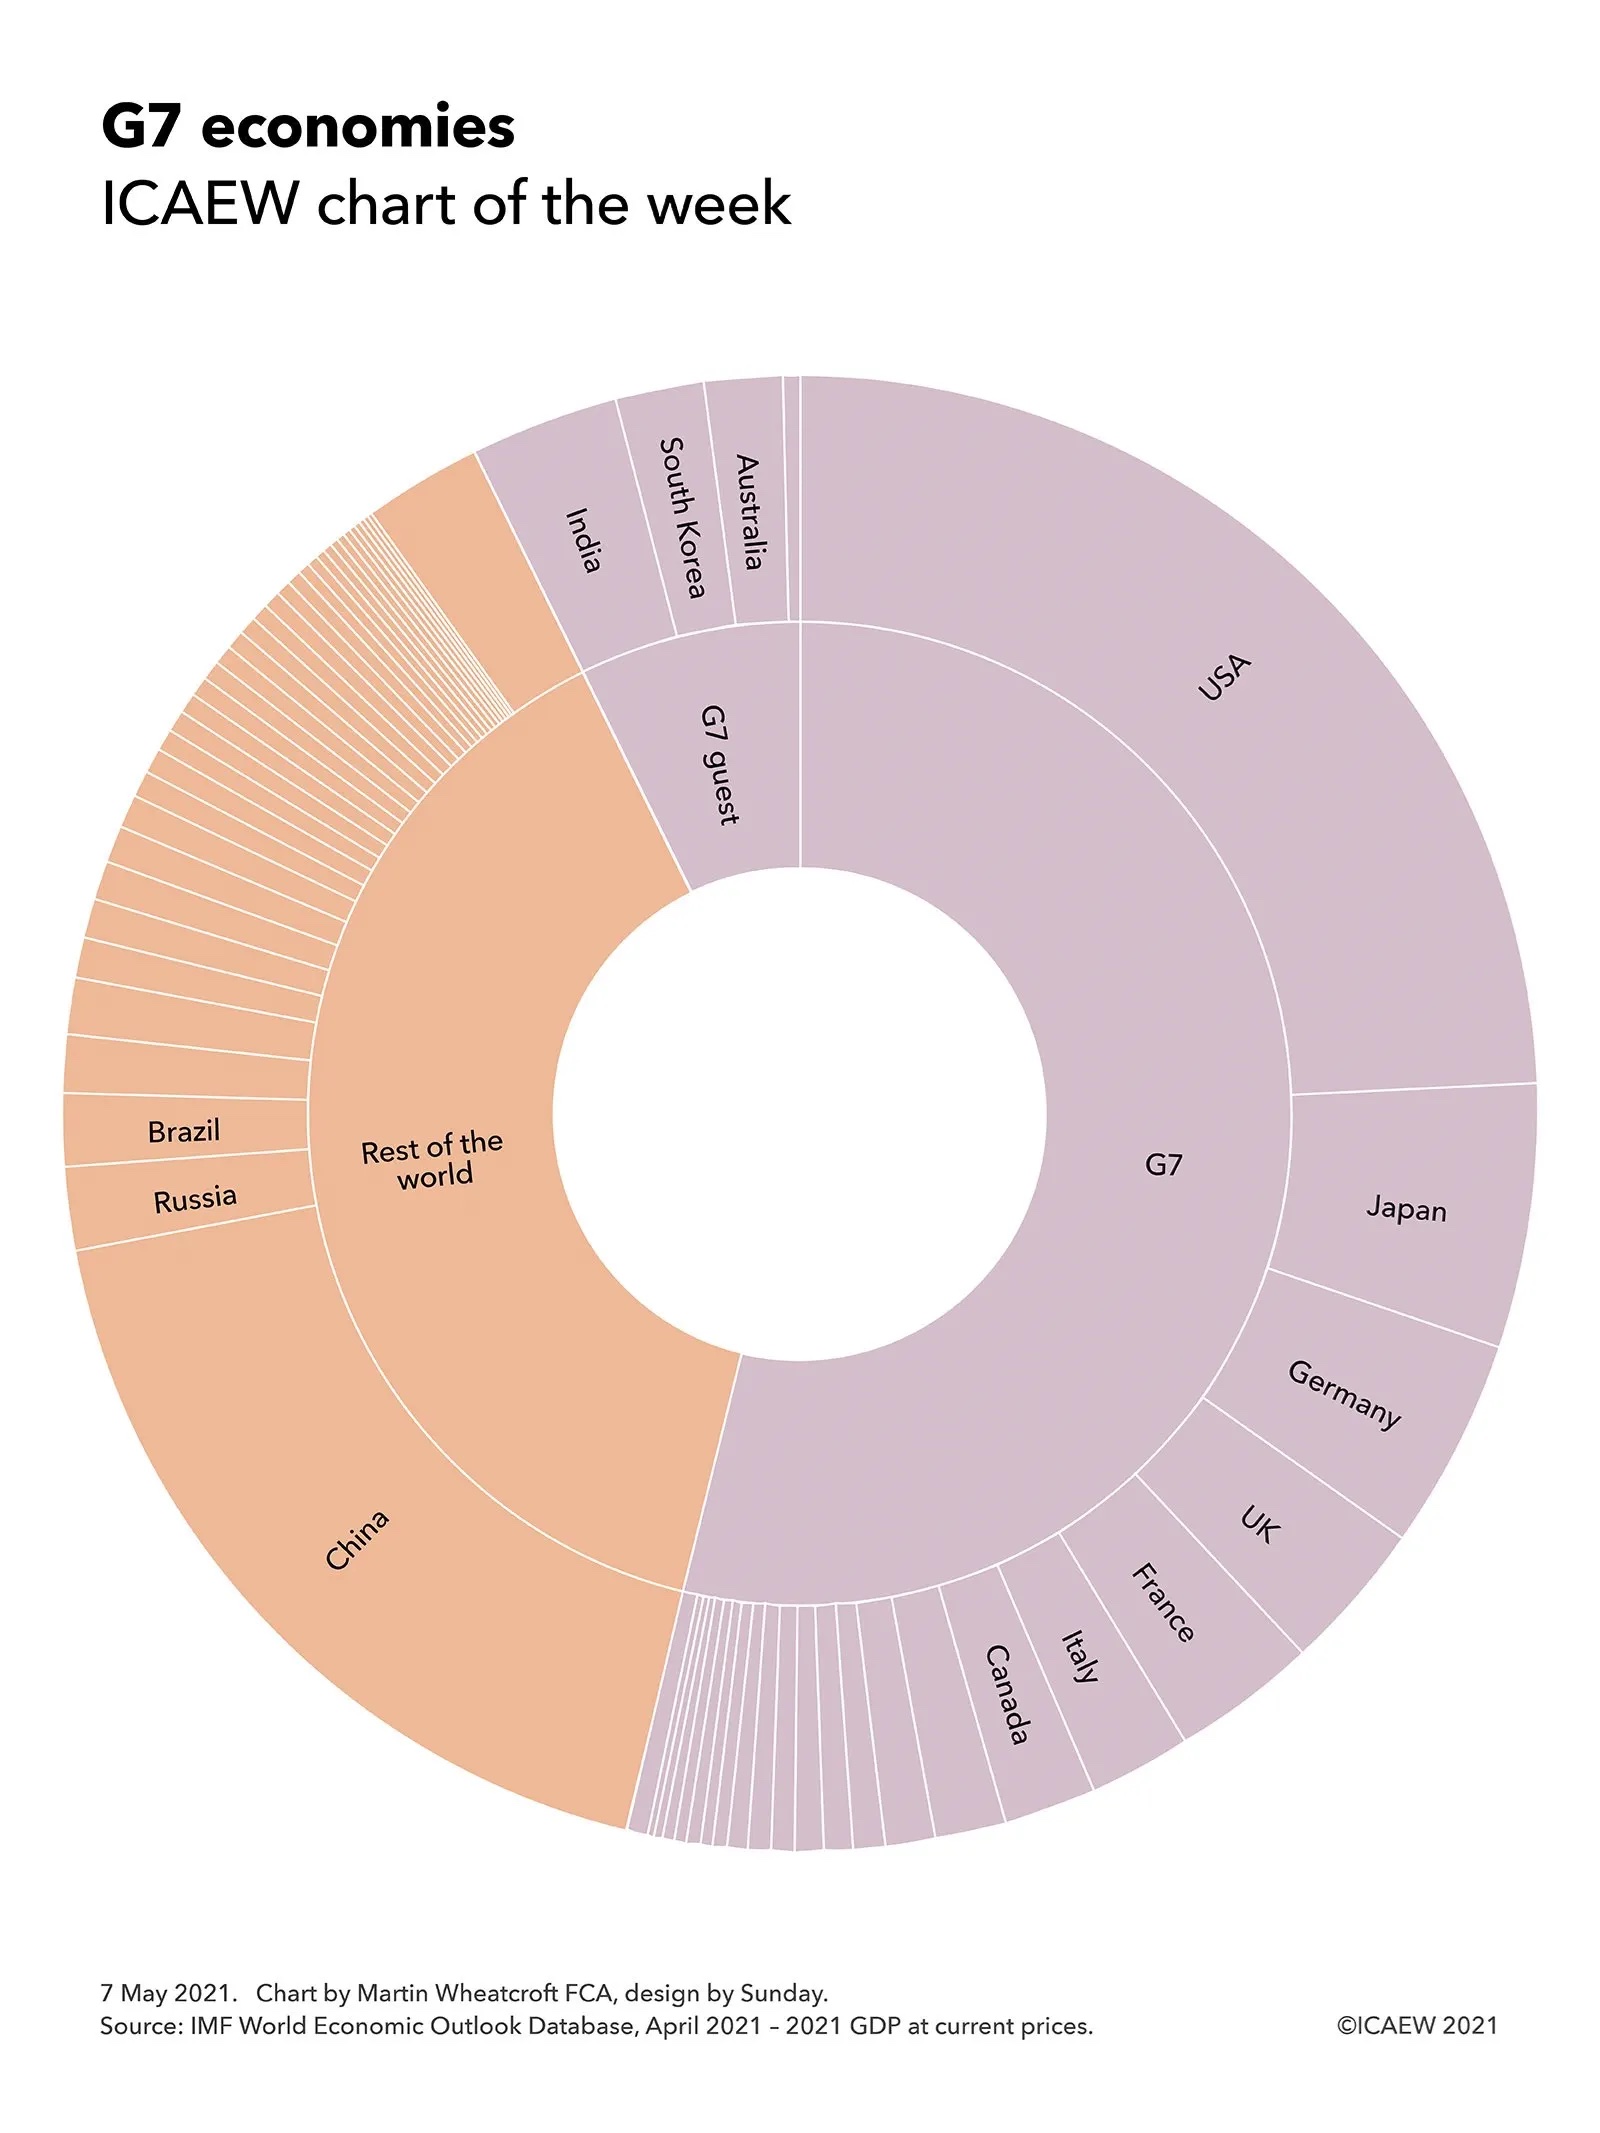
Overall, the G7 economies are forecast by the IMF to generate £35.9tn of economic activity in 2021 at current prices, 54% of forecast global GDP of £66.8tn. This comprises the economies of seven individual member nations: the USA (£16.3tn), Japan (£3.8tn), Germany (£3.1tn), the UK (£2.2tn), France (£2.1tn), Italy (£1.5tn) and Canada (£1.3tn), together with the 24 other EU member states (£5.6tn).
The guests invited to the 47th G7 summit in Cornwall are expected to generate a further £4.9tn or 7% of global GDP in 2021, bringing the total economic activity represented at the summit to £40.8tn or 61% of the total. They are India (£2.2tn), South Korea (£1.3tn), Australia (£1.2tn) and South Africa (£0.2tn).
Not represented at the G7 are China (£12.2tn), Russia (£1.2tn) and Brazil (£1.1tn) and around 160 other nations across the globe (£11.5tn in total).
The G7 summit presents an opportunity for the 11 national leaders and 2 EU representatives involved to shape the direction for much of the world, with discussions expected to range from saving the planet through to transparency in financial and non-financial reporting.