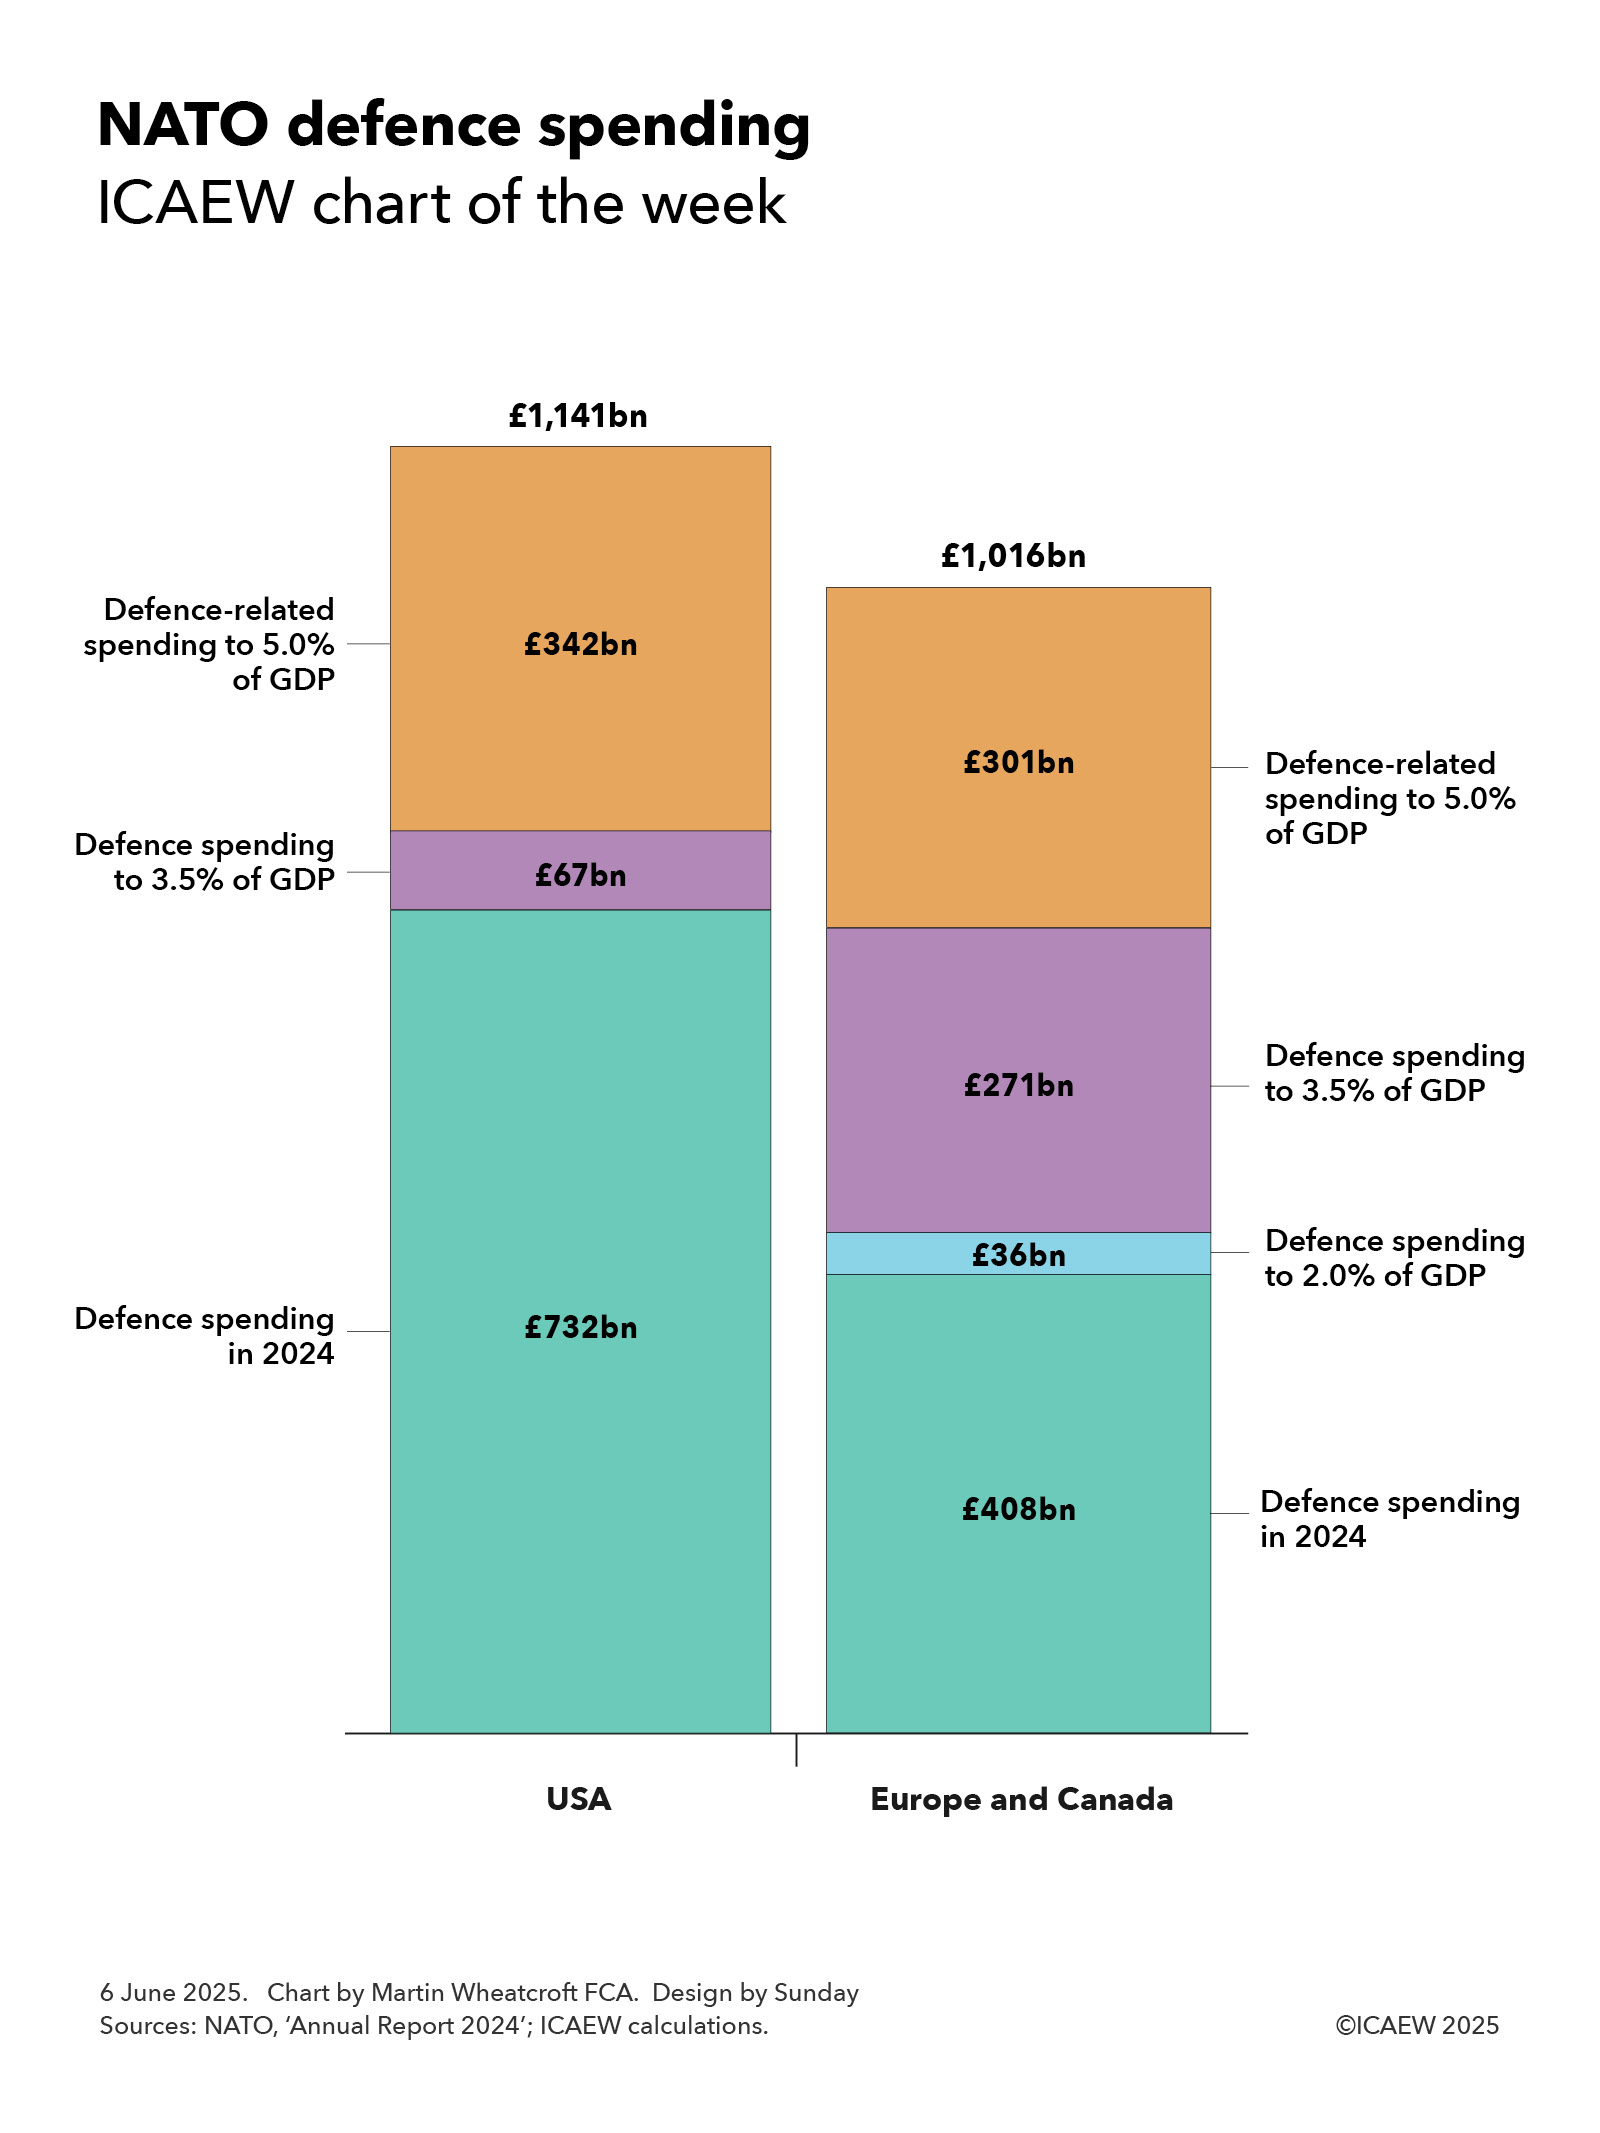
Our chart this week looks at how much NATO members would need to spend to meet President Trump’s proposed new target of 5% of GDP for defence and defence-related expenditure.
According to NATO, the US and other NATO members spent 3.2% and 2.0% of GDP respectively on defence and security in 2024, with 21 countries meeting NATO’s target of a minimum spend of 2.0%, 10 countries falling short and one (Iceland) for which the guideline does not apply.
Our chart this week illustrates how those 10 countries falling short would need to have spent an additional £36bn in 2024 to reach the 2% of GDP minimum, while the US and NATO Europe and Canada members (including Türkiye) would have needed to spend a further £67bn and £271bn respectively to reach President Trump’s proposed new minimum of 3.5% of GDP.
The chart also shows how the US and other NATO members would need to spend £342bn and £301bn respectively on defence-related expenditure to reach a headline percentage of 5% of GDP. The definition of this spending has yet to be clarified and so it is difficult to know how much of this will be incremental and how much will be met by existing expenditure on infrastructure, security, law enforcement and other public services.
The consequence of a 5% headline target would have been total defence and defence-related expenditure of £2,157bn in 2024 numbers, comprising £1,141bn of spending by the US and £1,016bn of spending by other NATO members.
The 10 countries that would need to have spent more to meet the existing 2% NATO minimum in 2024 are Spain (£10bn), Canada (£9bn), Italy (£9bn), Belgium (£4bn), Netherlands (£2bn), Portugal (£1bn), Slovenia (£0.4bn), Luxembourg (£0.3bn), Croatia (£0.1bn) and Montenegro (£18m).
To reach a 3.5% defence expenditure target would require a substantial expansion in defence budgets with defence expenditure in the US going up by £67bn, Germany by £51bn, France by £37bn, the UK by £33bn, Italy by a further £28bn, Canada by a further £26bn, Türkiye by £15bn, Netherlands by a further £14bn, and Belgium by a further £8bn, with most other countries needing to increase their defence budget, too.
The sole exception is Poland, which already spends more than 3.5% of GDP on defence (4.1% in 2024), while Estonia (3.4%), Latvia (3.4%), Lithuania (3.1%) and Greece (3.0%) each have much less far to go to reach a 3.5% of GDP target than most other NATO members.
According to NATO, the UK spent £66bn or 2.3% of GDP on defence and security in 2024, but this includes expenditure on the security services, counter-terrorism policing and war pensions in addition to ‘pure’ defence expenditure of £57bn or 2.0% of GDP. Whether, and to what extent, these extra elements will end up being reclassified from defence to defence-related expenditure is unclear, but if all of it was then that would add £9bn to the £33bn a year that the UK would need to find to meet a 3.5% defence expenditure target.
The key question will be how long NATO members are given to meet their new targets. The 2.0% minimum guideline was set in 2014 and provided 10 years for members to reach their new targets. Even then, not all of them achieved it.
It is likely to take years to recruit and train significant numbers of new soldiers, sailors and aircrew and procure major items of equipment such as tanks, ships, submarines and aircraft that would be commensurate with such a new target, so even if the money was available immediately (which it won’t be in most cases) most NATO members are likely to resist calls by the US to adopt a new target with effect from 2026.
Whatever happens, it is clear that most NATO members, including the UK, are going to need to increase spending on defence significantly over the next few years – and at a much faster pace than most of them have budgeted for.
Tax rises and more borrowing are therefore likely to be on the agenda in many more countries than the UK alone.