Will there be a rush to spend the £7,000 in household net cash savings built up over the course of the pandemic?
The #icaewchartoftheweek is on household savings built up over the course of the pandemic, illustrating how households have saved an average of £7,000 over the last fourteen months. A big question for the economic recovery is whether households will splash the cash once restrictions are lifted, providing a consumer-led boost to the economic recovery?
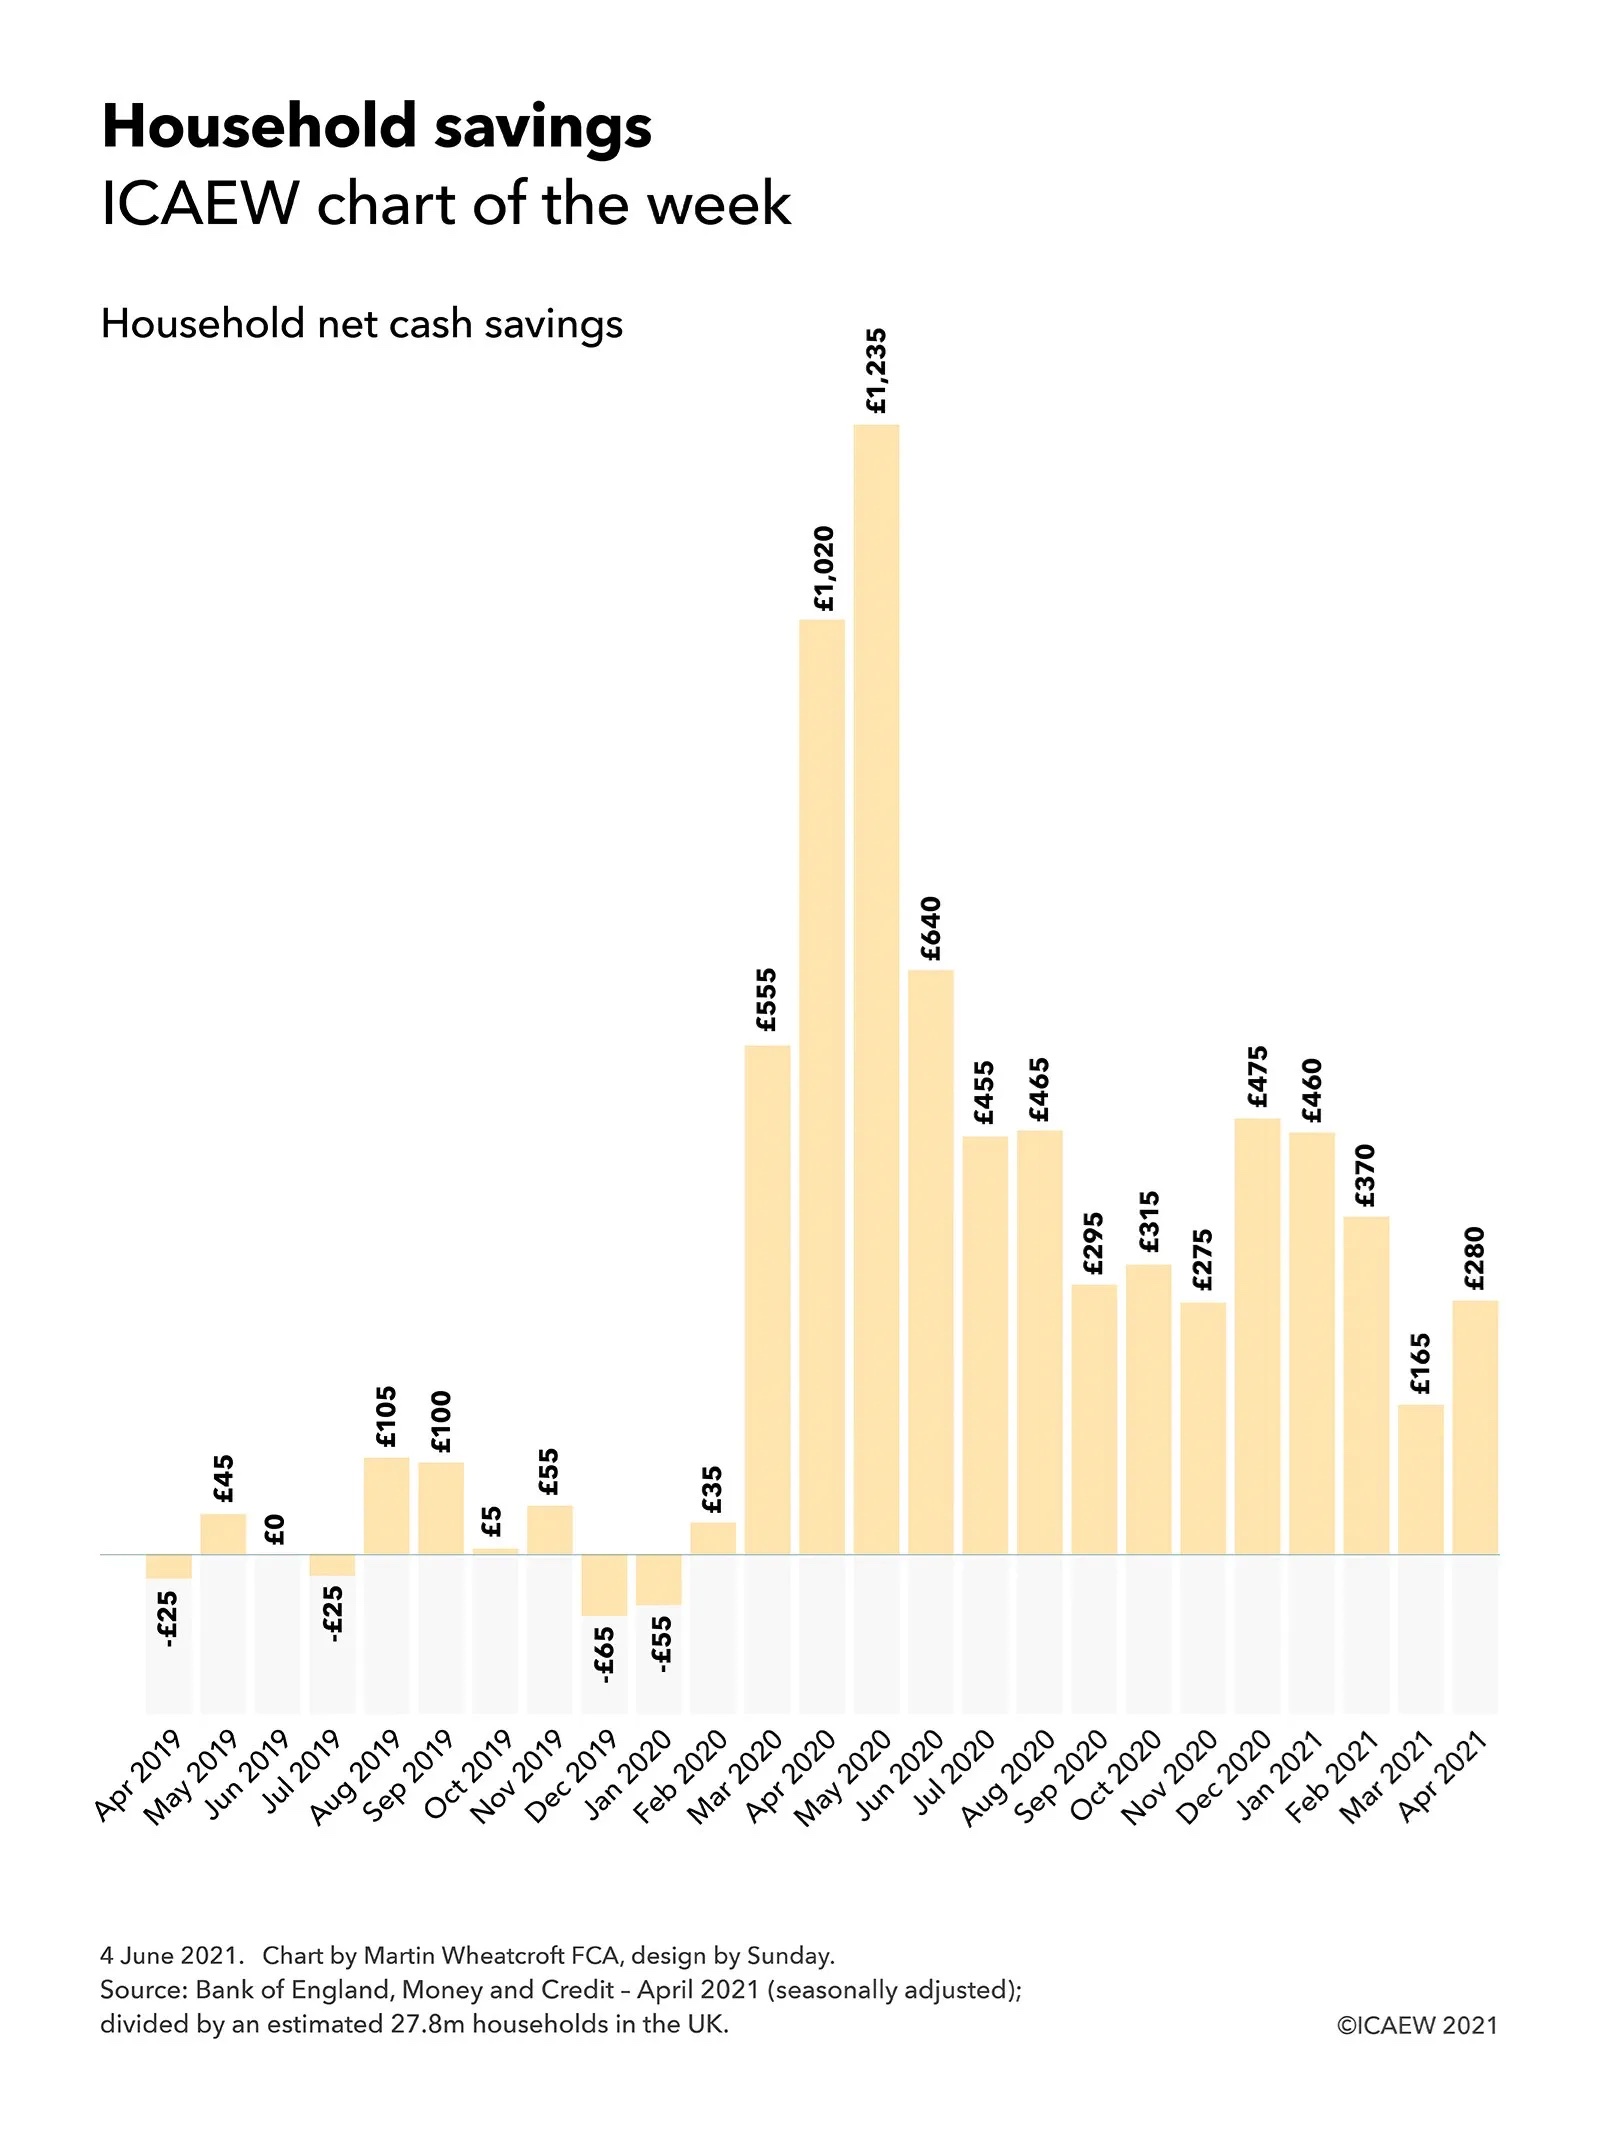
According to Bank of England statistics released on 2 June 2021, since the start of the pandemic in March 2020 up to April 2021 households have saved or repaid debts in the order of £195bn or an average of £14bn a month. This compares with £4.8bn or £0.4bn a month in the 11 months to February 2020, when cash savings were mostly offset by borrowing on consumer credit or mortgages.
With approximately 27.8m households in the UK according to the Office for National Statistics, this means that families have saved an average of just over £7,000 or £500 per month since the first lockdown in March 2020, compared with approximately £175 or £15 a month in the eleven months prior to the pandemic.
This reflects many lost opportunities for spending, with fewer holidays and nights out possible because of lockdown restrictions. Uncertainty about future economic prospects is likely to have also played a part, with many individuals cutting back on discretionary spending ‘just in case’.
Of course, there is no such thing as an average household. More prosperous families will have saved up a lot more than the £7,000 average and so are likely to have the capacity to spend a lot more if they want to, while many individuals will have run down savings or borrowed to survive through a difficult period.
For those fortunate families who are in a better financial situation, the big economic question is whether they will take the money they have saved from not going on holiday or going out over the course of the last year and put it into their pensions or other forms of investment – or will they choose to splurge on enjoying themselves once restrictions are fully lifted?
The (almost) £200bn question.
This chart was originally published by ICAEW.
Source detail
Source data from Bank of England, Money and Credit – April 2021 (published 2 June 2021) divided by an estimated 27.8m households in the UK per the Office for National Statistics.
Household net cash savings = Seasonally adjusted changes in household M4 bank and building deposits plus changes in National Savings & Investments holdings (together ‘cash savings’), less seasonally adjusted changes in consumer credit and less seasonally adjusted changes in mortgage debt.
Total for 11 months to Feb 2020: cash savings £62.6bn less increases in consumer credit £11.5bn less increase in mortgage debt £46.3bn = £4.8bn or £175 per household.
Total for 14 months to April 2021: cash savings £235.2bn plus net repayments of consumer credit £23.1bn less increase in mortgage debt £63.5bn = £194.8bn or £7,005 per household.