My chart this week looks at how deaths in the UK are expected to exceed births within just a couple of years – a major change in our demographic story.
The big drivers of population change in the UK (and in many other developed countries) have been a declining birth rate and more people living longer, resulting in a growing population even before taking account of net inward migration.
However, that growth is starting to slow as the birth rate has declined as a proportion of the overall population – absent migration, it is expected to start to go into reverse as the death rate rises, driven by the bulge in the population constituted by the ‘baby boomer’ generation reaching their 60s and 70s.
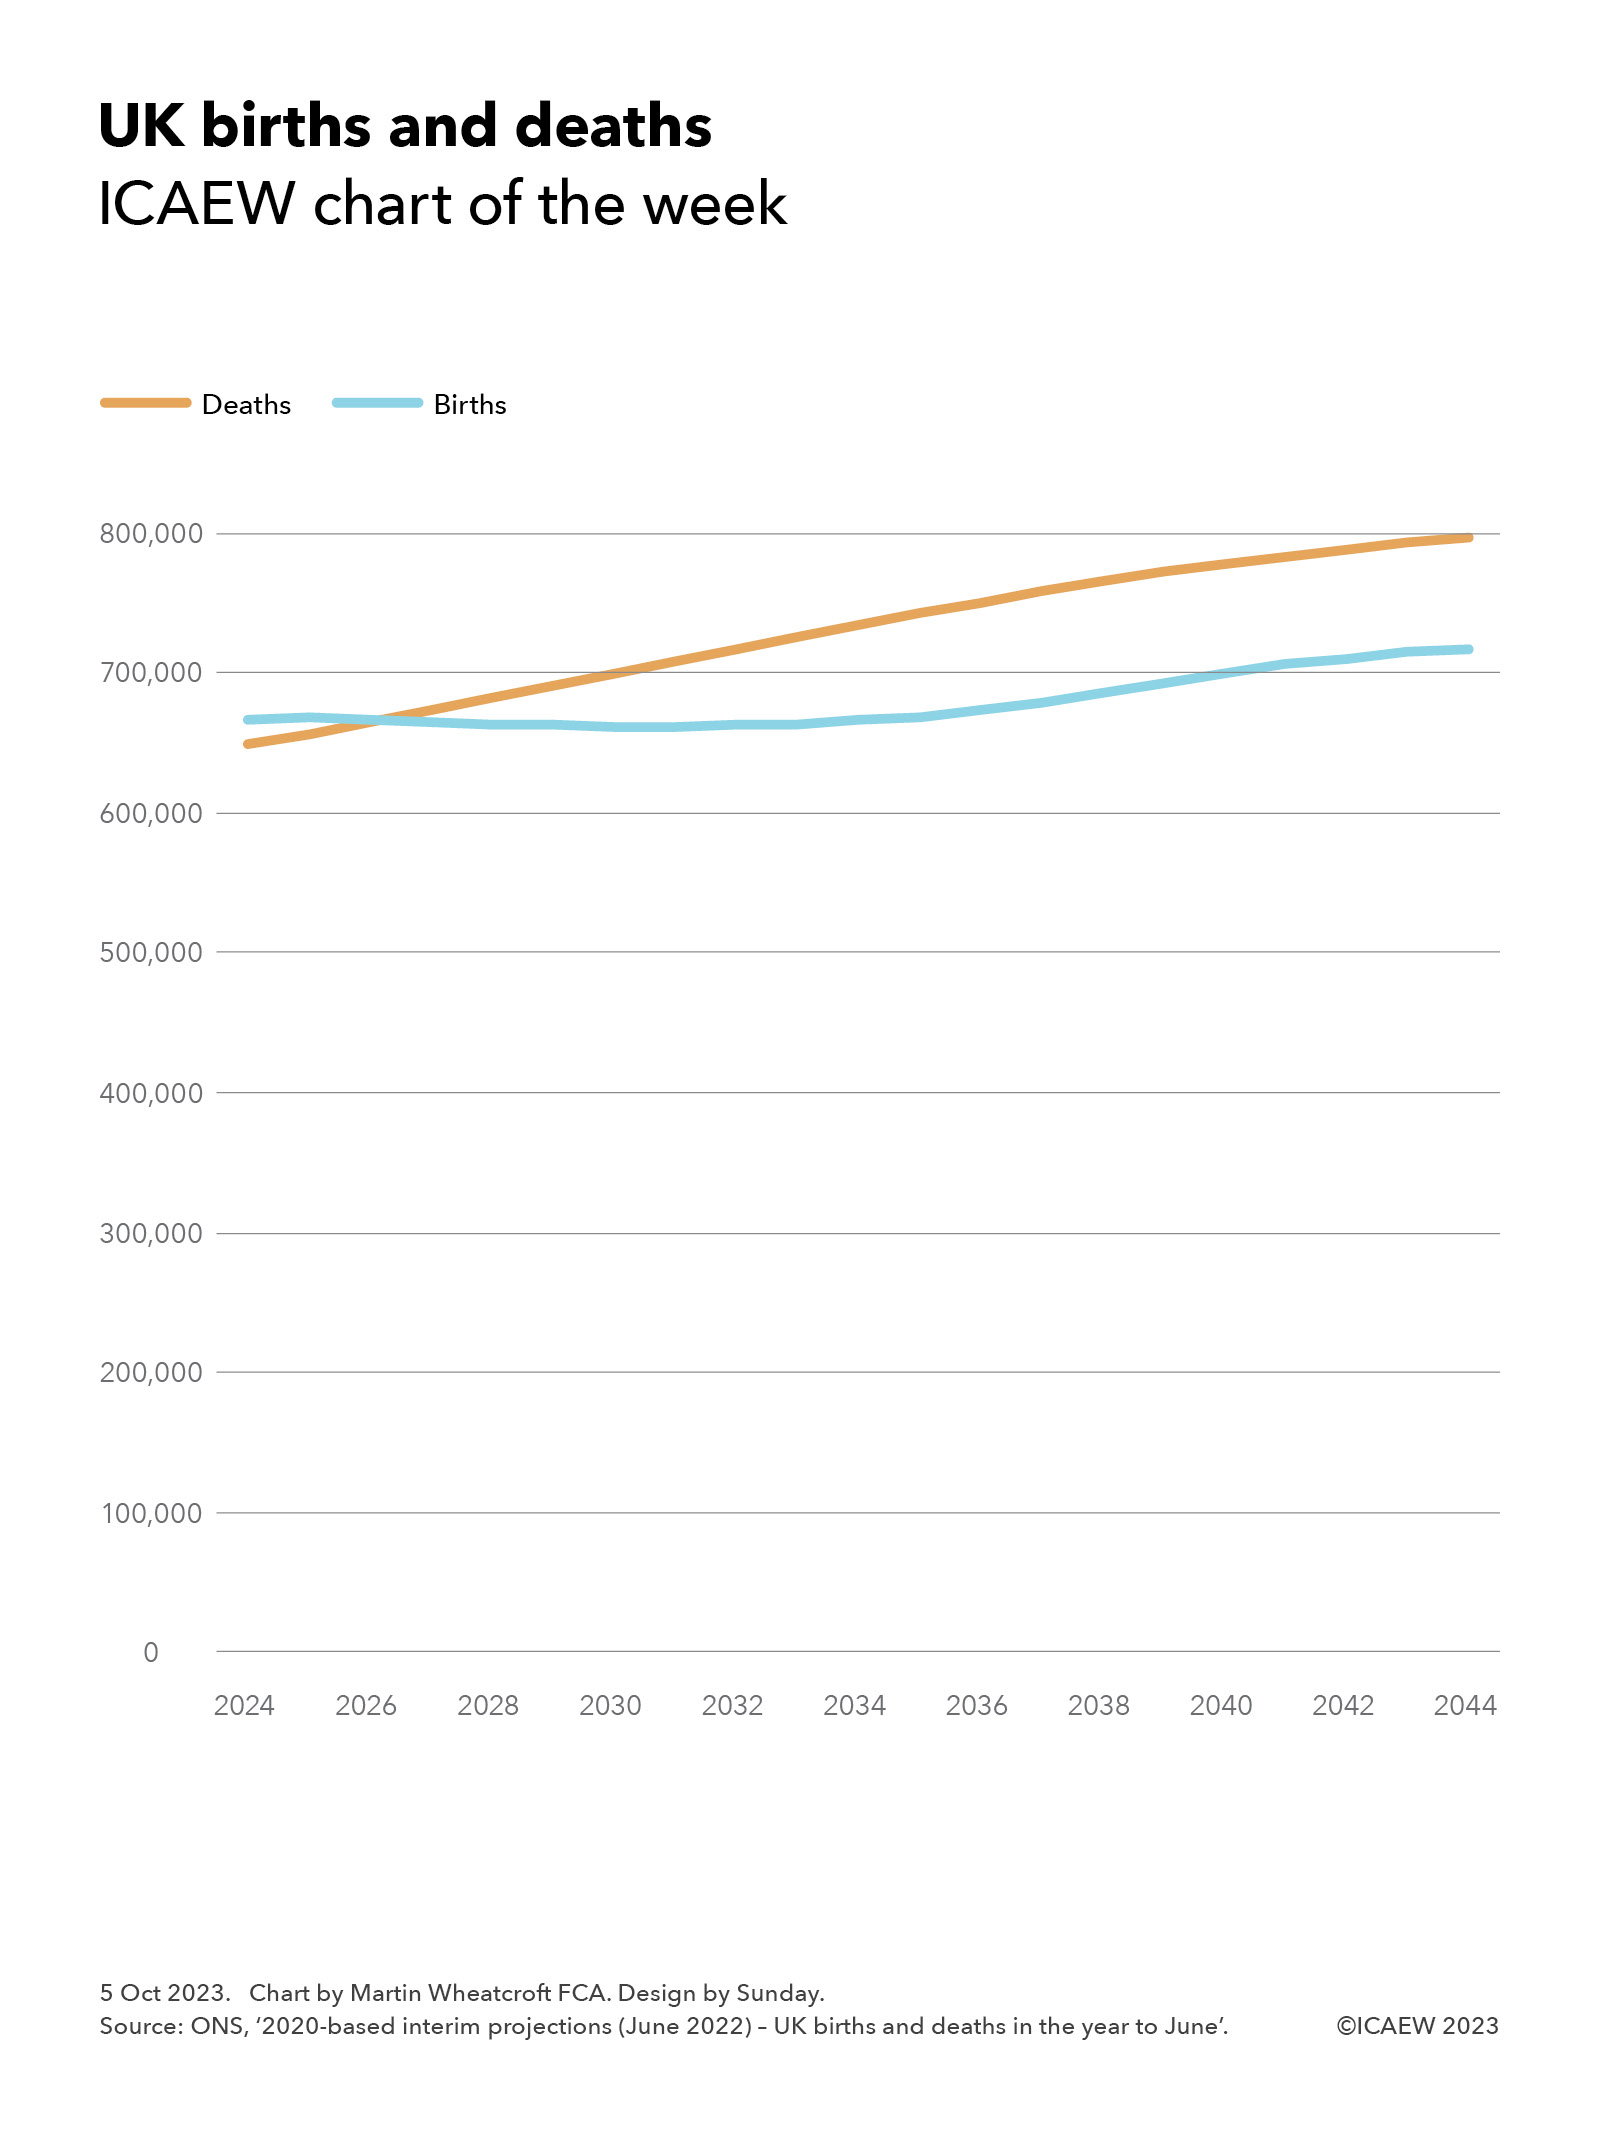
As illustrated by my chart this week, the number of births is expected to fall slightly over the next few years (from 667,000 in the year to June 2024 and 668,000 in the year to June 2024 to 662,000 in the year to June 2031) before gradually rising to 718,000 in the year to June 2044. At the same time deaths are expected to rise throughout the period, from 650,000 in the year to June 2024 to 797,000 in the year to June 2044.
The projection is for births of 667,000 and deaths of 665,000 in the year to June 2026, a small net increase of 2,000, before reversing after that to reach 80,000 more deaths than births in the year to June 2044.
The population is still expected to grow, despite this shift from (to use the statistical terminology) ‘natural’ growth in the population (births exceeding deaths) to ‘natural’ contraction (deaths exceeding births). This is because the ONS has assumed net inward migration will continue at an average of 245,000 a year for most of the projection period, resulting in a projected growth in the population of 4.0m people or 6% (from 68.1m to 72.1m) over the next 20 years, in contrast with the 8.4m or 14% increase in the UK’s population over the past two decades.
Without inward migration, the likelihood is that the gap between deaths and births would be even larger than illustrated in our chart, given that a proportion of the children expected to be born will be the children of migrants.
This change in the demographics of the UK will have significant implications for the debate about migration over the coming decades, especially if the population absent migration is shrinking by 80,000 a year by 2044 as projected by the ONS.
There are also implications for the public finances as, even with net inward migration, population growth is expected to be less than 0.3% a year over the next two decades instead of the 0.7% a year seen over the past 20 years. Not only will that reduce the potential for economic growth, but it will reduce the opportunities for efficiencies of scale in public spending that have been possible in previous decades.
The demographic tale of the 20th century in the UK was one of a rapidly growing population as many more children survived into adulthood, life expectancy increased significantly and migration offset a declining birth rate. The 21st century looks like being a very different story.