My chart this week looks at how price rises have accelerated over the last few months, with consumer price inflation reaching 4.2% in October, the highest it has been for a decade.
The Office for National Statistics published its latest estimates for inflation on Wednesday 17 November, reporting a 12-month increase in the Consumer Prices Index (CPI) of 4.2% and a 12-month increase in the Consumer Prices Index including owner occupiers’ house costs (CPIH) of 3.8%, both of which are the highest they have been since November 2011 when CPI was 4.8% and CPIH was 4.1%.
CPI and CPIH are calculated using a basket of goods and services to assess the level of inflation experienced by consumers, with the current index set to 100 in July 2015.
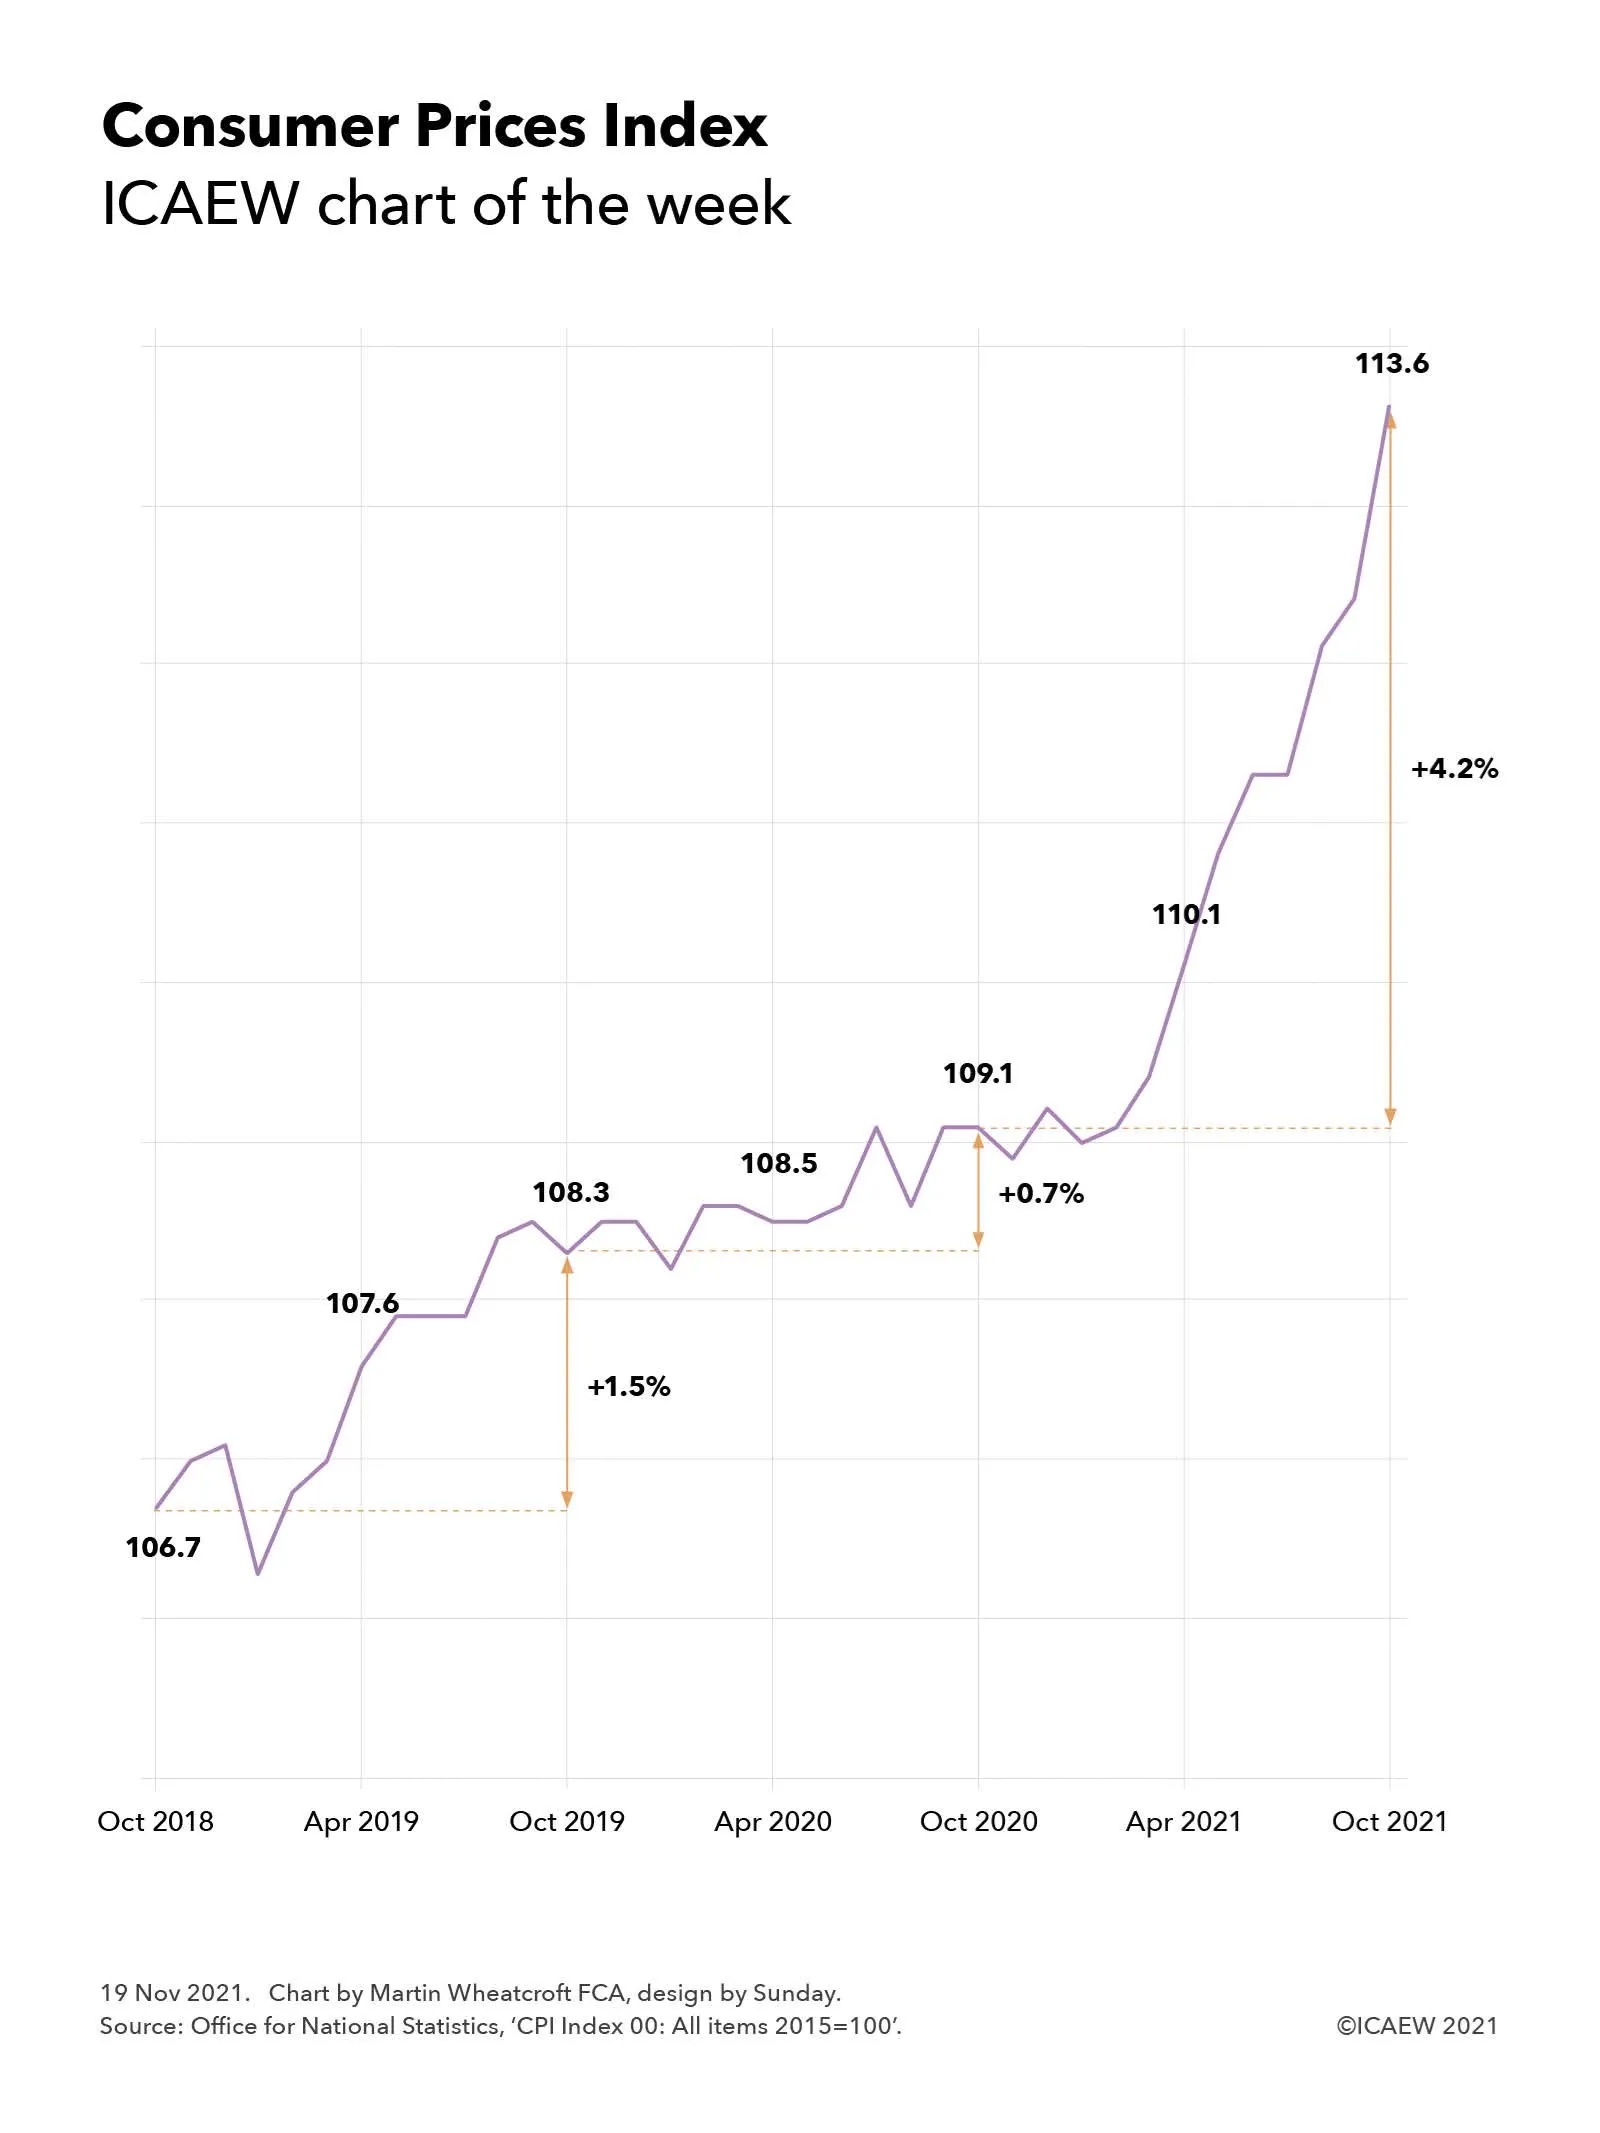
The ICAEW chart of the week shows how CPI fell before increasing from 106.7 in October 2018 to 107.6 in April 2019 and 108.3 in October 2019, an annual increase of 1.5% that was within the 1% to 3% Bank of England target range. This was followed by smaller increases to 108.3 in April 2020 and 109.1 in October 2020, a 0.7% annual increase in CPI driven in part by the pandemic. The index hovered around that level for several months until starting to increase more rapidly from March onwards as the economy started to re-open, reaching 110.1 in April 2021 and continuing to increase sharply to 113.6 in October 2021, an annual increase of 4.2%.
The Governor of the Bank of England is required to write to the Chancellor of the Bank of England whenever inflation is more than 1% above or below the 2% target and he did so on 23 September when inflation reached 3.2% and he will again now that it has reached 4.2%. Part of the explanation he has given and will give are ‘base effects’, where price discounting during 2020 at the height of the first and second waves of the pandemic suppressed some of the inflation that is being experienced now.
Further letters are likely over the next few months as even if prices don’t rise any further, given how the index bounced around the 109 level between September and March 2021. This means inflation should continue to stay substantially above 3% for the next four months or so unless prices were to fall again, which is unlikely given how global commodities and supply constraints continue to feed into rising domestic prices. A 12-month CPI-inflation rate of 5% appears more than likely at some point in the next few months.
The Bank of England’s Monetary Policy Committee (MPC) isn’t panicking at this stage given that the annualised rate of inflation over the last three years (comparing October 2021 with October 2018) is an almost on-target 2.1% and their expectation that inflation rate will come down once the flat inflationary period of a year ago starts to drop out of the comparison. However, they are sufficiently concerned about the steep slope in the CPI in the last few months to signal that interest rates may need to rise if prices continue to increase at the pace seen in recent months.
The MPC’s original plan was to hang tight through what they hoped would be a short inflationary spurt as the economy emerges from the pandemic. In the event it looks like they won’t be able to hold that line, with higher interest rates a distinct possibility in the coming months.