Our chart this week shines a spotlight on the UK’s public debt, focusing on the Government’s debt strategy ahead of the fast approaching Spending Review.
A big worry for the Chancellor of the Exchequer in putting together the Budget and Spending Review this month is the possibility that higher inflation and interest rate rises will hit the public finances, restricting the amounts he has available to meet his policy objectives. Our chart this week illustrates just how exposed the UK’s public debt is to changes in inflation and interest rates.
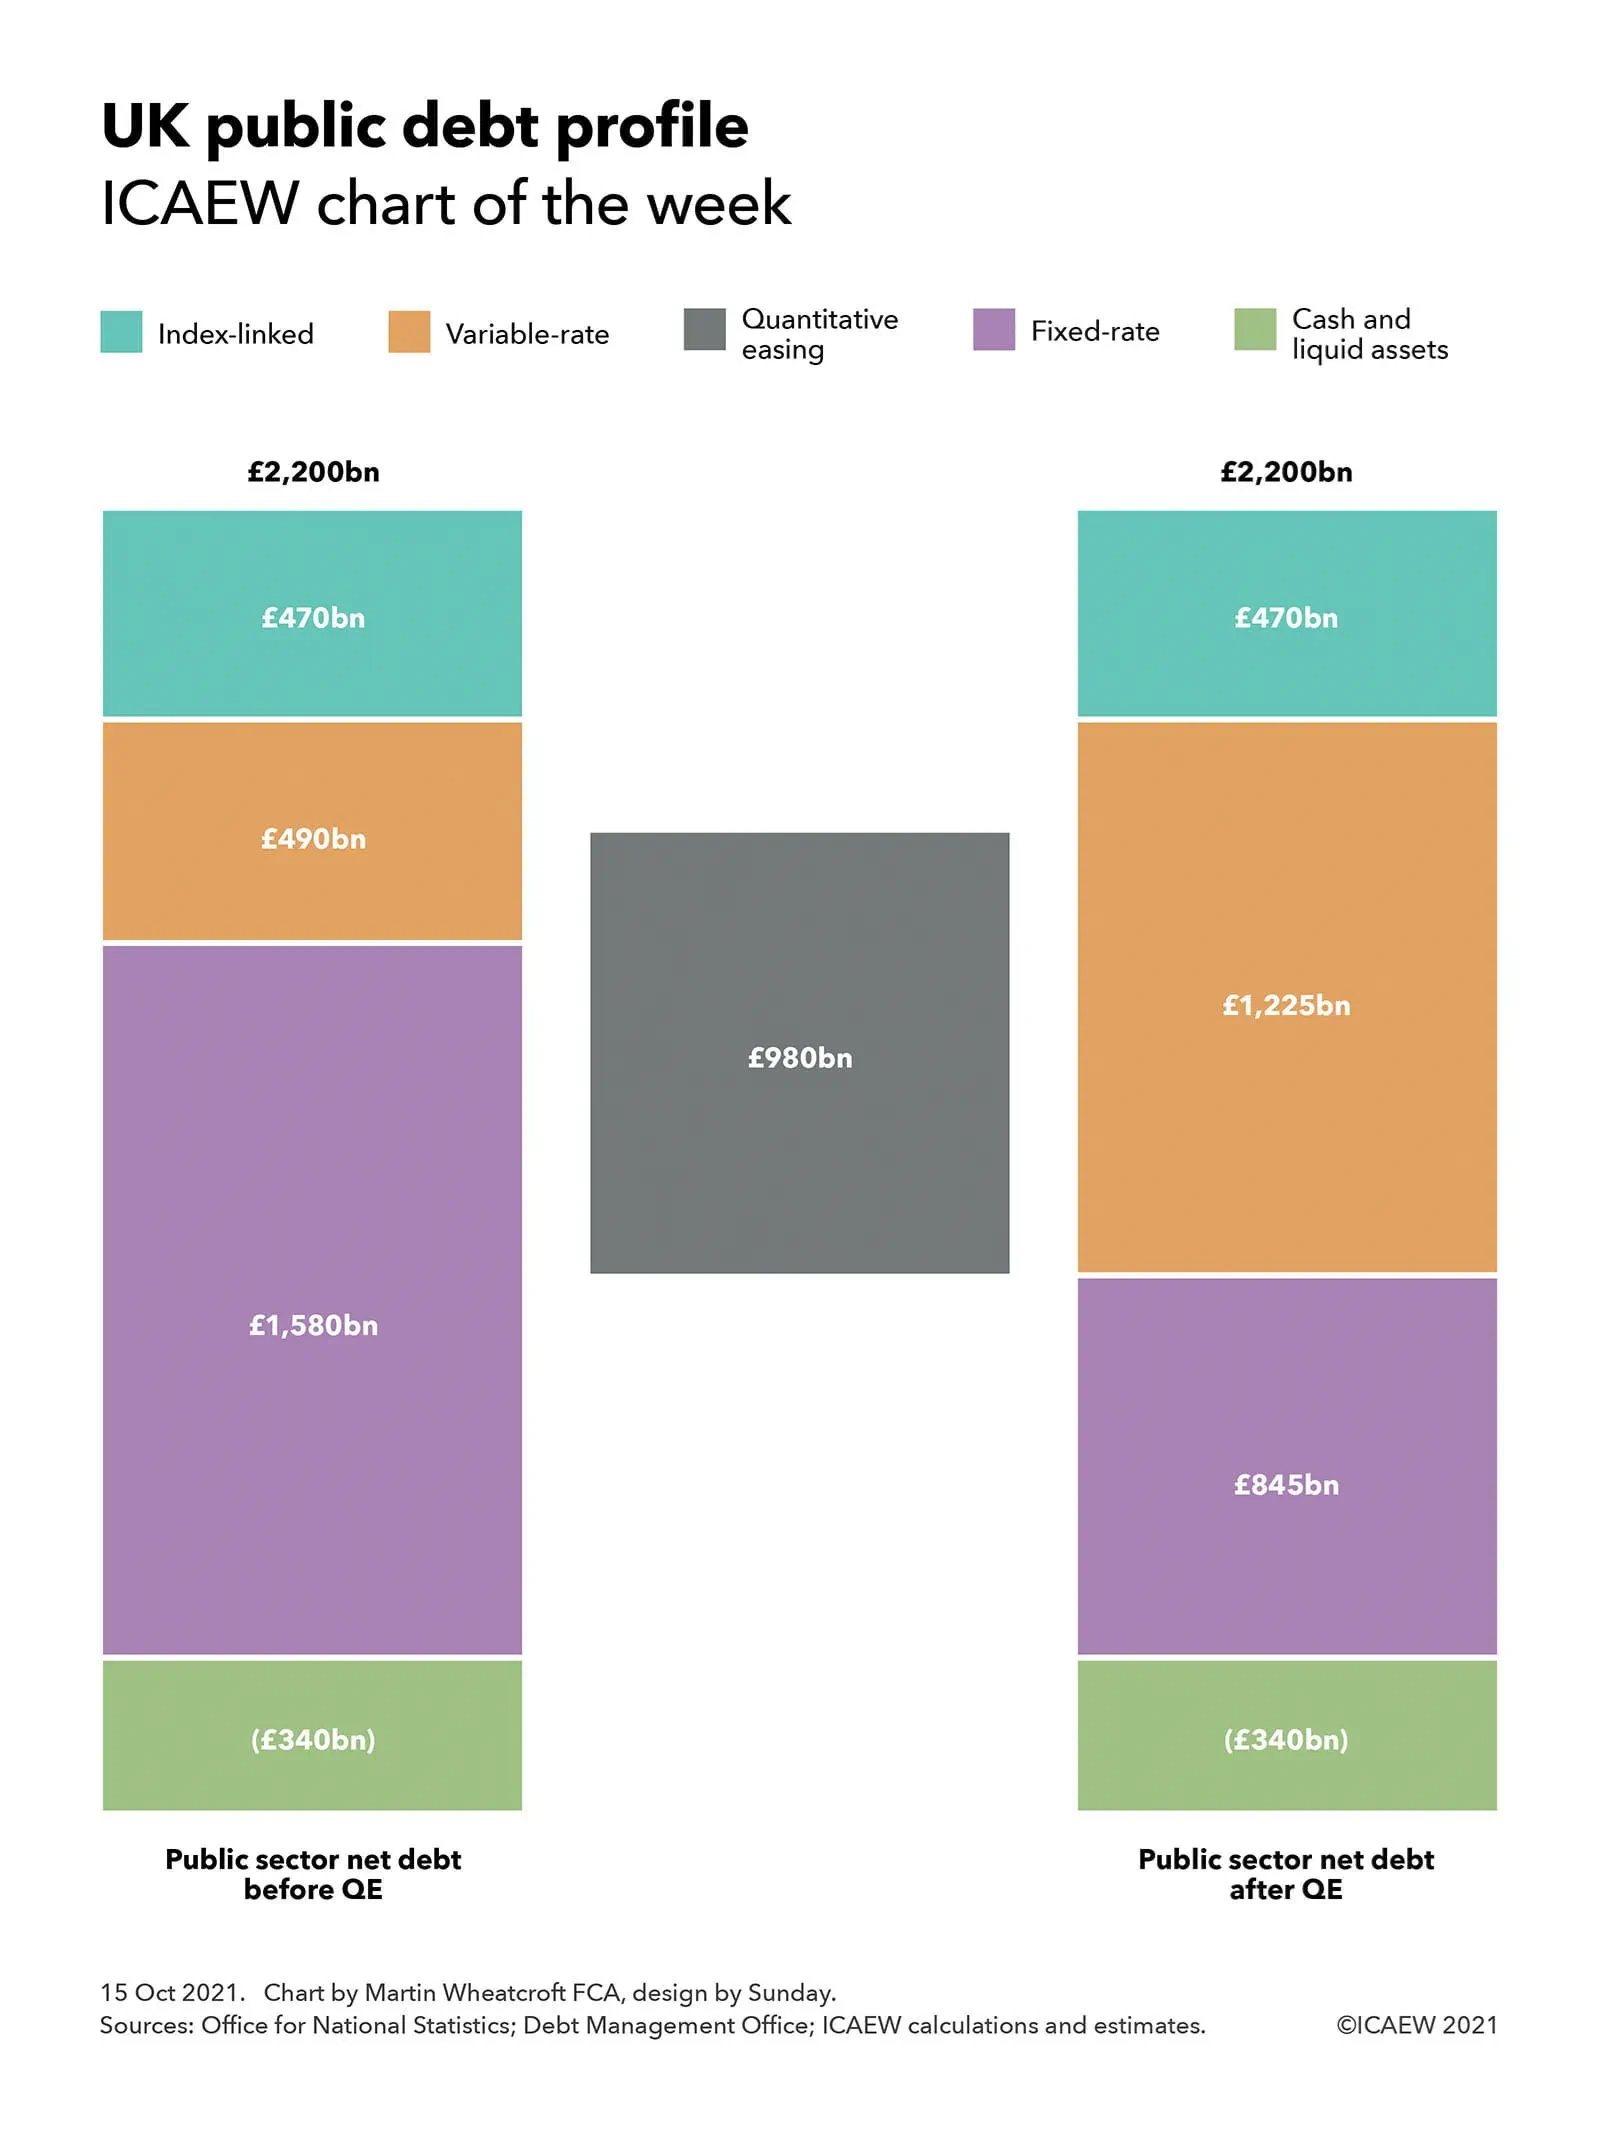
UK public sector net debt was marginally over £2.2tn at the end of August 2021, comprising in the order of £2,540bn in gross debt less £340bn in cash and liquid assets. As ICAEW’s chart of the week illustrates using approximate numbers, this can be broadly divided into fixed-rate, variable-rate and index-linked debt, reflecting the Government’s debt strategy as executed by the UK Debt Management Office and by National Savings & Investments.
What the chart highlights is how quantitative easing (QE) has changed the profile of UK public debt significantly. This tool has been used by the operationally independent Bank of England to ease monetary policy by pumping money into the economy in response to the financial crisis a decade ago and the coronavirus pandemic more recently, but has the effect of switching fixed-rate government securities into variable-rate central bank deposits, contributing to falling interest costs even as public sector net debt has risen from less than £0.5tn in 2007 before the financial crisis to £1.8tn in March 2020 before the pandemic and £2.2tn currently.
Fixed-rate debt of £1,580bn comprises approximately £1,490bn in government bonds or gilts repayable over periods generally ranging from five to 30 years, together with £75bn in other central and local government loans net of intra-government holdings (which we have assumed are mostly fixed-rate in nature) and up to £15bn in fixed-rate savings certificates sold to individual investors by National Savings & Investment.
Variable-rate debt of £490bn comprises around £185bn of variable-rate National Savings & Investments deposits and certificates, £60bn in short-term Treasury bills, and £245bn in Bank of England liabilities relating to QE (see below). The balance of £470bn is in the form of index-linked gilts, where the amounts owed increase in line with the retail prices index (RPI).
This is before deducting £340bn in cash and liquid assets, comprising around £150bn of official reserves (much of which is currency deposits with foreign central banks) and £115bn, £40bn and £35bn in bank, building society and other liquid financial asset holdings held by central government, local government and other parts of the public sector respectively.
In practice, the sterling work of the UK Debt Management Office (DMO) to create a balanced portfolio of public debt has been upended by the Bank of England’s Monetary Policy Committee, albeit with the agreement of successive Chancellors. The spread of inflation-, variable- and fixed-rate exposure combined with extended maturities to manage refinancing requirements over longer periods has been offset by £980bn of QE purchases and lending that has replaced £735bn (or around half) of the fixed-rate gilts in issue at nominal value with central bank deposits that pay interest at the Bank of England base rate – reducing the net fixed rate exposure to £845bn. This is in addition to the QE-related liabilities of £245bn already included in variable-rate debt, of which £110bn was used to finance Term Funding Scheme low-cost business loans, £20bn to fund corporate bond purchases, and £115bn to finance premiums on gilt purchases (in effect prepaying some of the interest that would have gone to external investors over time if the gilts had not been purchased by the Bank of England).
The consequence is a public debt portfolio that is currently being financed much more cheaply than anyone ever expected, but which is much more sensitive to changes in inflation and interest rates than was ever planned.
With inflation now expected to rise to in the order of 5% (or even higher) over the next few months, and suggestions that the Bank of England may start to increase the base rate in early 2022, the gains the public finances have experienced from ultra-low borrowing costs look as if they will start to go into reverse. This is likely to put additional pressure onto the public finances at a time of elevated economic uncertainty, making for even tougher choices for the Chancellor on both tax and spending in the Spending Review and Autumn Budget in a couple of weeks’ time.