ICAEW chart of the week: Prime Minister’s salary

My chart for ICAEW this week illustrates how PM Keir Starmer’s £172,153 official salary entitlement would have been £305,770 if prime ministerial pay had kept pace with inflation since 2009.

Column chart showing the Prime Minister's actual salary, official salary and official salary extrapolated in line with inflation on 1 April between 2009 and 2024. See text for numbers. 

26 Sep 2024. Chart by Martin Wheatcroft FCA. Design by Sunday. Sources: House of Commons research briefings; ICAEW calculations. (c) ICAEW 2024.

Prime ministerial pay has been in the news quite a lot in recent weeks for a range of reasons, leading our chart of the week to look at how the prime minister’s salary has evolved over the last 15 years.

As the chart illustrates, former PM Gordon Brown was entitled to a salary of £197,689 and had an actual salary of £193,885 on 1 April 2009, significantly higher than today’s current official salary of £172,153 or the actual salary of £166,786 taken by current PM Keir Starmer. This is despite cumulative inflation of 55% (3.0% a year on average) or an increase in MP base pay of 41% (2.3% a year) over the past 15 years.

The reasons for these reductions in prime ministerial salary are primarily the result of a voluntary pay cut to £150,000 taken by Gordon Brown in the run up to the May 2010 election, and a further cut of 5% to £142,500 adopted by incoming PM David Cameron. 

Cameron maintained his pay at this level for the duration of his first term in office, converting his voluntary decision into a permanent change in 2012 (backdated to 2011) in how much he and his successors have been entitled to receive. The chart shows how Cameron accepted a pay rise following the 2015 general election, taking him from a salary of £142,500 on 1 April 2012 out of an official entitlement of £142,545 to £150,402 on 1 April 2016 out of £152,532.

Subsequent prime ministers have also exercised pay restraint by restricting increases in ministerial pay, or in not taking all of the increases to which they were entitled. As a consequence, Theresa May concluded her period as prime minister in 2019 on a salary of £154,908 out of an official salary of £158,754, while Boris Johnson and Liz Truss were on annual salaries of £159,584 in 2022, short of their full entitlement of £164,951.

Rishi Sunak concluded his period as prime minister on an official salary of £172,153 from 1 April 2024 onwards, being the amount to which Sir Keir Starmer is entitled to claim if he wanted. However, the politics of accepting pay rises is difficult – perhaps now more than ever – and so Keir Starmer has stuck with the £166,786 actual salary that his predecessor was on before the 2024 general election.

Our chart illustrates how the prime minister’s official salary has eroded in value over the last 15 years by calculating how it would have risen to £219,800 on 1 April 2012, £232,000 on 1 April 2016, £247,720 on 1 April 2019, £266,020 on 1 April 2022 and £305,770 this year if it had increased in line consumer price inflation instead. 

There are arguments for using other indexes for this comparison, such as public sector pay, which if used would have led to an official salary of £299,060 on 1 April 2024 ; average GDP per capita, perhaps a better measure of national economic performance, would have resulted in an official salary of £301,530. Linking to overall average pay would have led to an official salary of £311,990 today, while maintaining its value in comparison with pay in the private sector would have delivered a potential pay packet for the PM of £334,360.

The requirement for successive prime ministers to approve their own pay has led to the opposite of what you might think would happen. Instead of raising their salary ever higher because they have the power to do so, political choices and pressures have led them instead to cut or freeze their pay at different points over the last 15 years, resulting in a significant erosion in prime ministerial pay in that time.

These choices have led to the UK paying its head of government substantially less than comparable leaders such as Australian PM Anthony Albanese’s annual salary of A$607,500 (£311,500), German Chancellor Olaf Scholz’s €348,300 (£290,250) or Canadian PM Justin Trudeau’s C$408,200 (£226,800). 

Ironically, it might be the prime minister (and his successors) who could benefit most of all of our public servants by taking the power to set his own pay away and giving it to an independent pay review body instead.

This chart was originally published by ICAEW.

Government enters crisis control mode to curb public spending

Boost from self assessment tax receipts not enough to prevent a deficit in July as Chancellor searches for cost savings in the run up to the Autumn Budget.

The monthly public sector finances for July 2024 released by the Office for National Statistics (ONS) on Wednesday reported a provisional deficit for the first four months of the 2024/25 financial year of £51.4bn, £4.7bn worse than budgeted.

Alison Ring OBE FCA, ICAEW Director of Public Sector and Taxation, says: “Today’s data shows that the customary boost from self assessed tax receipts in July was not enough to prevent a deficit of £3.1bn, higher than budgeted, as cost pressures drove up public spending. Debt increased to £2,746bn or 99.4% of GDP at the end of July, up £5.9bn from the end of June 2024.

“The government is now in crisis control mode as it searches for savings to offset significant unbudgeted cost overruns in this financial year, with the cumulative deficit to July 2024 standing at £51.4bn, £4.7bn more than budgeted.

“Rumours that the government is looking at significant cuts in public investment programmes this year to keep within budget are concerning, given the importance to economic growth of infrastructure and the urgent need for upfront investment in technology to fix poorly performing public services. Our hope is that the Chancellor will be able to take a more strategic view in her Autumn Budget in October and in the Spending Review in the spring.”

Month of July 2024

There was a shortfall between receipts and spending of £3.1bn in the month of July 2024, £1.8bn higher than in July 2023 and £3.0bn worse than the budgeted deficit of £0.1bn.

Taxes and other receipts amounted to £99.4bn in July 2024, up £10.3bn or 12% from the previous month driven by self assessment income tax receipts in July, in line with the trend last year. Receipts were £2.0bn or 2% higher than in the same month last year, in contrast with total managed expenditure of £102.5bn, which was £3.8bn or 4% higher than in July 2023. 

Financial year to date

The shortfall between receipts and spending of £51.4bn for the four months to July 2024 was £0.5bn better than in the same period last year, but £4.7bn over budget.

Cumulative taxes and other receipts amounted to £359.3bn in the first third of the financial year, up 2% compared with the same period last year, while total managed expenditure was 2% higher at £410.7bn. This is illustrated by Table 1, which highlights how cuts to employee national insurance rates have been offset by higher income tax, VAT, corporation tax, and non-tax receipts. 

Total managed expenditure for the first four months of £410.7bn was also up by 2% compared with April to July 2023, but this reflected spending on public services up 4%, welfare spending up 6% and gross investment up 10% driven by overruns and construction cost inflation being offset by lower energy-support subsidies and lower debt interest.

The reduction in debt interest of £6.1bn compared with the first four months of last year was driven by a £26.5bn swing in indexation on inflation-linked debt that more than offset a £20.4bn increase in interest on variable and fixed-rate debt.

Table 1: Summary receipts and spending

  Apr-Jul 2024
£bn
 Apr-Jul 2023
£bn
 Change
%
Income tax89.986.4+4%
VAT67.966.0+3%
National insurance53.558.3-8%
Corporation tax34.031.6+8%
Other taxes73.572.1+2%
Other receipts40.537.5+8%
Total receipts359.3351.9+2%
    
Public services(212.2)(204.8)+4%
Welfare(103.1)(97.5)+6%
Subsidies(10.6)(14.0)-24%
Debt interest(46.6)(52.7)-12%
Gross investment(38.2)(34.8)+10%
Total spending(410.7)(403.8)+2%
    
Deficit(51.4)(51.9)-1%

Table 2 summarises how public sector net borrowing (PSNB) to fund the deficit of £51.4bn combined with borrowing of £4.4bn to fund working capital movements, student loans and other financing requirements increased debt by £55.8bn during the first four months of the financial year. As a result, public sector net debt grew to £2,745.9bn on 31 July 2024, which is £931bn or 51% more than the £1,815bn reported for 31 March 2020 at the start of the pandemic.

The ratio of net debt to GDP ratio is at the highest it has been since the 1960s, having increased by 1.3 percentage points from 98.1% on 1 April 2024 to 99.4% on 31 July 2024. Borrowing to fund the deficit was equivalent to 1.9% of GDP and other borrowing was equivalent to 0.2%, an increase of 2.1% before being offset by 0.8% from the effect of inflation and economic growth on GDP (usually referred to as ‘inflating away’). Lower inflation this year means this effect is less pronounced than in the same period last year.

Table 2: Public sector net debt and net debt/GDP

 Apr-Jul 2024
£bn
Apr-Jul 2023
£bn
PSNB51.452.3
Other borrowing4.4(11.4)
Net change55.840.9
Opening net debt2,694.12,539.7
Closing net debt2,745.92,580.6
PSNB/GDP1.9%2.0%
Other/GDP0.2%(0.4%)
Inflating away(0.8%)(1.5%)
Net change1.3%0.1%
Opening net debt98.1%95.7%
Closing net debt99.4%95.6%

Public sector net worth, the new balance sheet metric launched by the ONS last year, was -£740bn on 31 May 2024, comprising £1,613bn in non-financial assets and £1,062bn in non-liquid financial assets minus £2,746bn of net debt (£343bn liquid financial assets – £3,089bn public sector gross debt) and other liabilities of £669bn. This is a £67bn deterioration from the start of the financial year and is £123bn more negative than in July 2023.

Revisions and other matters

Caution is needed with respect to the numbers published by the ONS, which are expected to be repeatedly revised as estimates are refined and gaps in the underlying data are filled. This includes local government, where monthly data is based on budget or high level estimates in the absence of monthly data collection.

The latest release saw the ONS reduce the reported deficit for the first three months of the financial year by £1.5bn from £49.8bn to £48.3bn as estimates were revised for new data.

Q1 public finances confirm challenging position for new government

First quarter shortfall between receipts and spending of almost £50bn emphasises the significant challenges facing the Chancellor as she puts together her first Budget.

The monthly public sector finances for June 2024 released by the Office for National Statistics (ONS) on Friday 19 July 2024 reported a provisional deficit for the first three months of the 2024/25 financial year of £49.8bn, £1.1bn better than a year previously but £3.2bn worse than budgeted.

Alison Ring OBE FCA, ICAEW Director of Public Sector and Taxation, says: “This is the first set of public sector finance data since the new government was elected, and today’s numbers set out the size of the obstacle the UK’s leaders face. 

“£14.5bn was borrowed to finance the deficit in June, which although £3.2bn less than in June 2023, brought the total for the first three months of the financial year to £49.8bn, slightly worse than expectations. The latest numbers also highlighted the growing amount of public debt, which stood at 99.5% of GDP or £2,740bn on 30 June 2024. Although total debt interest was lower than last year because of the effect of lower inflation on inflation-linked debt, interest on the bulk of debt continues to rise.

“The high level of debt – and the associated interest bill – means that the new Prime Minister and Chancellor will be faced with some very difficult decisions over the coming months as they decide which elements of their programme to prioritise, and which will have to wait.”

Month of June 2024

Taxes and other receipts amounted to £88.2bn in June 2024, up 2% compared with the same month last year, while total managed expenditure was 2% lower at £102.7bn. This resulted in a reduction of £3.2bn from a fiscal deficit of £17.7bn in June 2023 to £14.5bn in June 2024.

Financial year to date

Taxes and other receipts amounted to £258.0bn in the three months to June 2024, up 1% compared with the same month last year, while total managed expenditure was 1% higher at £307.8bn. This resulted in a reduction of £1.1bn from a fiscal deficit of £50.9bn for the first quarter of 2023/24 to £49.8bn for the first quarter of 2024/25. However, this is £3.2bn more than the £46.6bn for the first quarter included in the Spring Budget 2024.

Table 1 analyses receipts for the first quarter of the financial year, highlighting how cuts to employee national insurance rates have been offset by higher income tax, corporation tax, and non-tax receipts.

Table 1: Summary receipts and spending

Three months to Jun 2024 (£bn) Jun 2023 (£bn)Change (%) 
Income tax 58.1 56.1 +4%
VAT 49.9 49.6 +1%
National insurance 39.7 43.4 -9%
Corporation tax 25.3 23.4 +8%
Other taxes 54.9 54.1 +1%
Other receipts 30.1 27.7 +9%
Total receipts 258.0 254.3 +1%
Public services (158.8) (152.6) +4%
Welfare (76.9) (73.7) +4%
Subsidies (7.8) (11.3) -31%
Debt interest (35.2) (41.1) -14%
Gross investment (29.1) (26.5) +10%
Total spending (307.8) (305.2) +1%
Deficit (49.8) (50.9) -2%

Table 1 also shows how total managed expenditure for the first quarter of £307.8bn was up by 1% compared with April to June 2023, with higher spending on public services and welfare offset by lower energy-support subsidies and lower debt interest. The reduction in the latter of £5.9bn was driven by a £9.2bn reduction in indexation on inflation-linked debt that more than offset a £3.3bn or 44% increase in interest on variable and fixed-rate debt.

Table 2: Public sector net debt

Three months toJun 2024 (£bn)Jun 2023 (£bn)
Deficit (49.8) (50.9)
Other borrowing 3.9 (7.7)
Debt movement (45.9) (58.6)
Opening net debt (2,694.1) (2,539.7)
Closing net debt (2,740.0) (2,598.3)
Net debt/GDP 99.5% 96.7%

Public sector net debt was £2,740bn or 99.5% of GDP on 30 June 2024, just under £46bn higher than at the start of the financial year. At 99.5%, the debt to GDP ratio is the highest it has been since the 1960s.

The increase in the first quarter reflects borrowing to fund the deficit of just under £50bn minus close to £4bn in net cash inflows from loan recoveries and working capital movements in excess of lending by government.

Public sector net debt is £142bn or 5% higher than a year previously, equivalent to an increase of 2.8 percentage points in relation to the size of the economy. It is £925bn or 51% more than the £1,815bn reported for 31 March 2020 at the start of the pandemic and £1,712bn or 167% more than the £1,028bn net debt amount as of 31 March 2007 before the financial crisis, reflecting the huge sums borrowed over the last two decades. 

Public sector net worth, the new balance sheet metric launched by the ONS in 2023, was -£726bn on 31 May 2024, comprising £1,613bn in non-financial assets and £1,070bn in non-liquid financial assets minus £2,740bn of net debt (£340bn liquid financial assets – £3,080bn public sector gross debt) and other liabilities of £669bn. This is a £53bn deterioration from the start of the financial year and is £77bn more negative than the -£649bn net worth number for June 2023.

Revisions and other matters

Caution is needed with respect to the numbers published by the ONS, which are expected to be repeatedly revised as estimates are refined and gaps in the underlying data are filled. 

The latest release saw the ONS increase the reported deficit for the first two months of the financial year by £1.8bn from £33.5bn to £35.3bn as estimates were revised for new data. More significantly, public sector net debt at the end of May 2024 was reduced by £16.3bn to £2,726.6bn to correct for omitted data on Bank of England repo transactions during the current financial year. This reduced the reported debt to GDP ratio for May 2024 by 0.7 percentage points from 99.8% of GDP to 99.1%.

This article was originally published by ICAEW.

ICAEW chart of the week: World population

My chart for ICAEW this week looks at how a declining fertility rate means the global population is now anticipated to reach a peak of ‘just’ 10.3bn in 2084, according to the UN.

World population.
ICAEW chart of the week. 

Column chart showing the world’s population in 2000, 2025, 2050, 2075 and 2100. 

Europe and Middle East – 0.8bn, 0.9bn, 1.0bn, 1.0bn and 1.0bn. 
Americas – 0.8bn, 1.1bn, 1.2bn, 1.2bn and 1.1bn. 
Asia-Pacific – 2.1bn, 2.4bn, 2.3bn, 1.9bn and 1.5bn. 
South and Central Asia – 1.7bn, 2.3bn, 2.7bn, 2.9bn and 2.8bn. 
Africa – 0.8bn, 1.5bn, 2.5bn, 3.3bn and 3.8bn. 

Total – 6.2bn, 8.2bn, 9.7bn, 10.3bn (10,250m) and 10.2bn (10,180m), with a peak of 10.3bn (10,289m) in 2084. 

For the purposes of this chart, Europe and Middle East comprises Europe and Western Asia as defined by the UN but excludes Russia and Northern Africa, Asia-Pacific comprises Eastern Asia, Southeastern Asia and Oceania, and South and Central Asia comprises Southern Asia, Central Asia and Russia. 


18 Jul 2024.   Chart by Martin Wheatcroft FCA. Design by Sunday. 

Source: UN Department of Economic Affairs, ‘World Population Prospects’. 


© ICAEW 2024

The Population Division of the UN Department of Economic and Social Affairs (UN DESA) recently published its latest population projections for the 21st century. Its central projection is for the world’s population to increase from 8.2bn next year to a peak of 10.3bn in 2084 in 2084 before falling slightly to 10.2bn at the end of the century.

This means that the population will have increased by 2.0bn between 2000 and 2025 and is projected to increase by 1.5bn over the next 25 years to 9.7bn in 2050 and by 0.6bn to 10.3bn in 2075, before gradually starting to fall from 2084 onwards.

My chart illustrates how this change differs by region, with the population of Africa expected to grow throughout the century from 1.5bn in 2025 to 3.8bn in 2100. South and Central Asia, which has seen its population grow from 1.7bn in 2000 to an anticipated 2.3bn next year, is expected to see further growth to 2.9bn in 2075 before then falling to 2.8bn in 2100, while the population of the Asia-Pacific region is expected to increase from 2.1bn in 2000 to 2.4bn in 2025, is expected to fall gradually from 2030 onwards to 1.5bn in 2100.

The population of the Americas is expected to grow slightly from 1.1bn in 2025 (up from 0.8bn in 2000) to 1.2bn before falling back to 1.1bn by 2100, while Europe and Middle East’s population is expected to increase from 0.9bn in 2025 (up from 0.8bn in 2000) to close to 1.0bn in 2050 and for the rest of the century.

UN DESA says the main driver of global population increase over the next 60 years until it peaks is the momentum created by growth in the past, with increases in the number of women of reproductive age until the late 2050s offsetting a declining fertility rate – currently one child fewer on average than in the 1990s (2.25 live births per woman currently compared with 3.31 in 1990). They also project that the number of people aged 65 will reach 2.2bn in 2080, surpassing the number of children under 18 in that year.

The declining fertility rate is one reason that the UN are projecting that the world’s population in 2100 will be 700m or 6% smaller than they were anticipating a decade ago, despite life expectancy starting to increase again after falling during the COVID-19 pandemic.

For some countries and areas, the declines in population are expected to be quite significant over the remainder of the century, such as the populations of China and Japan, which are expected to reduce from 1,416m to 633m and from 123m to 77m between 2025 and 2100 respectively. Meanwhile India is expected to grow from a population of 1,464m in 2025 to a peak of 1,701m in 2061 before falling to 1,505m in 2100.

Many other countries and areas have already or will shortly see their populations start to decline, except for about 52 countries and areas up until 2054, and 62 up until 2100, where immigration will be the main driver of population growth. The latter includes the UK, where the population is expected to rise from 70m in 2025 to a peak of 76m in 2073 before falling to 74m in 2100, and the US, expected to grow from 347m in 2025 to 421m in 2100.

According to the analysis by the UN, there are around 100 countries and areas (out of the 237 included in their analysis) with relatively youthful populations over the next half century that have a window of opportunity to accelerate their economic development. This ‘demographic dividend’ occurs when the share of the population of working ages is increasing faster than the overall population and a substantial and sustained decline in fertility increases the numbers available to work, assuming the countries concerned can put in the investment needed to take advantage of this opportunity.

This chart was originally published by ICAEW.

ICAEW chart of the week: GDP over five years

My chart for ICAEW this week looks at how negative economic growth per capita over the last five years may have contributed to the recent change in government.

GDP over five years. 
ICAEW chart of the week. 

Step (waterfall) chart showing the changes in quarterly GDP in 2019 Q1 and 2024 Q1. 

2019 Q1: £549bn 

+ Inflation: +£120bn (+4.0% per year) 

+ Population: +£22bn (+0.6% per year) 

+ Growth per capita: -£3bn (-0.1% per year) 

= 2024 Q1: £688bn


11 Jul 2024.   Chart by Martin Wheatcroft FCA. Design by Sunday. 

Source: ONS, ‘UK quarterly national accounts: Jan-Mar 2024’. 


© ICAEW 2024

My chart this week is on the change in quarterly GDP over the past five years, analysing the change between GDP as calculated by the Office for National Statistics (ONS) of £549bn in the first quarter of 2019 and £688bn in the first quarter of 2024, a net increase of £139bn.

Inflation, at 4% a year on average over the past five years, was the largest contributor to the change, being £120bn out of £139bn of the increase. An increase in population of more than 0.6% a year added a further £22bn, but this was offset by £3bn from negative economic growth per capita of 0.1% on average over the past five years.

Breaking down the £19bn change resulting from economic growth (0.5% a year on average), between population change and economic growth per capita in this way highlights how net inward migration has been one of the most significant drivers of the UK economy over the past five years. 

While there are multiple reasons why the electorate decided to vote in a new government in the recent UK general election, the £41 reduction in quarterly GDP per capita over the past five years after adjusting for inflation – and the associated drop in living standards – to £9,994 per person in 2024 Q1 is likely to have been one of them.

The good news is that the next five years may be better, with monthly GDP up by 0.40% over the course of April and May 2024. This can be broken down between an estimated population growth of 0.16% and an increase in monthly GDP per capita over the two months of 0.24%, a positive sign, especially in the light of the latest ICAEW Business Confidence Monitor reporting that business confidence has risen to its highest level in over two years.

This chart was originally published by ICAEW.

New government to inherit tough public finances

Public sector net debt has passed £2.7tn for the first time. In May the debt increased by £49bn from £2,694bn to £2,743bn, 51% higher than it was in March 2020 at the start of the pandemic.

The monthly public sector finances for May 2024 released by the Office for National Statistics (ONS) on Friday 21 June 2024 reported a provisional deficit for the first two months of the 2024/25 financial year of £33.5bn, £1.5bn better than the £35.0bn predicted by the Office for Budget Responsibility (OBR) and £0.4bn higher than in April and May 2023.

An ICAEW spokesperson said: “Today’s numbers show that public sector net debt continues to grow, up from £2.69tn in April to £2.74tn in May, the first time it has exceeded £2.7tn.

“Net debt is now 51% higher than it was at the start of the pandemic in March 2020, and 167% higher than it was in March 2010, pushed up by the spikes in spending during the pandemic and to offset energy bills, as well as borrowing to fund day-to-day spending and investment. High borrowing costs and the financial consequences of more people living longer mean that the public finances are significantly weaker and less resilient than they were 14 years ago.

“When the country goes to the polls on 4 July, the reality is that whoever wins power will inherit an extremely challenging fiscal position that will hamper their ability to turn the country around.”

Month of May 2024

Taxes and other receipts amounted to £85.1bn in May 2024, up 2% compared with the same month last year, while total managed expenditure was also 2% higher at £100.1bn.

The resulting fiscal deficit of £15.0bn for the month was £0.8bn higher than in May 2023.

Financial year to date

As summarised in Table 1, total receipts in April and May 2024 of £170.4bn were 2% higher than in the same two months last year, with the cuts to employee national insurance rates offset by higher income tax, corporation tax, and non-tax receipts.

Table 1: Summary receipts and spending

Two months toMay 2024
£bn
May 2023
£bn
Change
%
Income tax38.236.8+4%
VAT33.933.6+1%
National insurance25.928.2-8%
Corporation tax16.615.5+7%
Other taxes36.035.2+2%
Other receipts19.818.5+7%
Total receipts170.4167.8+2%

Public services

(108.3)

(104.5)

+4%
Welfare(51.4)(49.1)+5%
Subsidies(5.2)(7.8)-33%
Debt interest(21.4)(21.6)-1%
Gross investment(17.6)(17.9)-2%
Total spending(203.9)(200.9)+1%

Deficit

(33.5)

(33.1)

+1%

Table 1 also shows how total managed expenditure for the two months of £203.9bn was up by more than 1% compared with April and May 2023, with higher spending on public services and welfare offset by lower energy-support subsidies and marginally lower debt interest. The latter was driven by significantly lower indexation on inflation-linked debt offsetting the much higher rates of interest payable on variable rate and refinanced fixed-rate debt.

Table 2: Public sector net debt 

Two months toMay 2024
£bn
May 2023
£bn
Deficit(33.5)(33.1)
Other borrowing(10.2)2.1
Debt movement(43.7)(31.0)
Opening net debt(2,699.2)(2,539.7)
Closing net debt(2,742.9)(2,570.7)

Net debt/GDP

99.8%

96.1%

Public sector net debt as of 31 May 2024 was £2,743bn or 99.8% of GDP, just under £44bn higher than at the start of the financial year. The increase reflects borrowing to fund the deficit of £33.5bn and £10.2bn borrowed to fund lending by government and other cash requirements, net of loan recoveries.

Public sector net debt was £172bn or 7% higher than a year previously, and 3.7 percentage points higher in relation to the size of the economy.

Public sector net debt is £928bn or 51% more than the £1,815bn reported for 31 March 2020 at the start of the pandemic and £1,715bn or 167% more than the £1,028bn net debt amount as of 31 March 2007 before the financial crisis, reflecting the huge sums borrowed over the last 14 years.

Public sector net worth, the new balance sheet metric launched by the ONS in 2023, was -£726bn on 31 May 2024, comprising £1,613bn in non-financial assets and £1,074bn in non-liquid financial assets minus £2,743bn of net debt (£300bn liquid financial assets – £3,043bn public sector gross debt) and other liabilities of £670bn. This is a £47bn deterioration from the start of the financial year and is £95bn more negative than the -£631bn net worth number for May 2023.

Revisions and other matters

Caution is needed with respect to the numbers published by the ONS, which are expected to be repeatedly revised as estimates are refined and gaps in the underlying data are filled. 

The latest release saw the ONS reduce the reported deficit for April 2024 by £2.1bn from £20.5bn to £18.4bn and revise the deficit for the year to March 2024 up by £0.7bn from £121.4bn to £122.1bn as estimates of tax receipts and expenditure were updated for better data.

This article was originally published by ICAEW.

ICAEW chart of the week: Global military spending

While the UK commits to increasing its defence and security expenditure, our chart this week looks at military spending around the world, which has reached $2.4trn.

Column chart

Global military spending
ICAEW chart of the week

Column 1: NATO

USA $916bn
UK $75bn
Rest of NATO $360bn
Total $1,351bn

Column 2: SCO and CSTO

China $296bn
Russia $109bn
India and other $106bn
Total $511bn

Column 3: Rest of the world

Other US allies $304bn
Ukraine $65bn
Other countries $212bn
Total $581bn


25 April 2024.
Chart by Martin Wheatcroft FCA. Design by Sunday.

Source: SIPRI Military Expenditure Database. Excludes Cuba, North Korea, Syria and Yemen.

© ICAEW 2024

Our chart this week is based on the latter, with SIPRI reporting that global military expenditure has increased to $2,443bn in 2023, a 6.8% increase after adjusting for currency movements. SIPRI’s numbers are based on publicly available information, which means that some countries may be spending even more on their militaries that are included in the database. SIPRI was unable to obtain numbers for military spending by Cuba, North Korea, Syria, Yemen, Turkmenistan, Uzbekistan, Somalia, Eritrea, Djibouti, and Laos.

Military spending is the news this week following the announcement by the UK government that it will commit to spending 2.5% of GDP on defence and security, the recent vote by the US Congress to provide $95bn in military aid to Ukraine ($61bn), Israel ($26bn) and Taiwan and others in the Indo-Pacific ($8bn), and the release of the Stockholm International Peace Research Institute (SIPRI) Military Expenditure Database for 2023.

More than half of that spending is incurred by NATO, with total military spending of $1,351bn, comprising $916bn by the US, $75bn by the UK and $360bn by other NATO members. Of the latter, $307bn was spent by the 23 members of the EU that are also members of NATO (including $67bn by Germany, $61bn by France, $36bn by Italy, $32bn by Poland and $24bn by Spain), while $53bn was spent by the other seven members (including $27bn by Canada and $16bn by Türkiye).

The Shanghai Cooperation Organisation (SCO) and the Collective Security Treaty Organisation (CSTO) are partially overlapping economic and military alliances convened by China and Russia respectively. China has the biggest military with $296bn spent in 2023, while Russia spent $109bn and other members spent $106bn (of which India spent $84bn).

We have categorised the rest of the world between other US allies which spent $304bn in 2023 (including $76bn by Saudi Arabia, $50bn by non-US members of the Rio Pact, $50bn by Japan, $48bn by South Korea, $32bn by Australia, $27bn by Israel and $17bn by Taiwan), Ukraine which spent $65bn, and $212bn spent by other countries for which SIPRI has data.

The numbers do not take account of the differences in purchasing power, particularly on salaries. That means China and India, for example, can employ many more soldiers, sailors and aircrew than NATO countries can for the same amount of money.

The Ukraine number also excludes $35bn in military spending funded by the US ($25bn) and other partners ($10bn) during 2023 that was not part of its national budget.

Global military spending is expected to increase further in 2024 as the international security situation deteriorates. This includes NATO members that plan to increase their defence and security spending to meet or exceed the 2% of GDP NATO minimum guideline set in 2014 to be achieved by 2024.

This includes the UK, which now plans to increase its spending on defence and security from 2.35% of GDP in 2023/24 to 2.5% of GDP by 2028/29, with suggestions from defence sources that setting a target of 3% of GDP may be necessary at some point in the next decade.

This chart was originally published by ICAEW.

ICAEW chart of the week: IMF Fiscal Monitor

Our chart this week finds that the UK is ranking highly in the IMF’s latest five-year forecasts for general government net debt.

Bar chart

General government net debt/GDP: 2029 forecast

Emerging and developing economies (green bars)
World (purple bar)
Advanced economies (blue bar)
UK (red bar)

Kazakhstan (green) 8%
Canada (blue) 13%
Saudi Arabia (green) 22%
Iran (green) 23%
Australia (blue) 24%
South Korea (blue) 29%
Türkiye (green) 30%
Indonesia (green) 37%
Germany (blue) 43%
Netherlands (blue) 43%
Nigeria (green) 47%
Mexico (green) 51%
Poland (green) 55%
Egypt (green) 56%
Pakistan (green) 61%
Brazil (green) 70%
World (purple) 79%
South Africa (green) 84%
Spain (blue) 92%
UK (red) 98%
France (blue) 107%
US (blue) 108%
Italy (blue) 136%
Japan (blue) 153%


18 Apr 2024.
Chart by Martin Wheatcroft FCA. Design by Sunday.
Source: IMF Fiscal Monitor: 17 Apr 2024.

©️ ICAEW 2024

The International Money Fund (IMF) released its latest IMF Fiscal Monitor on 17 April 2024, highlighting how public debts and deficits are higher than before the pandemic and public debts are expected to remain high. The IMF says: “Amid mounting debt, now is the time to bring back sustainable public finances”, commenting that as prospects for a global economic soft landing have improved, it is time for action to bring government finances back under control. 

Our chart this week illustrates how the UK is one of the ‘leading’ nations in government borrowing, with general government net debt projected by the IMF to reach 98% of GDP by 2029, compared with 92.5% in 2023. (Note: general government net debt is different to the public sector net debt measure used in the UK public finances – the latter includes the Bank of England and other public corporations.)

The chart illustrates how the major countries with the largest debt burdens tend to be advanced economies, with Spain (92% of GDP), the UK (98%), France (107%), US (108%), Italy (136%) and Japan (153%) having debt levels close to, or exceeding, the sizes of their economies.

Some countries are in much better fiscal positions, with Germany expected to bring its general government net debt down to 43% of GDP by 2029, while the Netherlands (43%), South Korea (29%), Australia (24%) and Canada (13%) also have relatively low levels of public debt compared with other advanced economies.

Emerging market ‘middle-income’ and ‘low-income’ developing countries often have much lower levels of public debt than advanced countries, often simply because it is more difficult for them to borrow to the same extent as well as not having the same scale of welfare provision as richer countries to finance. Examples include Kazakhstan (projected to have a general government debt of 8% of GDP in 2029), Saudi Arabia (22%), Iran (23%), Türkiye (30%) and Indonesia (37%). However, that does not stop some emerging and developing countries borrowing more, such as Nigeria (47%), Mexico (51%), Poland (55%), Egypt (56%), Pakistan (61%), Brazil (70%) and South Africa (84%).

Not shown in the chart are China and India for which no net debt numbers are available. The IMF projects them to have general government gross debt in 2029 of 110% and 78% of GDP respectively, indicating how their public debts have grown substantially in recent years. However, without knowing their levels of cash holdings it is less clear where they stand in the rankings.

Also not shown is Norway, the only country with negative general government net debt reported by the IMF. Norway’s general government net cash is projected to reach 139% of GDP in 2029, up from 99% in 2023.

As with all metrics, there are some issues in comparing the circumstances of individual countries. Many countries will also have investments, other public assets, or natural resource rights that are not netted off against debt, while many will also have other liabilities or financial commitments that aren’t counted within debt. For example, the UK has significant liabilities for unfunded public sector pensions as well as even larger financial commitments to the state pension, either of which, if included, would move the UK above the US in the rankings.

The IMF believes that as the world recovers from the pandemic and inflation is brought under control, it is important for countries to start tackling the deficits in the public finances and start bringing down the level of public debt. 

This may be difficult for countries such as the UK where significant pressures on the public finances mean public debt is expected to increase over the medium term rather than fall.

This chart was originally published by ICAEW.

ICAEW chart of the week: Public spending crunch

Public spend as a share of the economy must fall over the next five years to make the sums add up – a big challenge for the next government.

Step chart:

Public spending crunch
ICAEW chart of the week

Change in total public spending compared to change in nominal GDP

2025/26: -1.1%
2026/27: -0.7%
2027/28: -1.1%
2028/29: -0.7%
Cumulative: -3.6%

11 April 2024.
Chart by Martin Wheatcroft FCA. Design by Sunday.

Sources: HM Treasury, 'Spring Budget 2024'; OBR, 'Economic and Fiscal Outlook 2024'; ICAEW calculations.

©️ ICAEW 2024

My recently published in-depth Fiscal Insight into the Spring Budget 2024 highlights how the UK’s public finances are in a weak position, with difficult choices on spending deferred and post-election tax rises likely, irrespective of who wins the general election.

My chart for ICAEW this week illustrates how total public spending is forecast to fall by 3.6% as a share of national income between the first and final year of the fiscal forecast. This is equivalent to a 1.6 percentage point reduction in total managed expenditure from a budget of 44% of GDP in 2024/25 to a forecast of 42.4% of GDP in 2028/29.

At a reduction of 1.1% in 2025/26, 0.7% in 2026/27, 1.1% in 2027/28 and 0.7% in 2028/29, this may not sound that large – after all surely there must be some efficiencies that can be found in a budget of £1.2trn, or £1.4trn by 2028/29?

However, this doesn’t take account of the fact that around half of public spending goes on welfare, health and social care spending, where costs are principally driven by people living longer, the triple-lock state pension guarantee, and increasing levels of ill-health. And another 10% or so goes on interest, where costs are driven by no-longer-very-low interest rates on a growing level of debt.

Nor does it allow for the significant pressures facing many public services that are likely to need additional funding to address. This includes the deteriorating international security situation that has prompted recent calls for defence and security spending to increase from 2% to 3% of GDP, underperformance across a range of public services from the criminal justice system to potholes to HMRC service standards, local authorities that are struggling financially, and crumbling infrastructure (in some cases literally) – among many others. There is also little sign of the scale of investment that would be needed to transform the delivery of public services to achieve sustainable cost reductions while maintaining or improving service quality.

It is perhaps unsurprising that the government decided to postpone the three-year Spending Review scheduled for 2024 until after the general election, given how the Office for Budget Responsibility has highlighted how the 2021 Spending Review led to a departmental spending increase of £32bn a year, or around 1.2% of GDP. A similar revision to current spending plans would have more than absorbed the amounts used for tax cuts in the Autumn Statement 2023 and the Spring Budget 2024, or pushed up borrowing levels even higher than are currently planned.

If we are lucky, there will be more detail on each party’s tax and spending plans in their manifesto documents. Then again…

Read more in the ICAEW Fiscal Insight: Spring Budget 2024 or visit our Spring Budget 2024 hub for our extensive coverage of its tax and public finance implications.

This chart was originally published by ICAEW.

ICAEW publishes in-depth Fiscal Insight on the Spring Budget

Now that the dust has settled on last month’s Spring Budget, ICAEW has published a more detailed analysis on the implications for the public finances.

ICAEW’s Fiscal Insight on the Spring Budget 2024 provides an analysis of the key numbers, risks to the Office for Budget Responsibility forecast, tax measures, forecast revisions since the 2023 Autumn Statement, the fiscal position in the 2024/25 Budget year, borrowing over the next five years, the calculation of underlying debt, the £1.2trn that HM Treasury needs to raise from debt investors, and our conclusions on what the numbers mean for the public finances.

Key points highlighted in the report include:

Headlines

  • Modest improvement in forecasts and small tax increases ‘pay for’ national insurance cut.
  • Headroom of £9bn against the Chancellor’s primary fiscal rule is tiny compared with risks.
  • End of low-cost borrowing is hampering investment in infrastructure and public services.
  • Weak economy, high debt, demographic challenges, underperforming public services.
  • No long-term fiscal strategy.

Key numbers

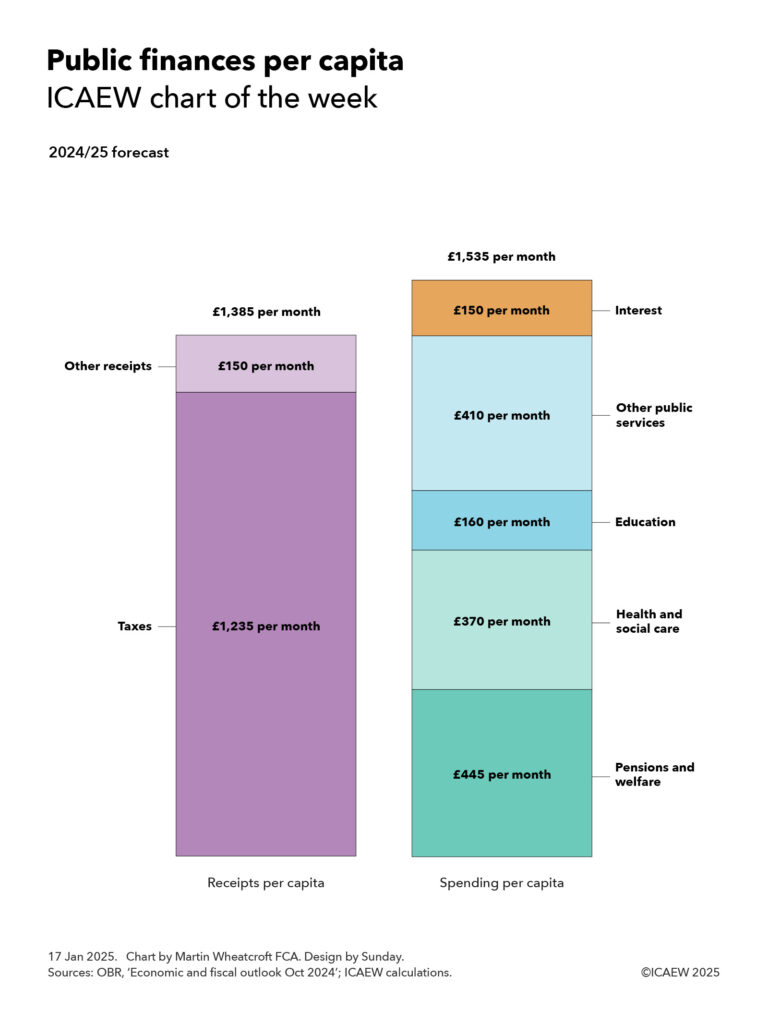
  • Tax and other receipts of £1,139bn in 2024/25, equivalent to £1,375 per person per month.
  • Public spending of £1,226bn in 2024/25, equivalent to £1,480 per person per month.
  • Deficit projected to fall by a quarter to £87bn in 2024/25 and gradually to £39bn in 2028/29.
  • Headline debt expected to reach £2.8trn by March 2025 and £3.0trn by March 2029.
  • Underlying debt/GDP forecast to increase from 88.8% to 93.2% and then fall to 92.9%.

Conclusions

  • Difficult choices on spending deferred until after the general election.
  • Post-election tax increases likely, irrespective of who wins the general election.
  • A badly designed fiscal rule driving poor decisions and unrealistic spending forecasts.
  • Predicted reduction in the deficit to below 2% of GDP by 2027/28 is unlikely to occur.
  • Further pre-election tax cuts could affect credibility with debt markets. 

Alison Ring OBE FCA, ICAEW Director for Public Sector and Taxation, is quoted in the Fiscal Insight as follows:

“The principal story of the Spring Budget has been how the Chancellor was able to find room for tax cuts while still meeting his fiscal targets to ‘bring down debt and the deficit’.

“This is a frustrating narrative as it misses the bigger picture of public finances that are on an unsustainable path, with little sign of a long-term fiscal strategy to address demographic change, growing balance sheet liabilities, underperforming public services, rising debt interest, or resilience against future economic shocks.

“Debt is high and projected to be even higher in five years’ time than it is today. ‘Headroom’ is tiny in context of trillions of pounds of tax receipts and public spending over the next five years and forecasts that don’t reflect government practice in freezing fuel duties nor likely spending increases from the now postponed Spending Review.

“And we have a fiscal target that discourages essential infrastructure investment while at the same time never needing to be achieved as it is rolled forward each year.

“All of our fiscal eggs are now in a basket labelled ‘hope’ [for economic growth].”

Fiscal Insight

Read the full Fiscal Insight report, which provides detailed analysis on the Spring Budget’s implications for the public finances.

For further coverage, including more detailed information about tax measures, visit ICAEW’s Spring Budget 2024 site by clicking here.

This article was written by Martin Wheatcroft FCA on behalf of ICAEW and was originally published by ICAEW.