ICAEW chart of the week: Pensioners dilemma

The ‘elephant in the room’ of growing numbers of pensioners and what that will mean for the long-term prospects of the public finances is likely to be avoided yet again at next week’s Autumn Statement.

Pensioners dilemma

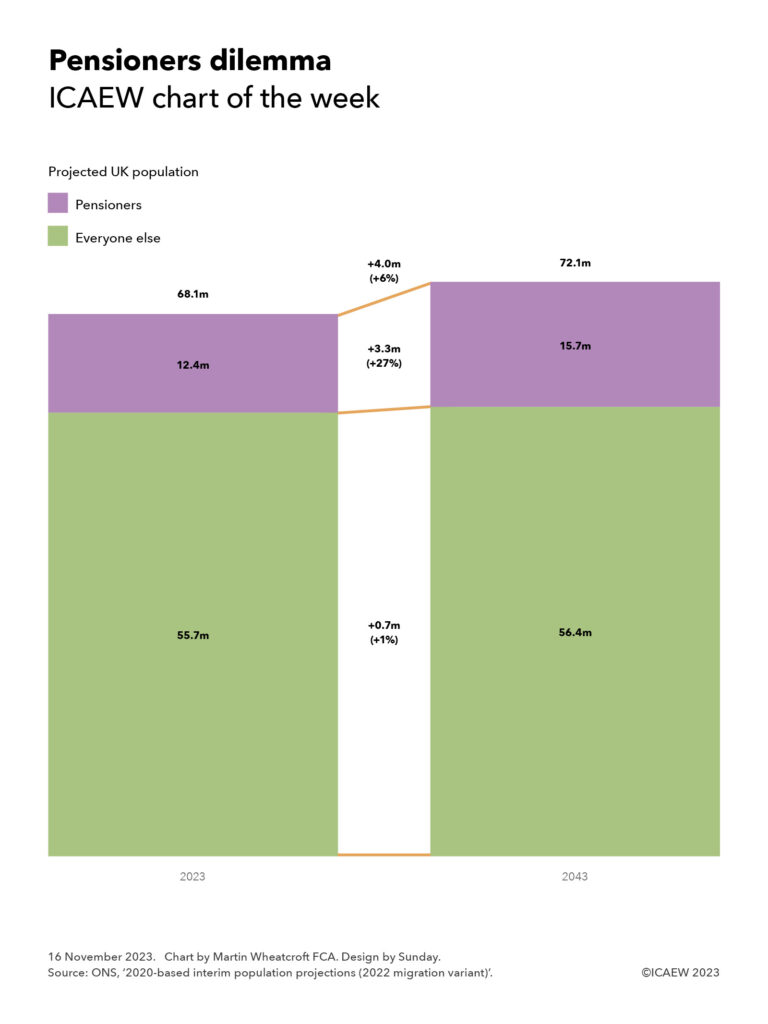
Two column chart with lines between them showing projected changes in the UK population between 2023 and 2043.

2023: 68.1m (left hand column) Change: +4.0m (+6%)
2043: 72.1m (right hand column)

Split into two bars in each column.

Pensioners (in purple)

2023: 12.4m
Change: +3.3m (+27%)
2043: 15.7m

Everyone else

2023: 56.7m
Change +0.7m (+1%)
2043: 56.4m

My chart for ICAEW this week is on the ‘elephant in the room’ that haunts fiscal events such as next week’s Autumn Statement – the rapidly rising number of pensioners that is driving some of the biggest line items in the national budget: pensions, health and social care.

This fiscal event is unlikely to be any different, with the Chancellor expected to focus most of his statement on short-term measures to free up headroom for pre-election tax cuts at a time of stagnant economic growth.

Any substantive discussion on the long-term prospects for the public finances is likely to be absent beyond a continued commitment to seeing the debt to GDP ratio start to fall within the next five years. How he – or more likely his successors – might be able to avoid having to raise taxes significantly in the coming decades to pay for the cost of pensions, health and social care for many more people, living longer, sometimes less healthy lives, is unlikely to be at the core of what is announced.

To illustrate the dilemma facing policymakers and the public, our chart shows how pensioners represent 3.3m out of the 4.0m projected increase in the size of the UK population between 2023 and 2043. The total population of the UK is projected to increase by 6% from 68.1m in 2023 to 72.1m in 2043, with the number of pensioners expected to increase by 27% from 12.4m this year to 15.7m in 20 years’ time. 

The number of non-pensioners is expected to increase by 0.7m or 1% from 55.7m to 56.4m, with net inward migration of 5.0m over that period offsetting what would otherwise be a significant fall in the numbers below retirement age. (Not shown in the chart is a projected 3% rise in the working age population and a 7% fall in the number of children.)

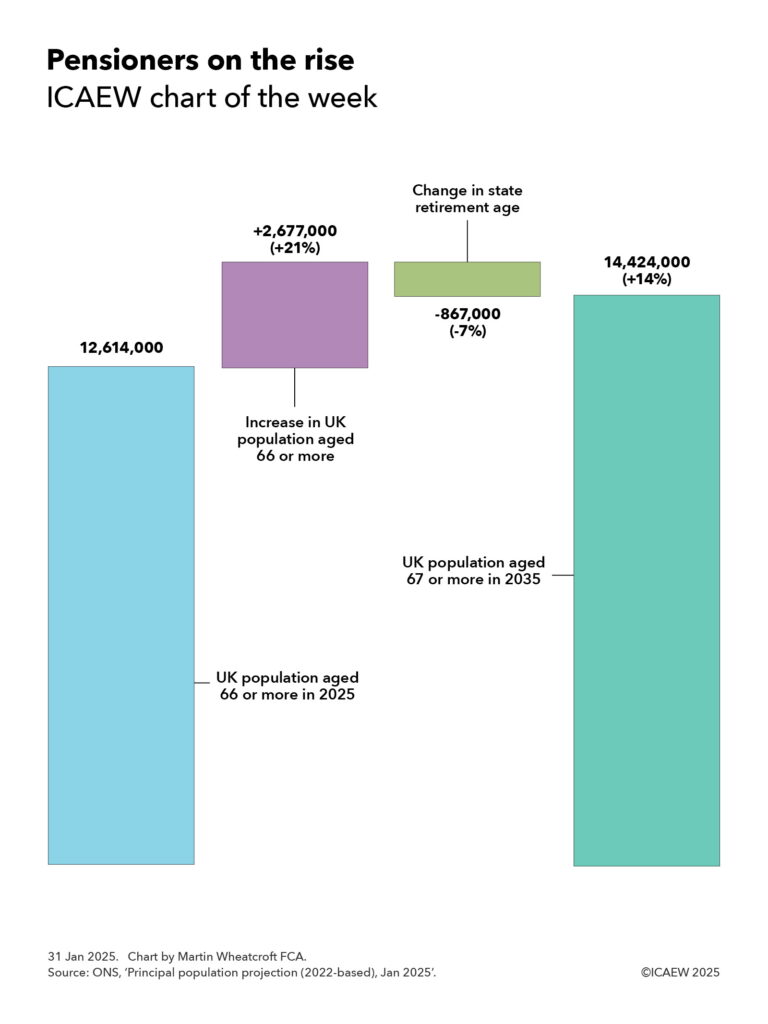
The projected 27% rise in the number of pensioners is despite a planned increase in the state pension age from age 66 to age 67 in 2027, one of the few long-term steps the government has taken to mitigate the fiscal effects of rising pensioner numbers. However, increasing the retirement age doesn’t directly impact health and social care costs, as well as being partly offset by the cost of supporting increasing numbers of people out of work between traditional retirement age and the age at which they can take their state pension.

Given the significance of the demographic challenge to the public finances, there is very little public debate on what to do, especially as the current policy of cutting the proportion of spending going on public services outside of health appears increasingly unsustainable. 

Spending on defence and security (the traditional budget to raid) is already close to the NATO minimum and appears likely to need to increase given the global security situation, while extracting further savings from other public services seems extremely unlikely, especially given the reluctance of successive governments to put in the level of upfront and ongoing capital investment that might make operational savings possible.

The irony is that, unlike the game-theory scenario of the prisoners’ dilemma that makes optimal decision-making difficult for two prisoners who can’t communicate with each other, there is no theoretical restriction on the ability of policymakers to talk to the public about the pensioners dilemma and to have a proper debate about that might mean for taxes and public services in the long term.

Read moreICAEW Autumn Statement 2023 hub.

This chart was originally published by ICAEW.

ICAEW chart of the week: UK births and deaths

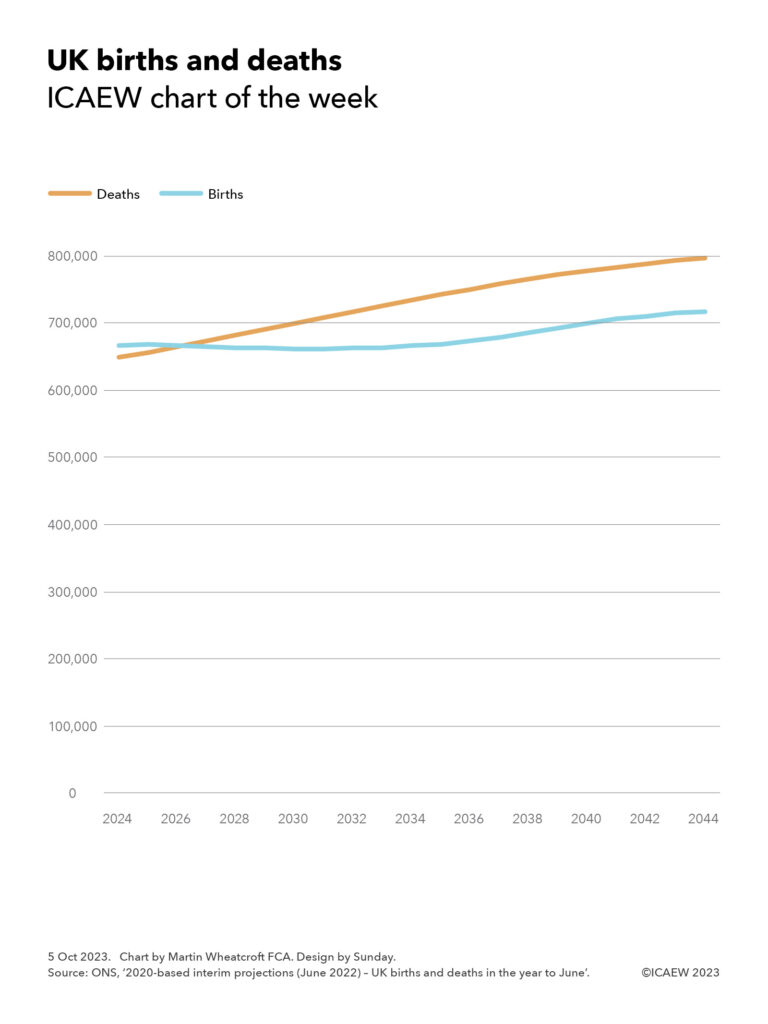
My chart this week looks at how deaths in the UK are expected to exceed births within just a couple of years – a major change in our demographic story.

UK births and deaths

Line chart showing projected births and deaths for years to June 2024 through to June 2044.

Births: 667,000 in the year to June 2024, falling slightly to 662,000 in the year to June 2031, before gradually rising to 718,000 in the year to June 2044. 

Deaths: 650,000 in the year to June 2024 rising to cross with the line for births in 2026 and continue to rise to 797,000 in the year to June 2044.

Source: ONS, '2020-based interim projections (June 2022) - UK births and deaths in the year to June'.

The big drivers of population change in the UK (and in many other developed countries) have been a declining birth rate and more people living longer, resulting in a growing population even before taking account of net inward migration.

However, that growth is starting to slow as the birth rate has declined as a proportion of the overall population – absent migration, it is expected to start to go into reverse as the death rate rises, driven by the bulge in the population constituted by the ‘baby boomer’ generation reaching their 60s and 70s.

As illustrated by my chart this week, the number of births is expected to fall slightly over the next few years (from 667,000 in the year to June 2024 and 668,000 in the year to June 2024 to 662,000 in the year to June 2031) before gradually rising to 718,000 in the year to June 2044. At the same time deaths are expected to rise throughout the period, from 650,000 in the year to June 2024 to 797,000 in the year to June 2044.

The projection is for births of 667,000 and deaths of 665,000 in the year to June 2026, a small net increase of 2,000, before reversing after that to reach 80,000 more deaths than births in the year to June 2044.

The population is still expected to grow, despite this shift from (to use the statistical terminology) ‘natural’ growth in the population (births exceeding deaths) to ‘natural’ contraction (deaths exceeding births). This is because the ONS has assumed net inward migration will continue at an average of 245,000 a year for most of the projection period, resulting in a projected growth in the population of 4.0m people or 6% (from 68.1m to 72.1m) over the next 20 years, in contrast with the 8.4m or 14% increase in the UK’s population over the past two decades.

Without inward migration, the likelihood is that the gap between deaths and births would be even larger than illustrated in our chart, given that a proportion of the children expected to be born will be the children of migrants.

This change in the demographics of the UK will have significant implications for the debate about migration over the coming decades, especially if the population absent migration is shrinking by 80,000 a year by 2044 as projected by the ONS. 

There are also implications for the public finances as, even with net inward migration, population growth is expected to be less than 0.3% a year over the next two decades instead of the 0.7% a year seen over the past 20 years. Not only will that reduce the potential for economic growth, but it will reduce the opportunities for efficiencies of scale in public spending that have been possible in previous decades.

The demographic tale of the 20th century in the UK was one of a rapidly growing population as many more children survived into adulthood, life expectancy increased significantly and migration offset a declining birth rate. The 21st century looks like being a very different story.

This chart was originally published by ICAEW.

ICAEW chart of the week: Japan demographics

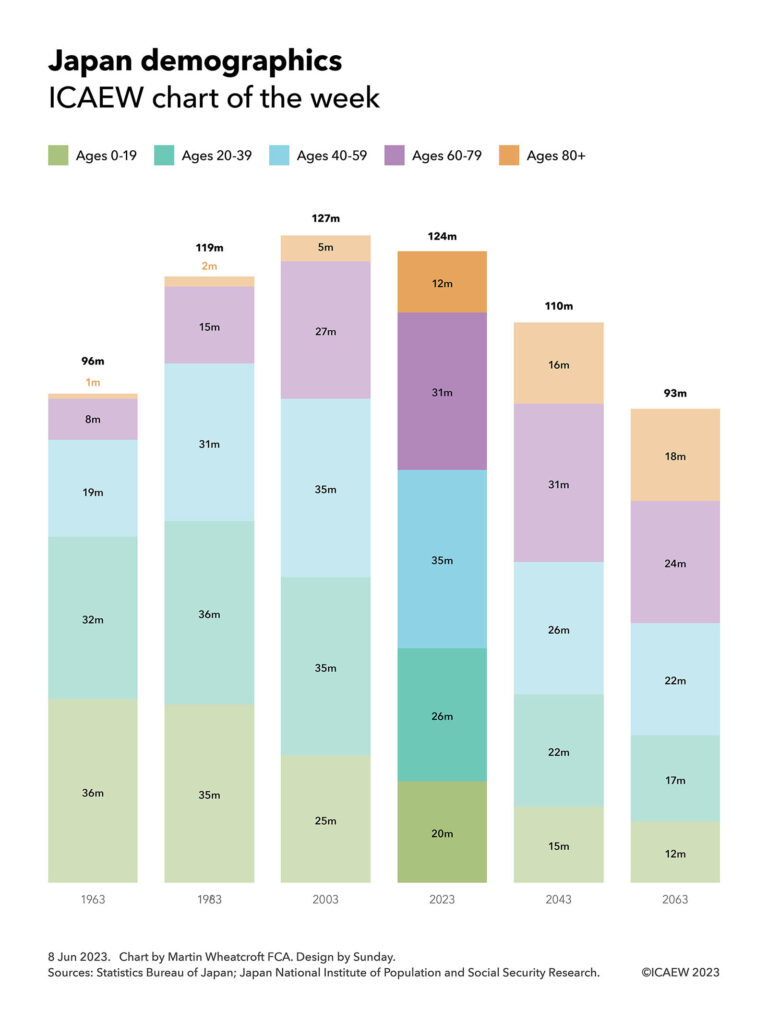
We look at how Japan’s population is ageing and falling fast, presenting some major challenges for the public finances of the third largest national economy in the world.

Column chart showing Japan's population at twenty-year intervals from 1963 to 2063, analysed into five age groups: Ages 0-19, Ages 20-39, Ages 40-59, Ages 60-79, Ages 80+.

1963 – 36m, 32m, 19m, 8m and 1m – 96m total
1983 – 35m, 36m, 31m, 15m and 2m – 119m total
2003 – 25m, 35m, 35m, 27m and 5m – 127m total
2023 – 20m, 26m, 35m, 31m and 12m – 124m total
2043 – 15m, 22m, 26m, 31m and 16m – 110m total
2063 – 12m, 17m, 22m, 24m and 18m – 93m total

Our chart this week is on the demographics of Japan, looking at how its population grew rapidly from 96m in 1963 to 119m in 1983 and then 127m in 2003, before falling to 124m this year, to a projected 110m in 20 years’ time, and to 93m in 40 years’ time.

Our analysis starts with the 96m people who lived in Japan in 1963 and shows how increased longevity saw the population increase to 119m in 1983 (an increase of 24m from 36m births and 2m migrants less 14m deaths), before increasing to 127m in 2003 (a further 8m increase from 25m births less 17m deaths). 

The population has been relatively stable since then, peaking at 128m in 2010 (not shown in the chart), before dropping to 124m this year as the number of births (20m over the last 20 years) fell below the number of deaths (25m). This was offset by a small amount of net inward migration, with the non-Japanese component of the population amounting to 3m in 2023.

Fewer younger people means that the number of births is expected to be even smaller over the next 20 years to 2043 at around 15m, at the same time as deaths are expected to increase in line with an older population. According to the latest medium-variant projections of Japan’s National Institute of Population and Social Security Research, the population is projected to drop by 14m to 110m in 2043 (15m births + 3m migrants – 32m deaths) before falling by a further 17m to 93m in 2063 (12m births + 3m migrants – 32m deaths).

The primary purpose of the chart is to illustrate how the age profile has shifted and continues to change as Japan gets older. Grouped into five age segments: 0-19, 20-39, 40-59, 60-79 and 80+, the population was, is, and is projected to be as follows:

1963 – 36m, 32m, 19m, 8m and 1m – 96m total
1983 – 35m, 36m, 31m, 15m and 2m – 119m total
2003 – 25m, 35m, 35m, 27m and 5m – 127m total
2023 – 20m, 26m, 35m, 31m and 12m – 124m total
2043 – 15m, 22m, 26m, 31m and 16m – 110m total
2063 – 12m, 17m, 22m, 24m and 18m – 93m total

The contrast in the age profile in the 20th century compared with 21st century Japan is dramatic, with the proportion of population aged 60 or over increasing from 9% in 1963 to 35% today and to a projected 45% in 2063, at the same time as the share aged under 40 has fallen from 72% in 1963 to 37% in 2023 and to a projected 31% in 2063.

Also not shown in the chart is Japan’s median age, which was 26 in 1963, 33 in 1983, 42 in 2003 and 49 this year, before being projected to reach 53 in 2043 and 56 in 2063 – more than double that of a century earlier.

These demographic shifts have and will continue to present a major fiscal challenge for the Japanese government. The continued growth in size of older generations (who typically consume the most in public services and welfare), accompanied by a shrinking working-age population (the group that typically pays most of the taxes that fund public services and welfare), will not be an easy dynamic to manage. At the same time, Japan already has one of the largest national debts of any country at in excess of 250% of its GDP.

One action Japan could take is to increase the pace of net inward migration even more than it already has, given it is currently at a much lower level than in many other developed countries such as the UK. This would have the benefit of bringing in more tax-paying individuals of working age and potentially assist in driving up the birth rate, slowing the rate of fall in the size of the population. However, there would be significant political challenges to overcome for such a route to be successful.

The good news for Japan is that it can still borrow at very low interest rates, with the effective interest rate payable on 10-year government bonds currently at 0.4%, much lower than in many comparable countries with much lower levels of external debt. This is both a threat, in that interest rates could go up significantly in the future, but also an opportunity in that the Japanese government is able to invest in adapting itself for a very different future.

This chart was originally published by ICAEW.

ICAEW chart of the week: China population

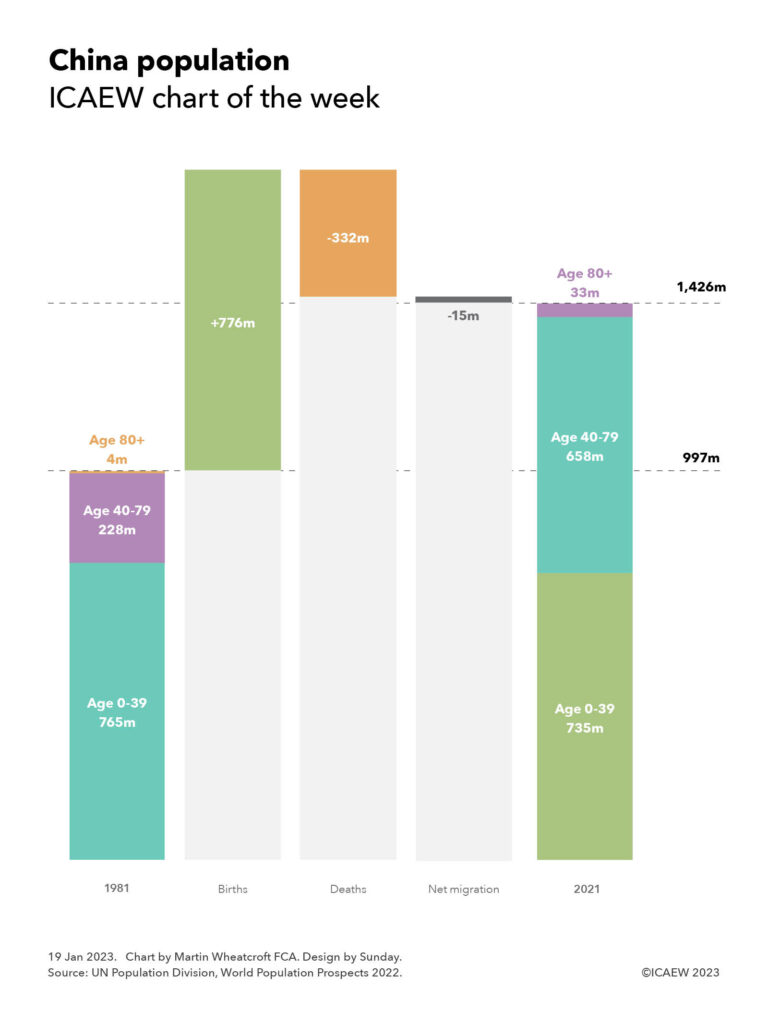
Our chart this week follows the news that China’s population has peaked at just over 1.4bn, illustrating the dramatic change that has taken place over the last 40 years.

Step chart showing the change between China's population in 1981 and 2021.

997m in 1981, comprising 765m age 0-39, 228m age 40-79 and 4m age 80+.

+776m births
- 332m deaths
- 15m net migration

= 1,426m in 2021 comprising 735m age 0-39, 658m age 40-79 and 33m age 80+.

The news that China’s population has peaked and is starting to fall prompted us to take a look at how the country with the largest population in the world has changed over the last 40 years.

In 1981, two years after the introduction of the one-child policy, China was a young country, with a population of 997m and a median age of 21. Today it is a mature country, with a population of 1,426m and a median age of 38, approaching that of many western countries.

Our chart shows how that population has changed according to the United Nations Population Division. In July 1981, China was estimated to amount to 997m, comprising 765m under the age 40, 228m between the ages of 40 and 79, and 4m aged 80 or over. Since then, there have been 776m births, 332m deaths and net outward migration of 15m to reach a total of 1,426m in July 2021. This comprised 735m people aged between 0 and 39, 658m between 40 and 79 and 33m aged 80 or over.

The dramatic change in the age profile reflects the huge success that China has had in tackling poverty and disease, enabling many more children to survive into adulthood compared with previous generations, and to then live longer lives. Infant mortality fell from 45 per thousand births in 1981 to less than six per thousand in 2021 and life expectancy at birth increased from 65 to 78.

The rapid growth in the population over the last 40 years has slowed in recent years as the number of births has fallen and (as the population has aged) deaths have increased. There were 10.9m births in 2021 (down from 12.2m in 2020, much less than the 22.8m births in 1981) and 10.6m deaths (up from 10.3m in 2020 and much higher than the 7.4m deaths recorded in 1981). With net outward migration of 0.2m, the net increase in the population in 2021 was less than 0.1m, down from the net increase of 1.9m in 2021 and much lower than the 17.1m increase experienced in 1982 and the peak increase of 19.9m in 1990.

According to the UN’s numbers, China’s population was expected to peak this year (in 2023), with a central projection that would see the population falling by 233m the next 40 years to 1,193m in 2061, and then to 767m in 2100.

However, China’s population is now believed to have peaked already, with the National Bureau of Statistics of China announcing on 17 January 2023 that China’s population excluding foreign citizens and excluding Hong Kong, Macau and Taiwan fell by 0.85m from 1,412.6m in December 2021 to 1,411.75m at the end of 2022.

India, with an estimated population of 1,407m in July 2021 according to the UN, was expected to overtake China as the world’s largest population during 2023, but there is some speculation following China’s announcement that this has already occurred. India’s population is currently projected to continue to grow over the next 40 years and peak at 1,697m in 2064.

With the population peaking and many more people living longer lives, the fiscal challenge facing China becomes similar to those facing western nations: how to support a rapidly increasing number of pensioners at the same time as the working age population is declining.

This chart was originally published by ICAEW.

ICAEW chart of the week: Migration

The latest migration statistics for the year to June 2022 come with a health warning from the ONS that its ‘experimental and provisional’ numbers for people movements during a pandemic may not be representative of long-term trends.

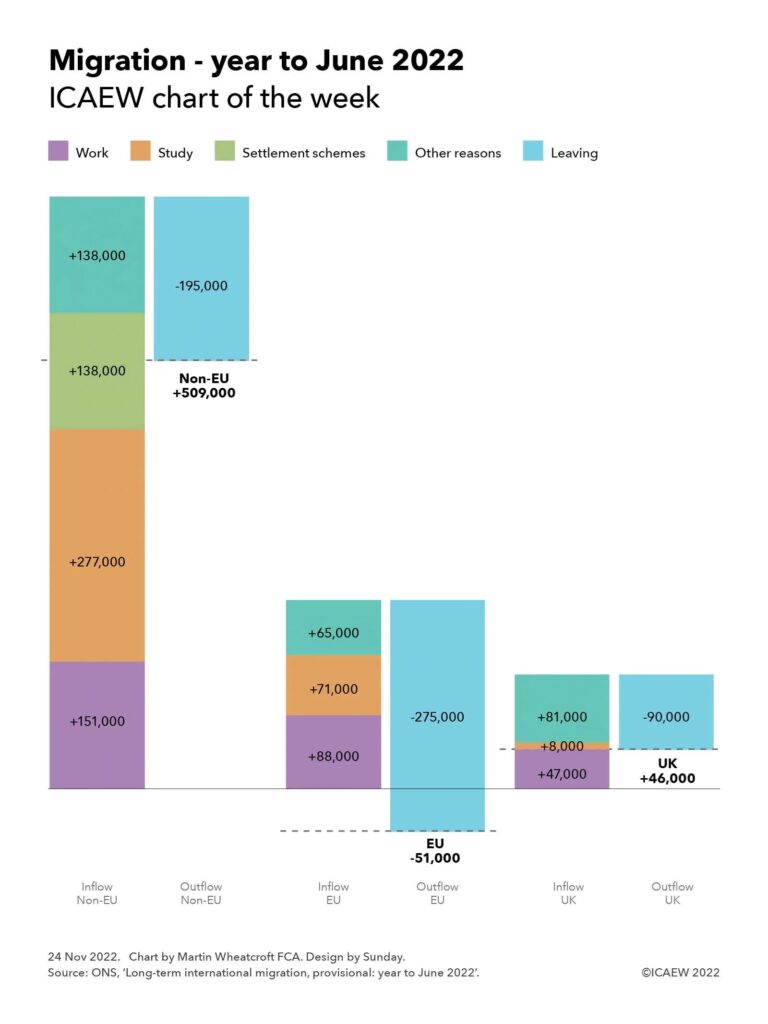
Column chart showing migration flows for the year to June 2022:

Non-EU inflows: Work +151,000, Study +277,000, Settlement schemes +138,000, Other reasons +138,000

Non-EU outflows: -195,000, Net = +509,000

EU inflows: Work +88,000, Study +71,000, Other reasons +65,000.

EU outflows: -275,000, Net = -51,000

UK inflows: Work +47,000, Study +8,000, Other reasons +81,000

UK outflows: -90,000, Net = +46,000.

On 24 November 2022 the Office for National Statistics (ONS) published its latest ‘experimental’ statistics on net migration, provisionally reporting that net long-term migration to the UK amounted to 504,000 in the year to June 2022. This compares with estimates for net inward migration of 173,000 in the year to June 2021 and 88,000 in the year to June 2020. 

This is equivalent to approximately 0.7% of the UK’s total population and is more than double the net inward migration assumption of 237,000 for the same period used by the ONS in its most recent principal long-term projection for the UK population.

The ONS cautions that the middle of a pandemic may not be representative of long-term trends, given possible pent up demand following restrictions in movements in the previous two years.

The ONS also points out the large jump in the number of non-EU students coming to study in the UK, which boosts immigration numbers in the current year. This should in theory reverse in three to four years’ time when many (but not all) of these students return to their home countries or move elsewhere.

Non-EU

As the chart illustrates, immigration from countries outside the EU in the year to June 2022 comprised 151,000 people coming to work in the UK, 277,000 coming to study, 138,000 under settlement schemes and a further 138,000 coming for other reasons. Around 195,000 people from outside the EU were estimated to have left during the year, giving a net inward migration number for non-EU citizens of 509,000. This compares with 157,000 during the year ended 30 June 2021 and 51,000 in the year before that.

The numbers from outside the EU coming to work has increased from 92,000 in the year to June 2021 and 81,000 in the year to June 2020, offsetting some of the reduction in those coming from the EU to work. Those coming to study have increased by an even greater proportion (from 143,000 and 136,000 in the preceding two years respectively), although this may represent pent-up demand from the pandemic when it was much more difficult for students wishing to start courses in the UK. However, the ONS does comment that the new graduate visa that permits students to stay and work in the UK for up to three years after completing their studies may have encouraged more students to come. 

The 138,000 arriving under settlement schemes in the year to June 2022 included an estimated 89,000 Ukrainians who were resettled in the UK under the Ukrainian scheme, approximately 21,000 Afghans under the Afghan resettlement scheme and an estimated 28,000 of the 76,000 Hong Kong residents granted British national overseas (BNO) visas during the year. 

The ONS does not give a full breakdown of the other reasons why people are coming to the UK, which principally relate to those joining family, those planning to stay temporarily but for longer than a year, refugees granted asylum during the year and any other reason not classified by the ONS. The numbers exclude 35,000 people that arrived by small boats during the period, although those who are granted asylum will show up in the statistics in subsequent periods.

EU

Inward migration from the EU has gone into reverse since the ending of free movement on 31 December 2020, with net outward migration of 51,000 for the year to June 2022 compared with net inward migration of 12,000 and 26,000 in the two preceding years. 

As the chart illustrates, the 88,000 people coming from the EU to work, 71,000 to study and 65,000 coming for other reasons – a total of 224,000 people – were more than offset by the 275,000 who left the UK. Those coming to the UK include Irish citizens who do not need visas to live and work in the UK, in addition those coming from other EU countries who now need to apply for visas before they can come to live and work in the UK. 

UK

There was a net inflow of 46,000 UK citizens, as an estimated 136,000 who returned home exceeded the estimate of 90,000 who emigrated from the UK. Of those coming back to the UK, 47,000 came to work, 8,000 to join family and 81,000 for other reasons. This compares with net inflows of 4,000 and 11,000 in the two preceding years.

Health warnings

The ONS provides a range of health warnings for this data set, labelling the numbers as ‘experimental and provisional’, as well as relating to an unusual year for international migration. The numbers were affected by the coronavirus pandemic, the settlement schemes for Ukrainians, Afghans and Hong Kong residents, and by the ending in the preceding year of free movement for EU citizens wishing to come to the UK and for UK citizens to live and work in the EU.

From an economic perspective, Chancellor Jeremy Hunt will no doubt be pleased at the additional workers that have arrived in the UK at a time of labour shortages, as well as the success of the university sector in attracting international students, some of whom are likely to stay at the end of their courses to work. Many of those arriving to join family or for other reasons will also join the workforce, further helping to grow economic activity.

With a national workforce that would shrink otherwise and many businesses calling for more freedom to recruit from overseas, the Chancellor may well be hoping for higher levels of migration to continue – even if some of his ministerial colleagues are likely to be less than positive about this possibility.

This chart was originally published by ICAEW.

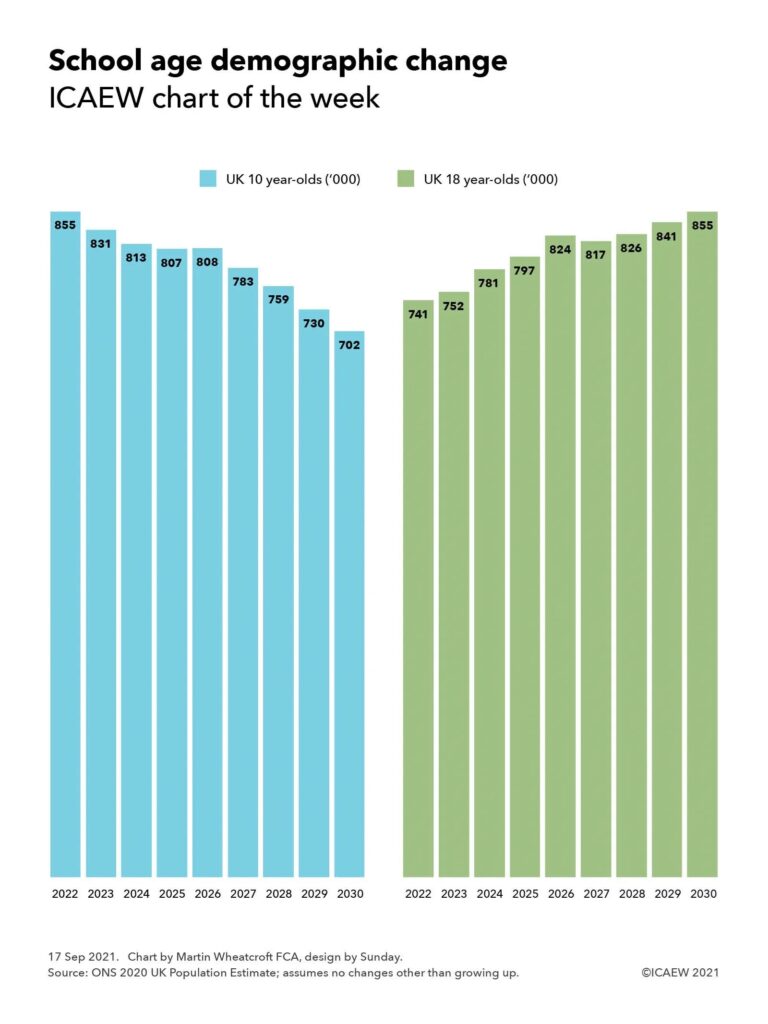
ICAEW chart of the week: School-age demographic change

This week’s chart illustrates how the number of 10 year-olds in the UK is expected to fall sharply over the rest of the decade, just as the number of 18 year-olds is expected to peak in 2030.

School-age children

10 year-olds

2022: 855,000
2023: 831,000
2024: 813,000 
2025: 807,000
2026: 808,000
2027: 783,000
2028: 759,000
2029: 730,000
2030: 702,000

18 year-olds

2022: 741,000 
2023: 752,000
2024: 781,000
2025: 797,000
2026: 824,000
2027: 817,000
2028: 826,000
2029: 841,000
2030: 855,000

The Office for National Statistics UK Population Estimate for July 2020 reports that there were 855,000 children in the cohort who will be 10 years old next year when most of them will be entering their final year of primary school. A falling birth rate since 2012 means that the numbers of 10-year-olds will fall by 18% over the following eight years to 702,000 in 2030, with a consequent drop in the number of primary school places that will be needed in the coming decade: 

  • 2022: 855,000 10 year-olds
  • 2023: 831,000
  • 2024: 813,000 
  • 2025: 807,000
  • 2026: 808,000
  • 2027: 783,000
  • 2028: 759,000
  • 2029: 730,000
  • 2030: 702,000

At the same time, the number of 18 year-olds will grow significantly reaching a peak in 2030 when that cohort of 855,000 will be 18, 15% more than the 741,000 of 18 year-olds in 2022. 

  • 2022: 741,000 18 year-olds 
  • 2023: 752,000
  • 2024: 781,000
  • 2025: 797,000
  • 2026: 824,000
  • 2027: 817,000
  • 2028: 826,000
  • 2029: 841,000
  • 2030: 855,000

The chart was prepared using the numbers of children estimated to be in the UK in 2020 adjusted for time growing up, but without adjustment for migration or the (fortunately) relatively small number of deaths that would be expected to occur over the course of the decade. 

Prior to Brexit and the pandemic, there was a net inflow of around 5,000 a year adding to each age group which, if repeated, would have the effect of reducing the rate of decline in 10 year-olds and increasing the size of the peak in 18 year-olds in 2030. However, with migration potentially having gone into reverse during the pandemic, it is unclear whether net immigration will be as high as it was before.

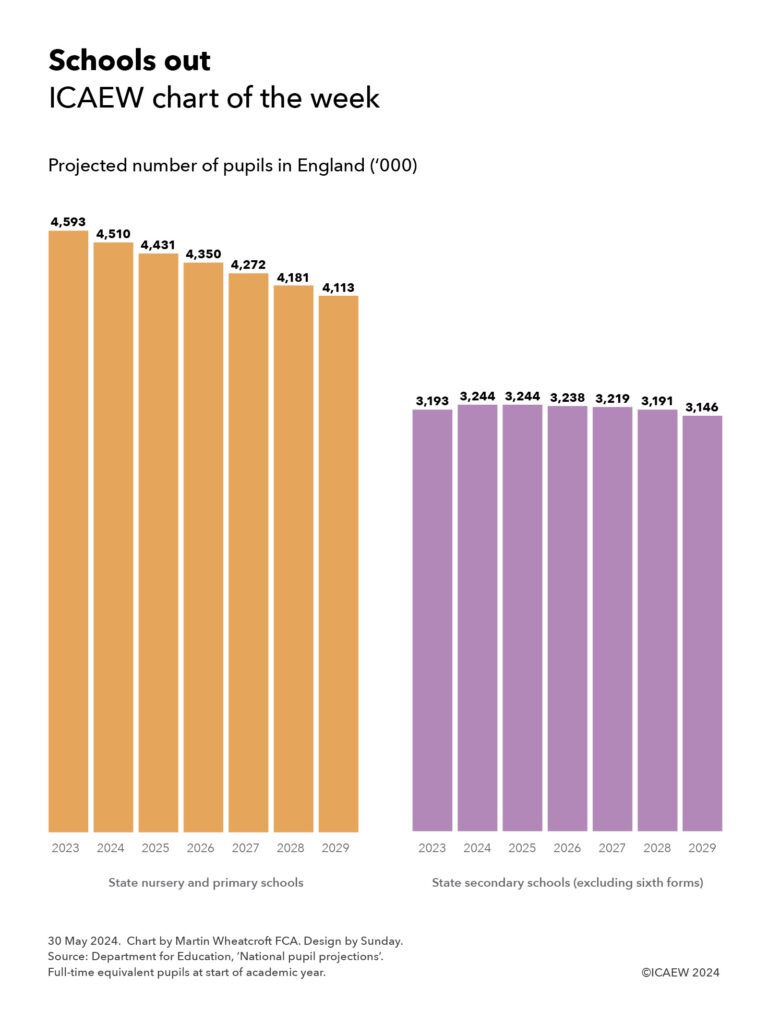
Either way, one of the first orders of business for new Education Secretary Nadhim Zahawi will be to review the plans to reduce primary school and expand secondary school provision over the next few years, as well as addressing the pressure there will be on universities, colleges and apprenticeships as the bulge of births in the mid-noughties flows through the education system over the coming decade.

This chart was originally published by ICAEW.