My chart for ICAEW this week highlights how the number of pensioners in the UK is expected to increase by 14% over the next 10 years. This will have major implications for the public finances.
The Office for National Statistics (ONS) published its latest population projections for the UK on 28 January 2025.
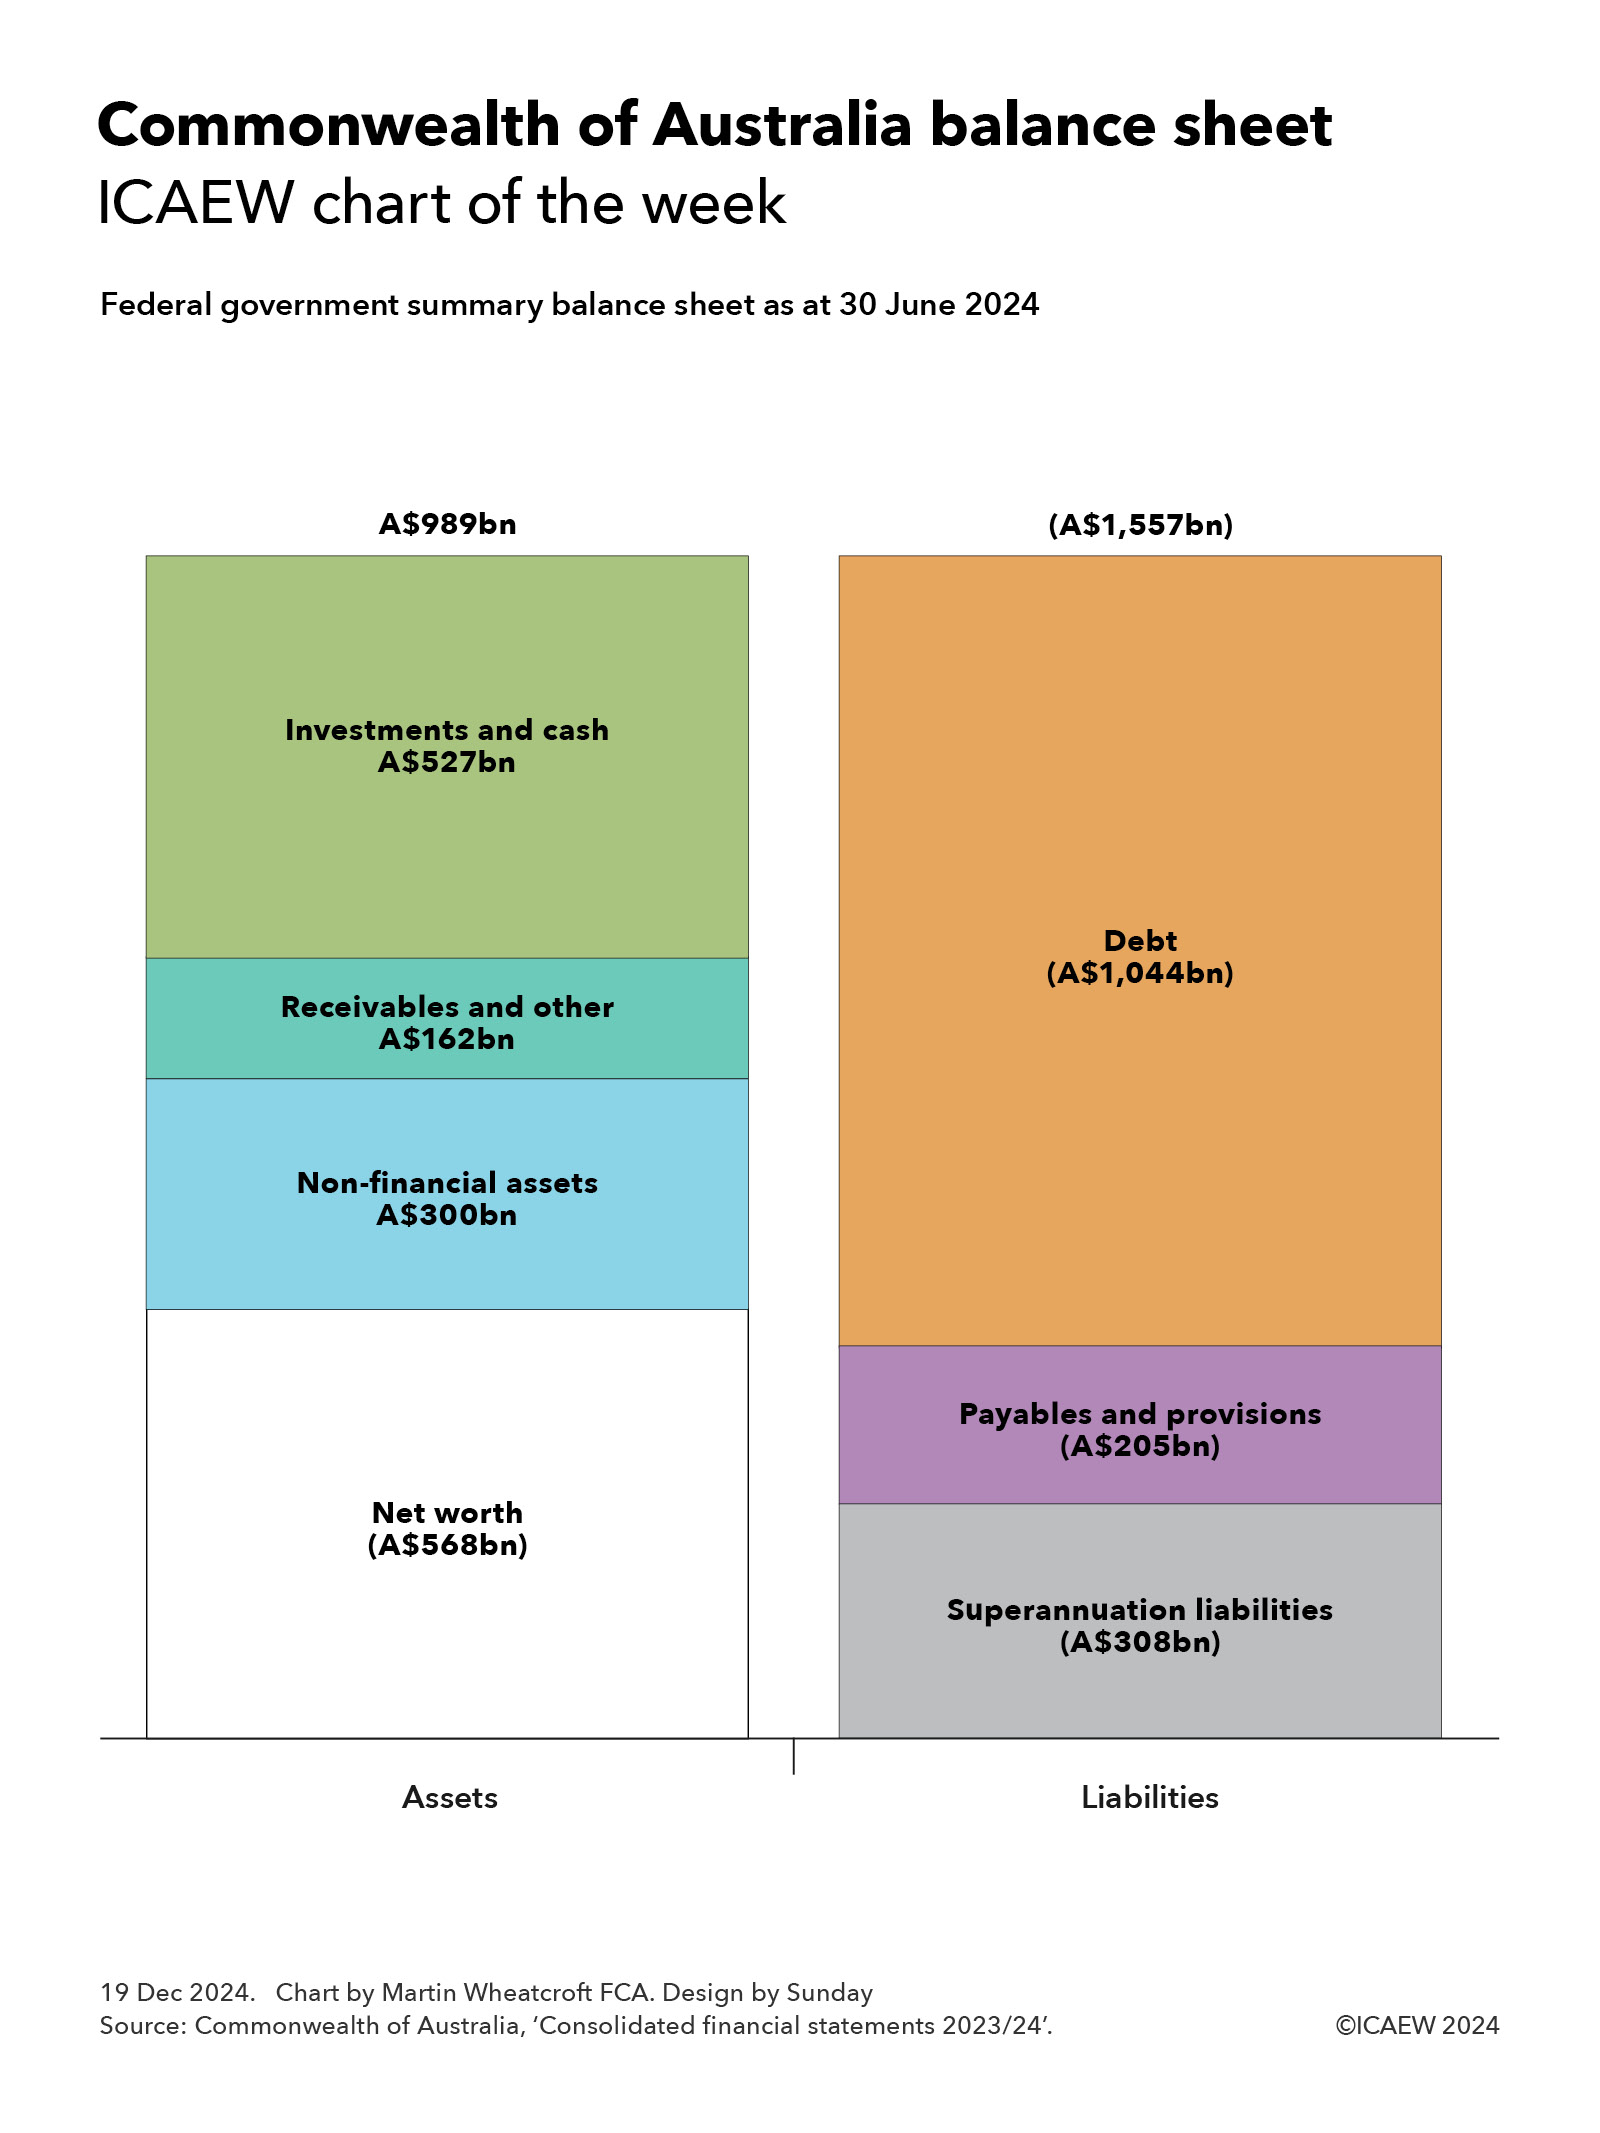
Extrapolated from the 2021 Census in England, Wales and Northern Ireland and the 2022 Census in Scotland, the ONS’s principal projection is for the UK population to increase by 5% over the next decade from a projected 69,868,000 in June 2025 to 73,426,000 in June 2035. This is on the basis of 132,000 more deaths than births in total over the next 10 years (6,979,000 versus 6,847,000) and net inward migration of 369,000 a year on average.
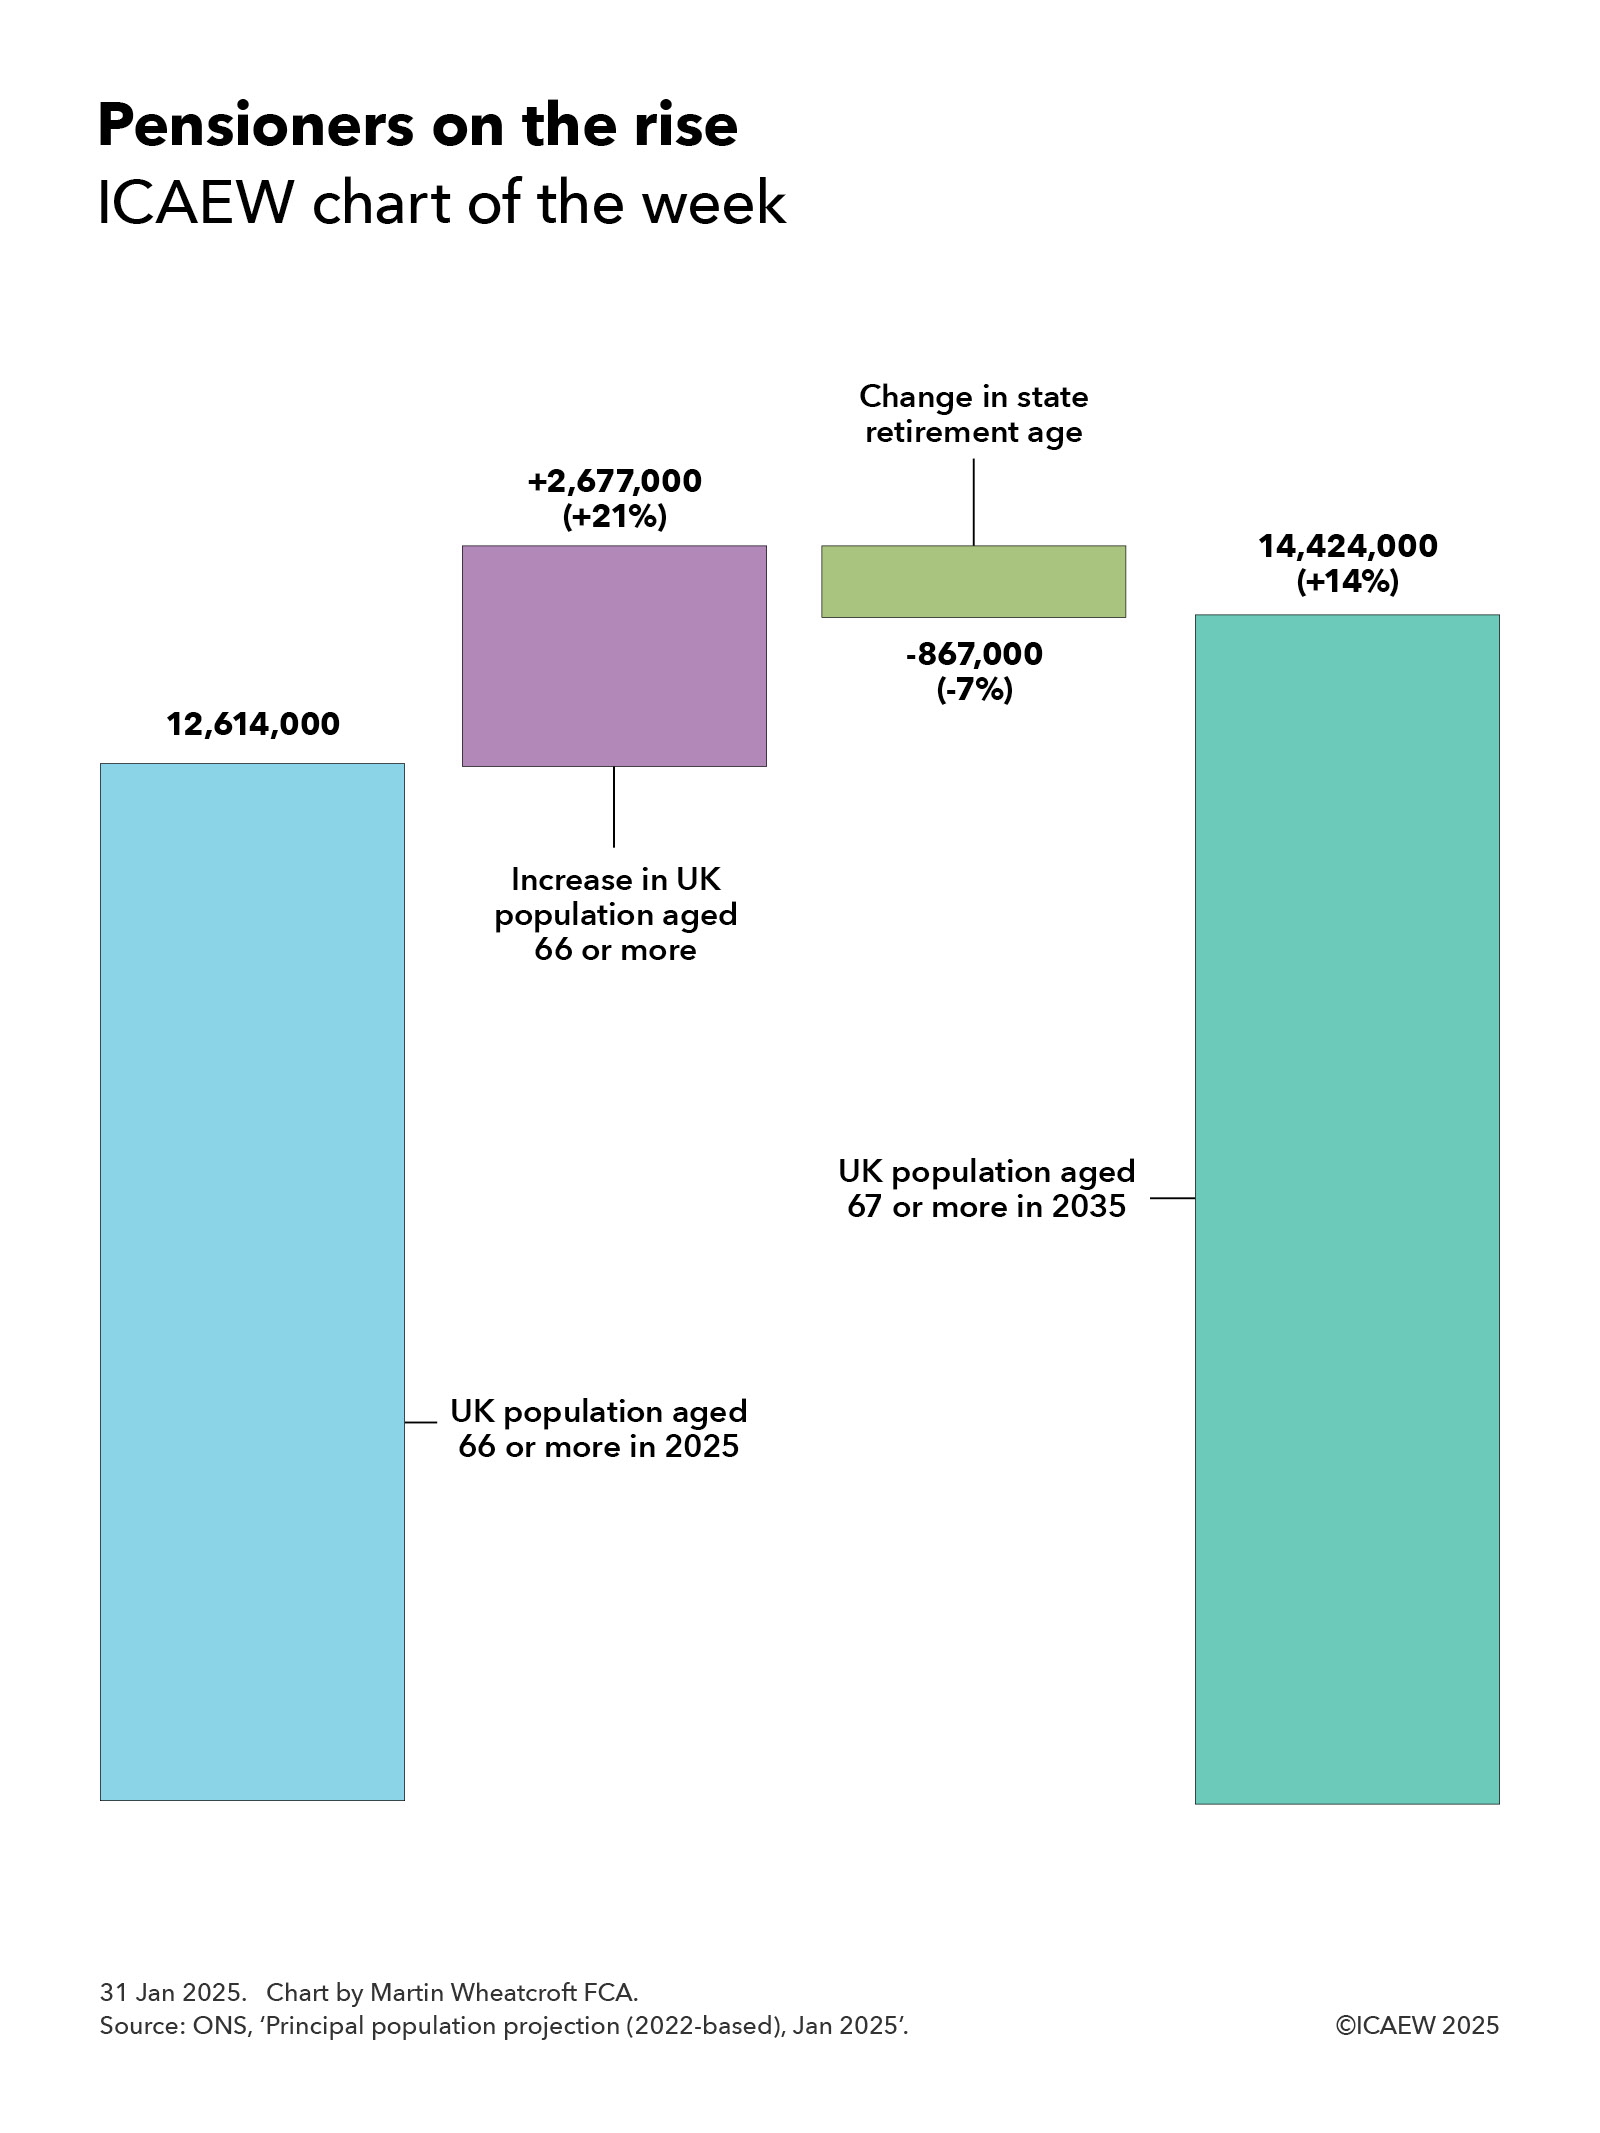
Our chart highlights how the number of pensioners is expected to increase by 14% over the next 10 years, from a projected 12,614,000 this summer to 14,424,000 in 2035, despite an increase in the state retirement age from 66 to 67.
The main driver of this increase is an additional 2,677,000 people aged 66 or more, reflecting 8,522,000 people passing the age of 66 over the 10 years to June 2035, plus 28,000 from net inward migration (119,000 in and 91,000 out), less 5,873,000 deaths
This 21% increase is partially offset by a 7% reduction for the 867,000 66-year-olds who will still be waiting for their state pension in June 2035 as a result of the planned rise in the state retirement age from 66 to 67 between 2026 and 2028.
Over the same period the ONS is projecting a 7% fall in the number of children from 12,272,000 in June 2025 to 11,434,000 in June 2035, and a 6% increase in the size of the working age population from 44,982,000 to 47,569,000. The latter would have been a 4% increase if not for the statutory increase in the state pension age to 67.
The ONS stresses that its national population projections are not forecasts and do not attempt to predict potential changes in international migration in particular. It also notes that demographic assumptions for future fertility and mortality are based on observed demographic trends, which is no guarantee that these trends might not change in the future.
Despite those caveats, the projected increase in the number of pensioners is one of the more likely areas of the projections to turn into reality. This is because almost all of those future pensioners are alive today and already living in the country, while mortality rates tend to change gradually over time.
A much more significant factor relates to the ONS’s long-term assumption for net inward migration of 340,000. While this is unlikely to affect the anticipated number of pensioners in a decade’s time, it will have a significant impact on the projected ratio between the number of pensioners and those of working age.
Either way, the projected rise in the number of pensioners compared with the size of the working-age population over the coming decade will have major implications for the public finances.
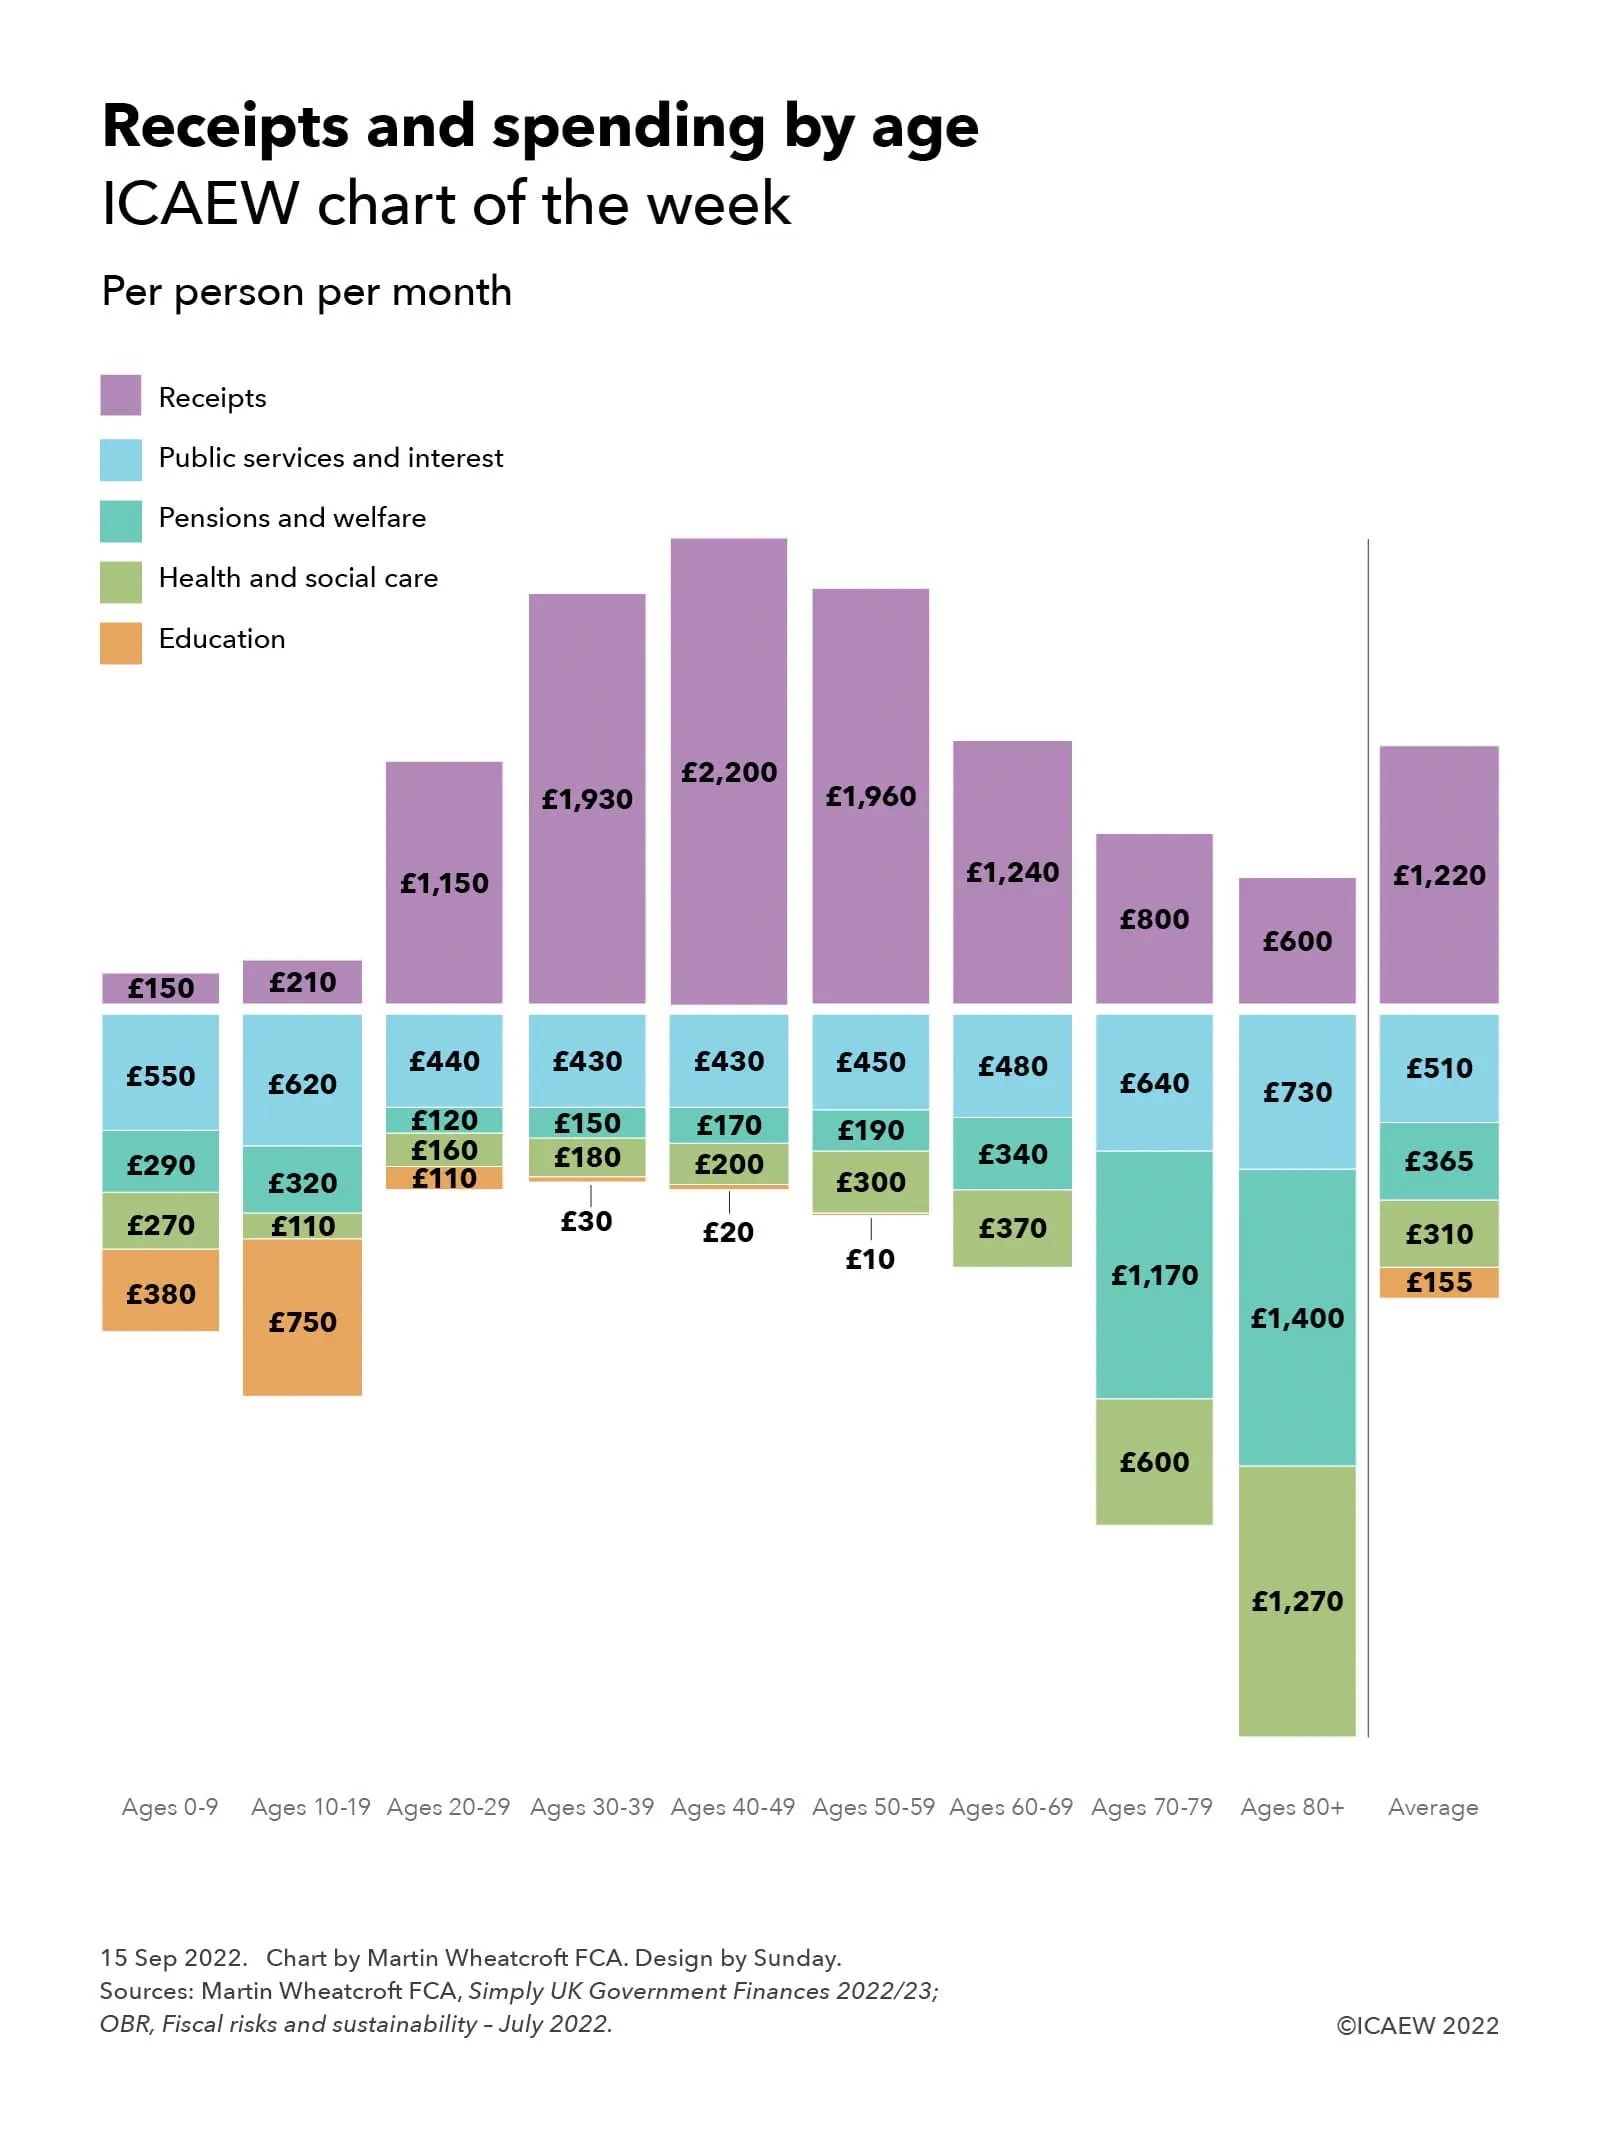
Tax receipts will fall proportionately as retirees leave the workforce faster than new workers join. State pension payments will increase, even before taking account of the ratchet effect of the pension triple-lock on the amount payable to each pensioner. Health care and adult social care costs will rise substantially given how skewed these costs are to older generations. And pension credit, housing benefit and other welfare benefits that go to poorer pensioners are also likely to increase.
Successive governments, including the current administration, have worked on the basis that they should be able to afford the higher costs of many more people living for longer in retirement through a combination of gradual rises in the state pension age (long hoped for but not delivered), higher levels of economic growth, and cuts in other areas of public spending such as the defence budget.
With the number of pensioners increasing much faster than the government can raise the state pension age (given the decade or more advance notice that needs to be given), relatively low levels of economic growth even in more optimistic scenarios, calls for an increase in the defence budget and significant cost pressures affecting many other public services, the big question will be the extent to which taxes will have to go up even further over the next 10 years if the promises made by successive governments over the last century are to be kept.
Read more: ONS’s national population projections.