My chart for ICAEW this week looks at the cost of government borrowing by country based on 10-year government bond yields.
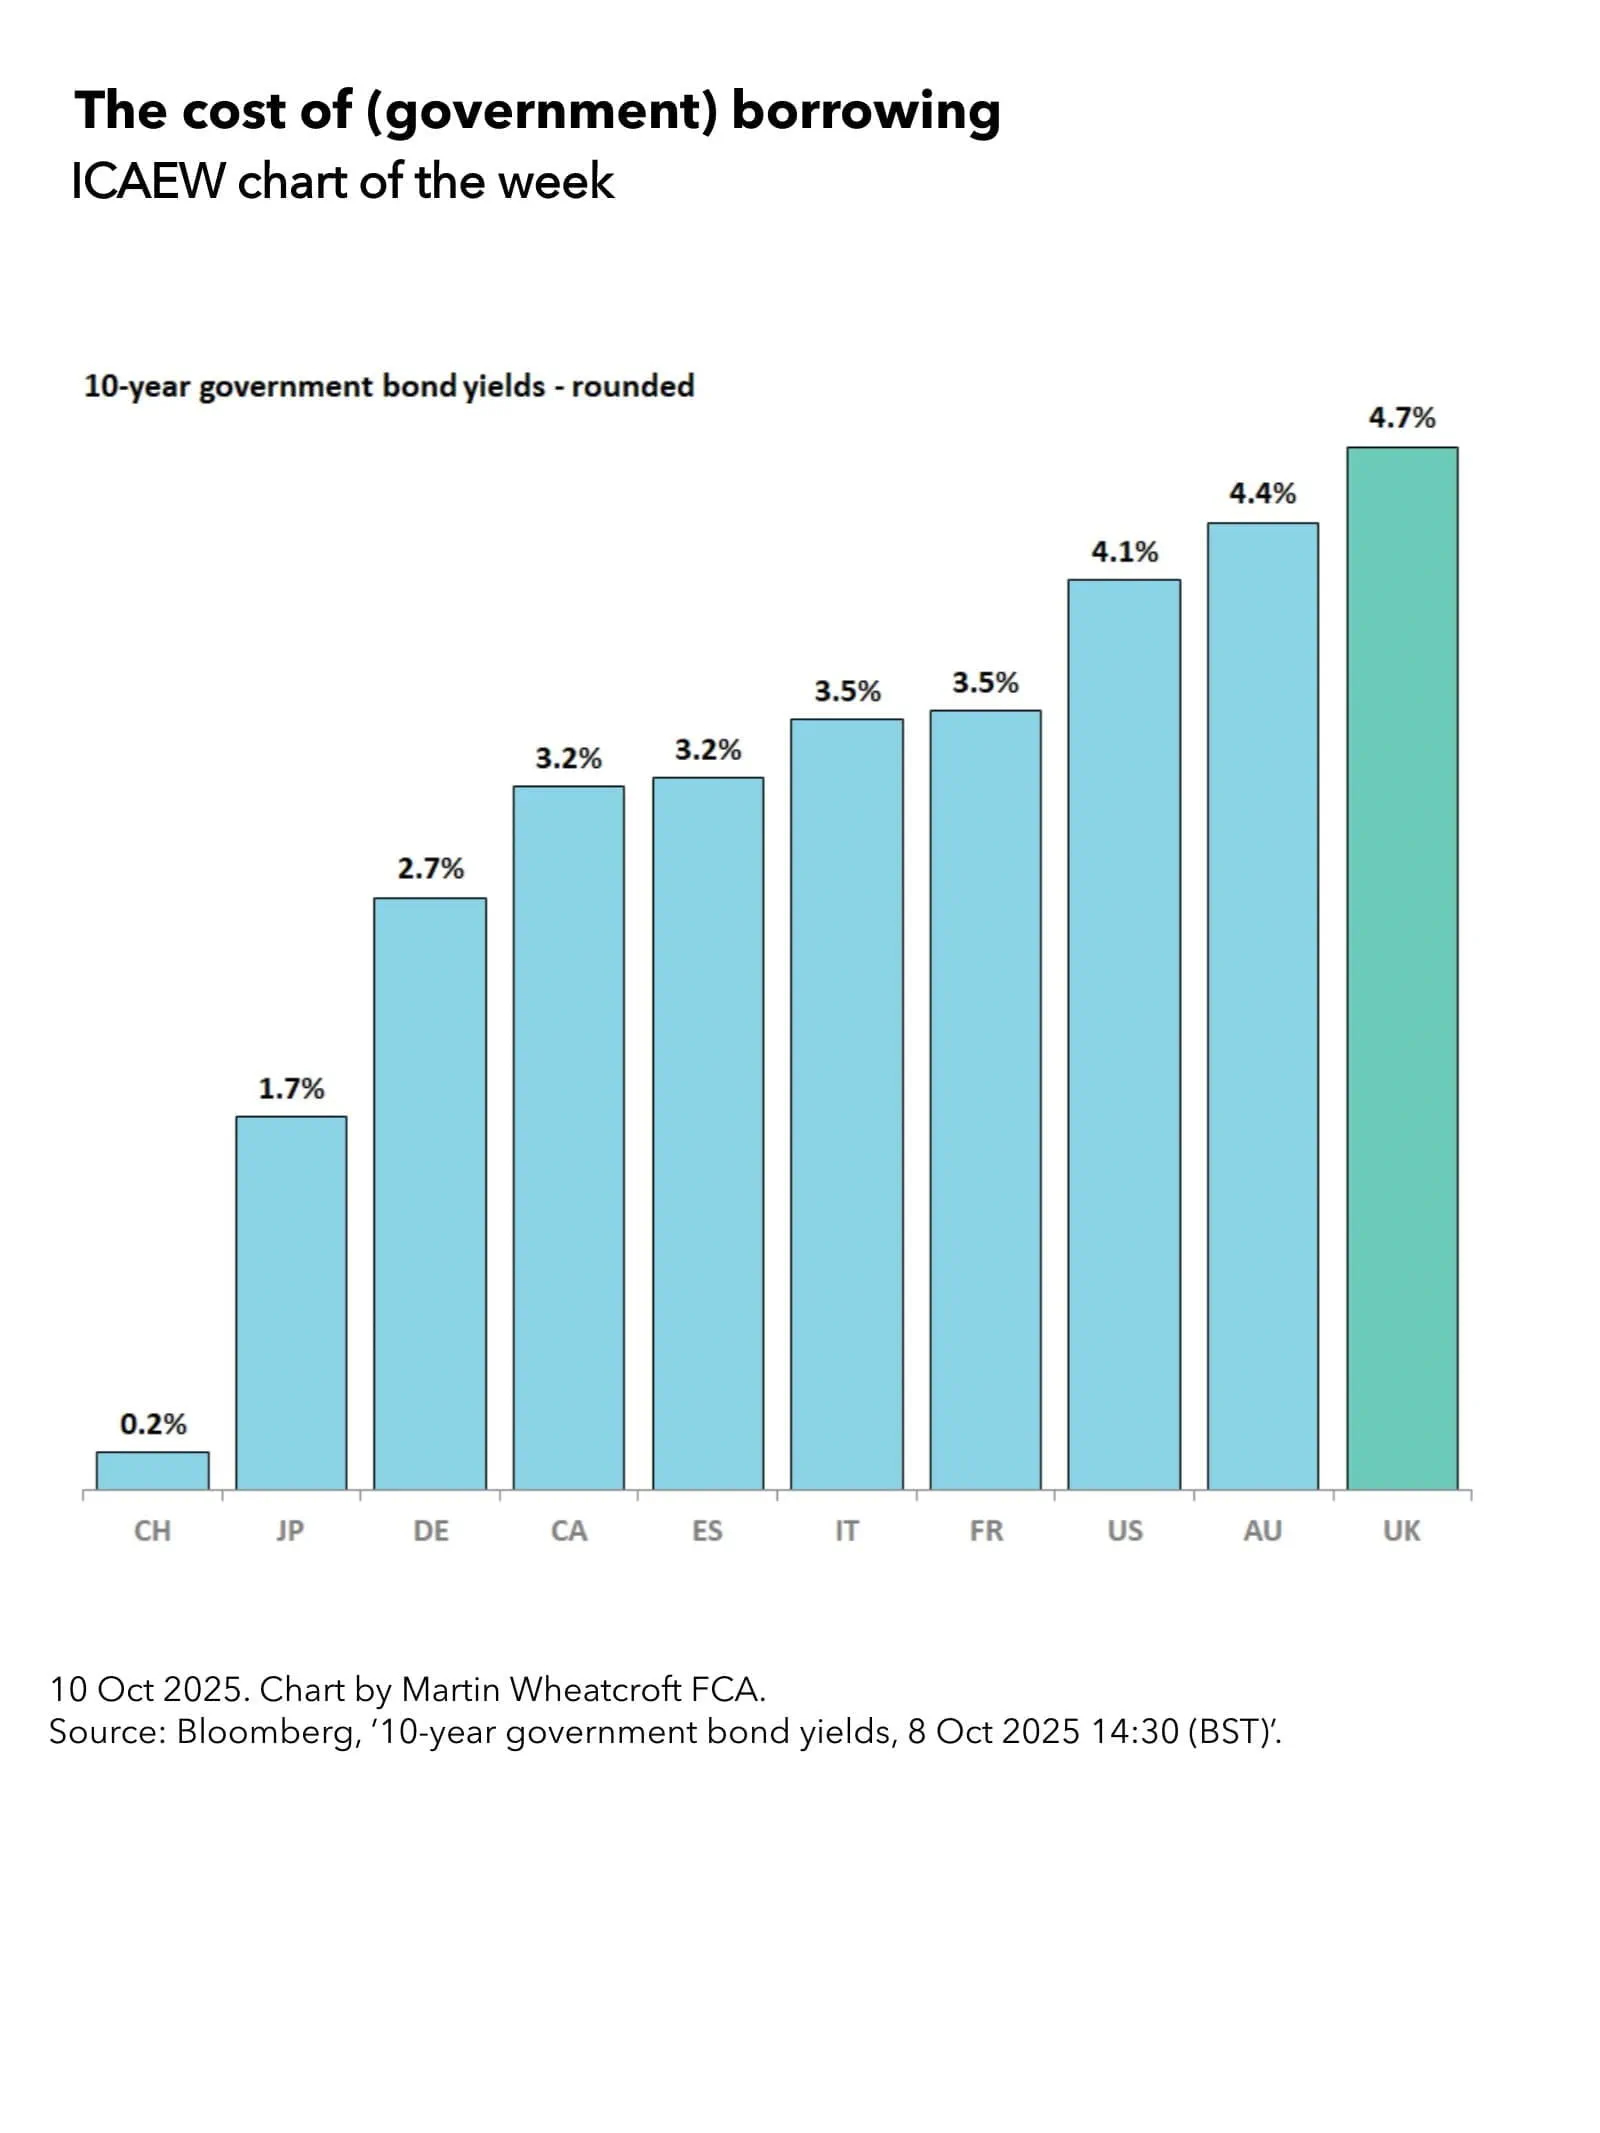
The calculated yield on 10-year UK government gilts on Wednesday 8 October 2025 at around 13:00 BST was 4.7% – the effective interest rate the government would need to pay if it had issued new debt at that time.
As my chart of the week for ICAEW illustrates, the UK now has the highest government borrowing cost among developed countries, compared with Switzerland 0.2%, Japan 1.7%, Germany 2.7%, Canada 3.2%, Spain 3.2%, Italy 3.5%, France 3.5%, the US 4.1% and Australia 4.4%.
With debt interest running at around 10% of total public expenditure, the cost of borrowing is a major issue for the Chancellor as she puts together the Autumn Budget 2025.
Reasons for the relatively high borrowing costs in the UK include persistently high inflation, growing public debt, an uncertain economic and fiscal outlook, the Bank of England’s quantitative tightening programme of selling its quantitative easing gilt holdings into the market, and reduced demand from debt investors.
This contrasts with Switzerland, where a strong currency, low public debt (around 37% of GDP), low inflation, and a lower-than-expected forecast for the fiscal deficit in 2025 permits the government to pay almost nothing to borrow at the moment.
Eurozone countries also pay less than the UK, even those with high debt levels such as Italy and France, with lower inflation (2.0% vs 3.8% in the UK in August 2025) being a major driver of lower yields on 10-year government bonds. Canada, with much stronger public finances than most developed countries but rising inflation and trade concerns, is paying more than Germany but approximately the same as Spain.
The US is currently paying 4.1% for new federal government borrowing, with rising inflation and growing fiscal deficits all contributing to a higher risk profile for debt investors. Australia is paying slightly more than the US despite much stronger public finances as it struggles to bring down inflation (3.0% in the year to August 2025).
Not shown on the chart are other countries with lower 10-year borrowing costs than the UK such as Singapore at 1.8%, the Netherlands at 2.8%, South Korea at 2.9%, Portugal at 3.1%, Greece at 3.3%, and New Zealand at 4.2%. There also countries with higher 10-year borrowing costs, including India at 6.5%, Mexico at 8.8%, and Brazil at 14.0%.
For the UK, the headlines have tended to focus on the 5.5% yield payable on 30-year government gilts, but in practice the Debt Management Office is currently issuing very little long-dated debt. The majority of gilts by value are being issued for less than 10 years, reflecting an expectation (or hope) that medium- and long-term borrowing costs will come down over the next few years as inflation returns to target and the volume of quantitative tightening slows.
A substantial proportion of the £3.2tn that the UK public sector current owes (£2.9tn after deducting cash and liquid financial assets) was borrowed when interest rates were much lower, meaning the government is currently paying somewhere in the region of 3% on its debts overall.
Unfortunately, the need to issue £1.3tn in new debt over the next five years (around half to refinance existing debt as it falls due for repayment and another half to finance planned fiscal deficits, lending and working capital requirements) means that the average weighted effective interest rate on UK debt is likely to increase even as the Bank of England base rate (currently 4.0%) is expected to come down.