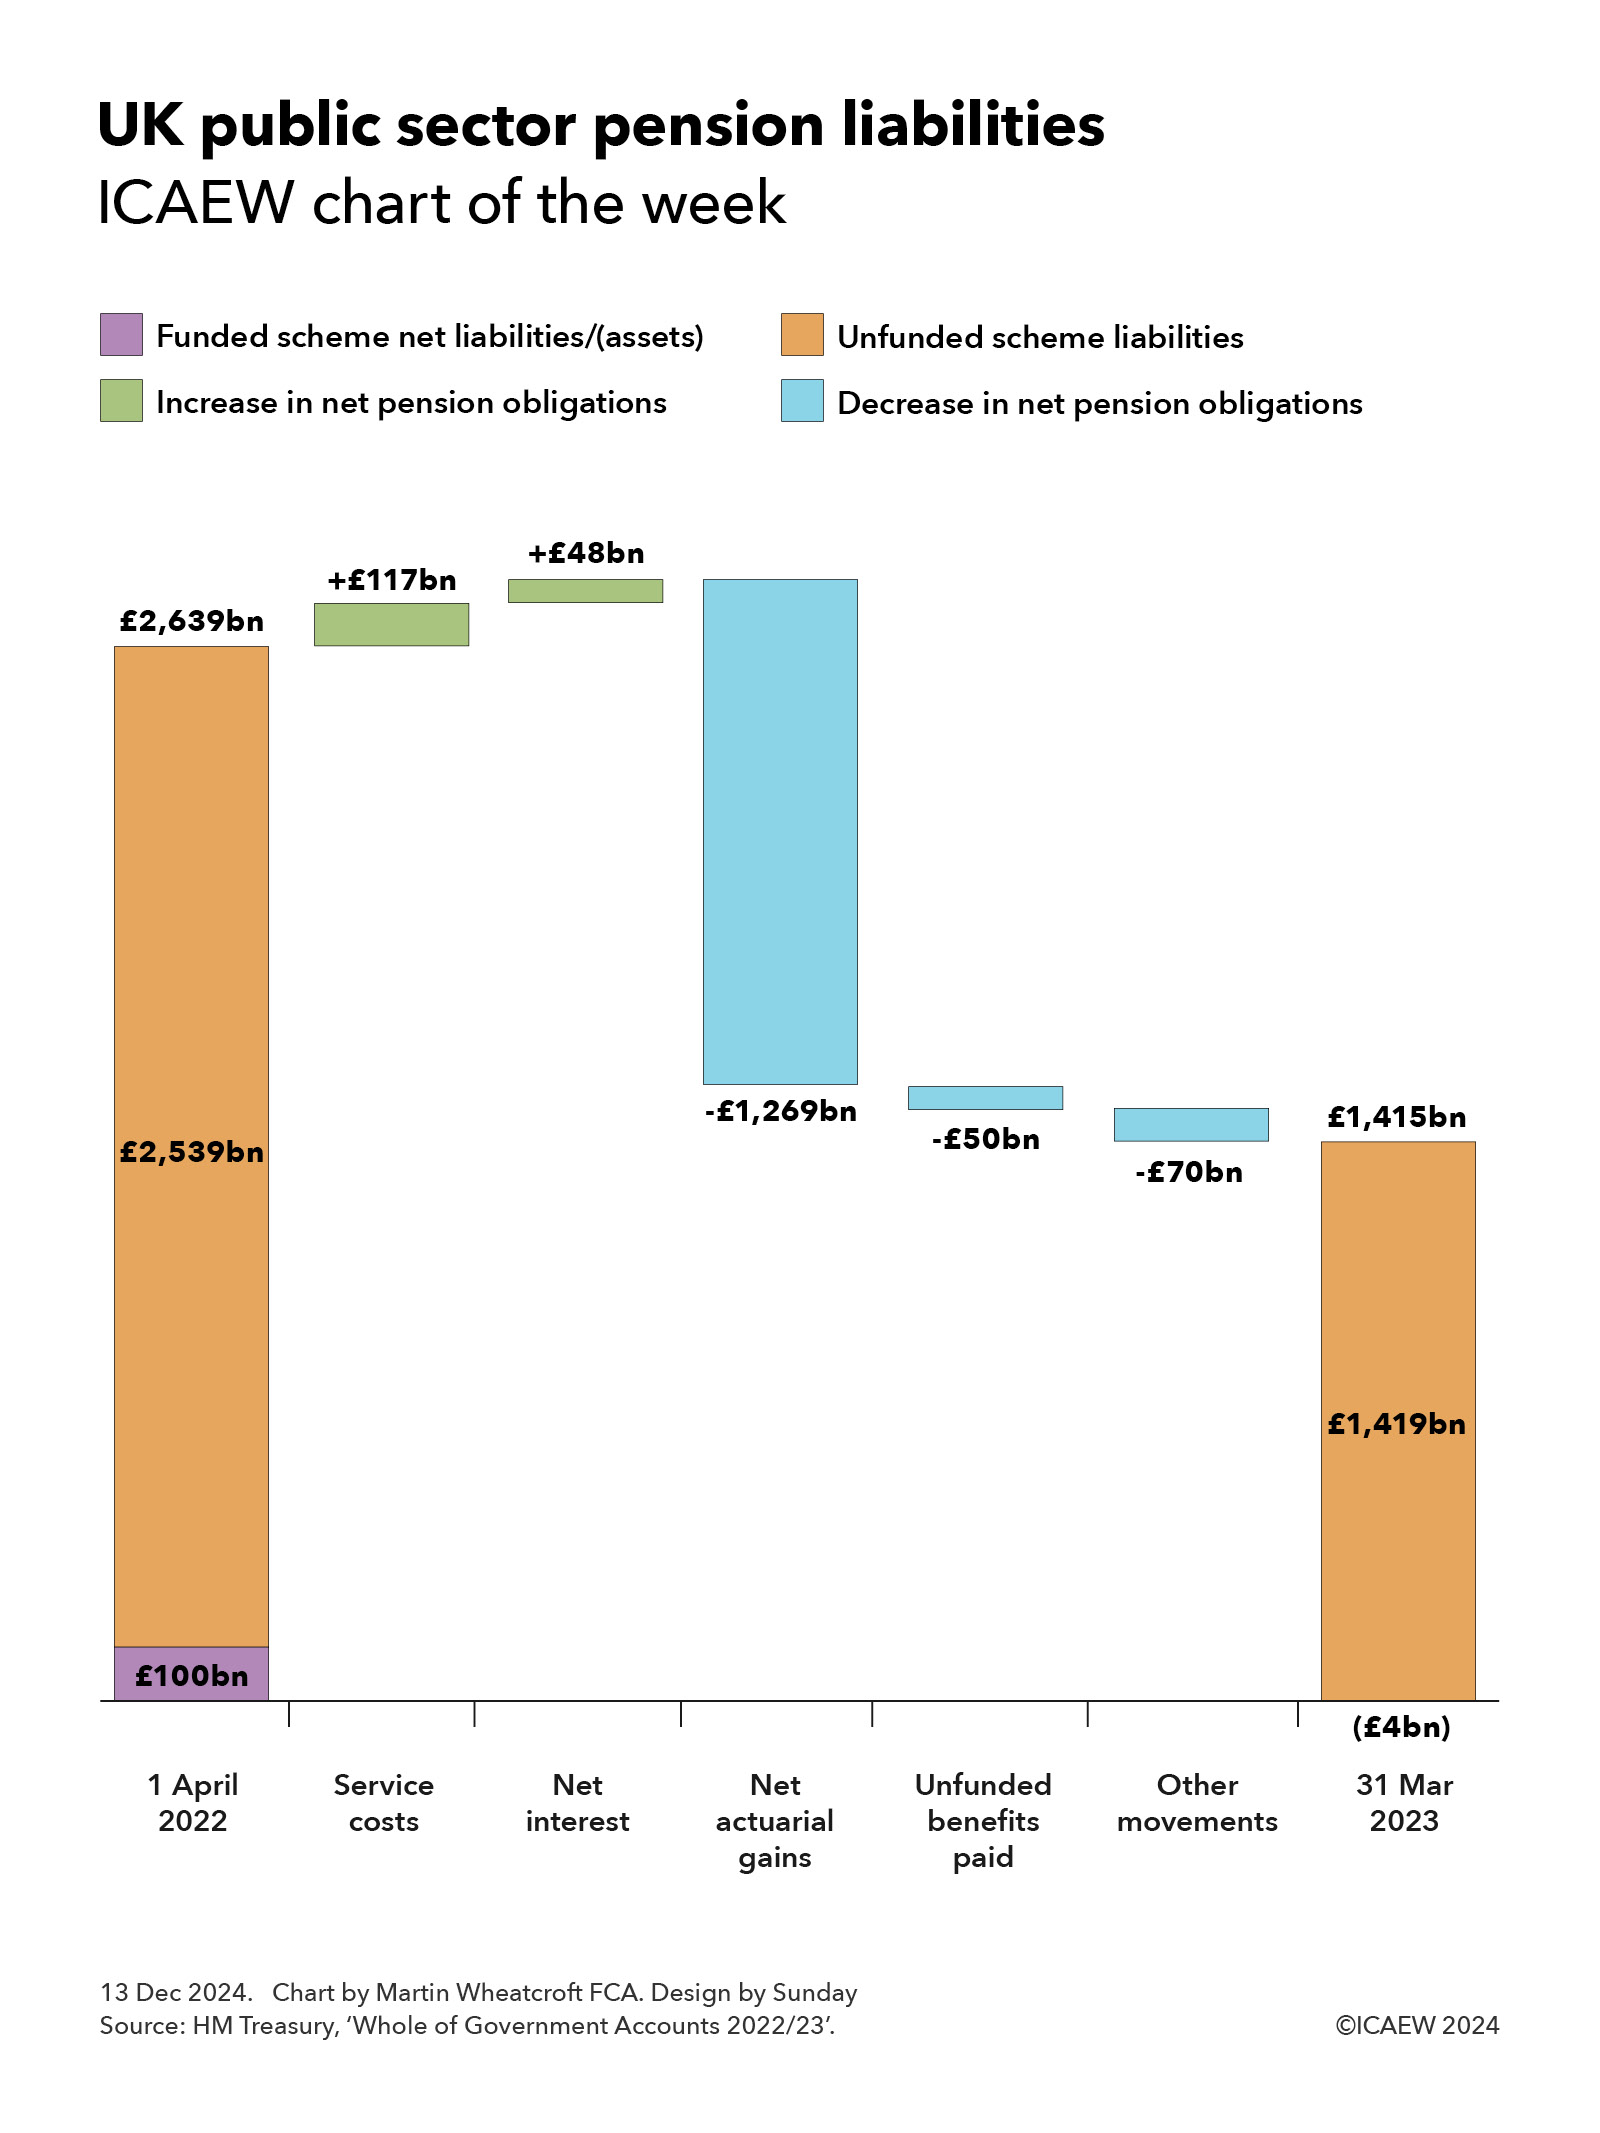
With President Trump planning to visit Fort Knox to check up on the US government’s gold reserves, my chart for ICAEW this week looks at just how much gold is owned by governments around the world.
According to the latest statistics from the World Gold Council, sourced principally from the International Monetary Fund (IMF), governments and international financial institutions around the world own 35,864 tonnes of gold. Much of this gold sits in the Bank of England, Fort Knox and in central bank vaults around the world.
At a price of around £74 per gram, the total value of ‘government gold’ adds up to somewhere in the region of £2.7trn. This is estimated to be around one-sixth of the total above-ground stock of gold in the world.
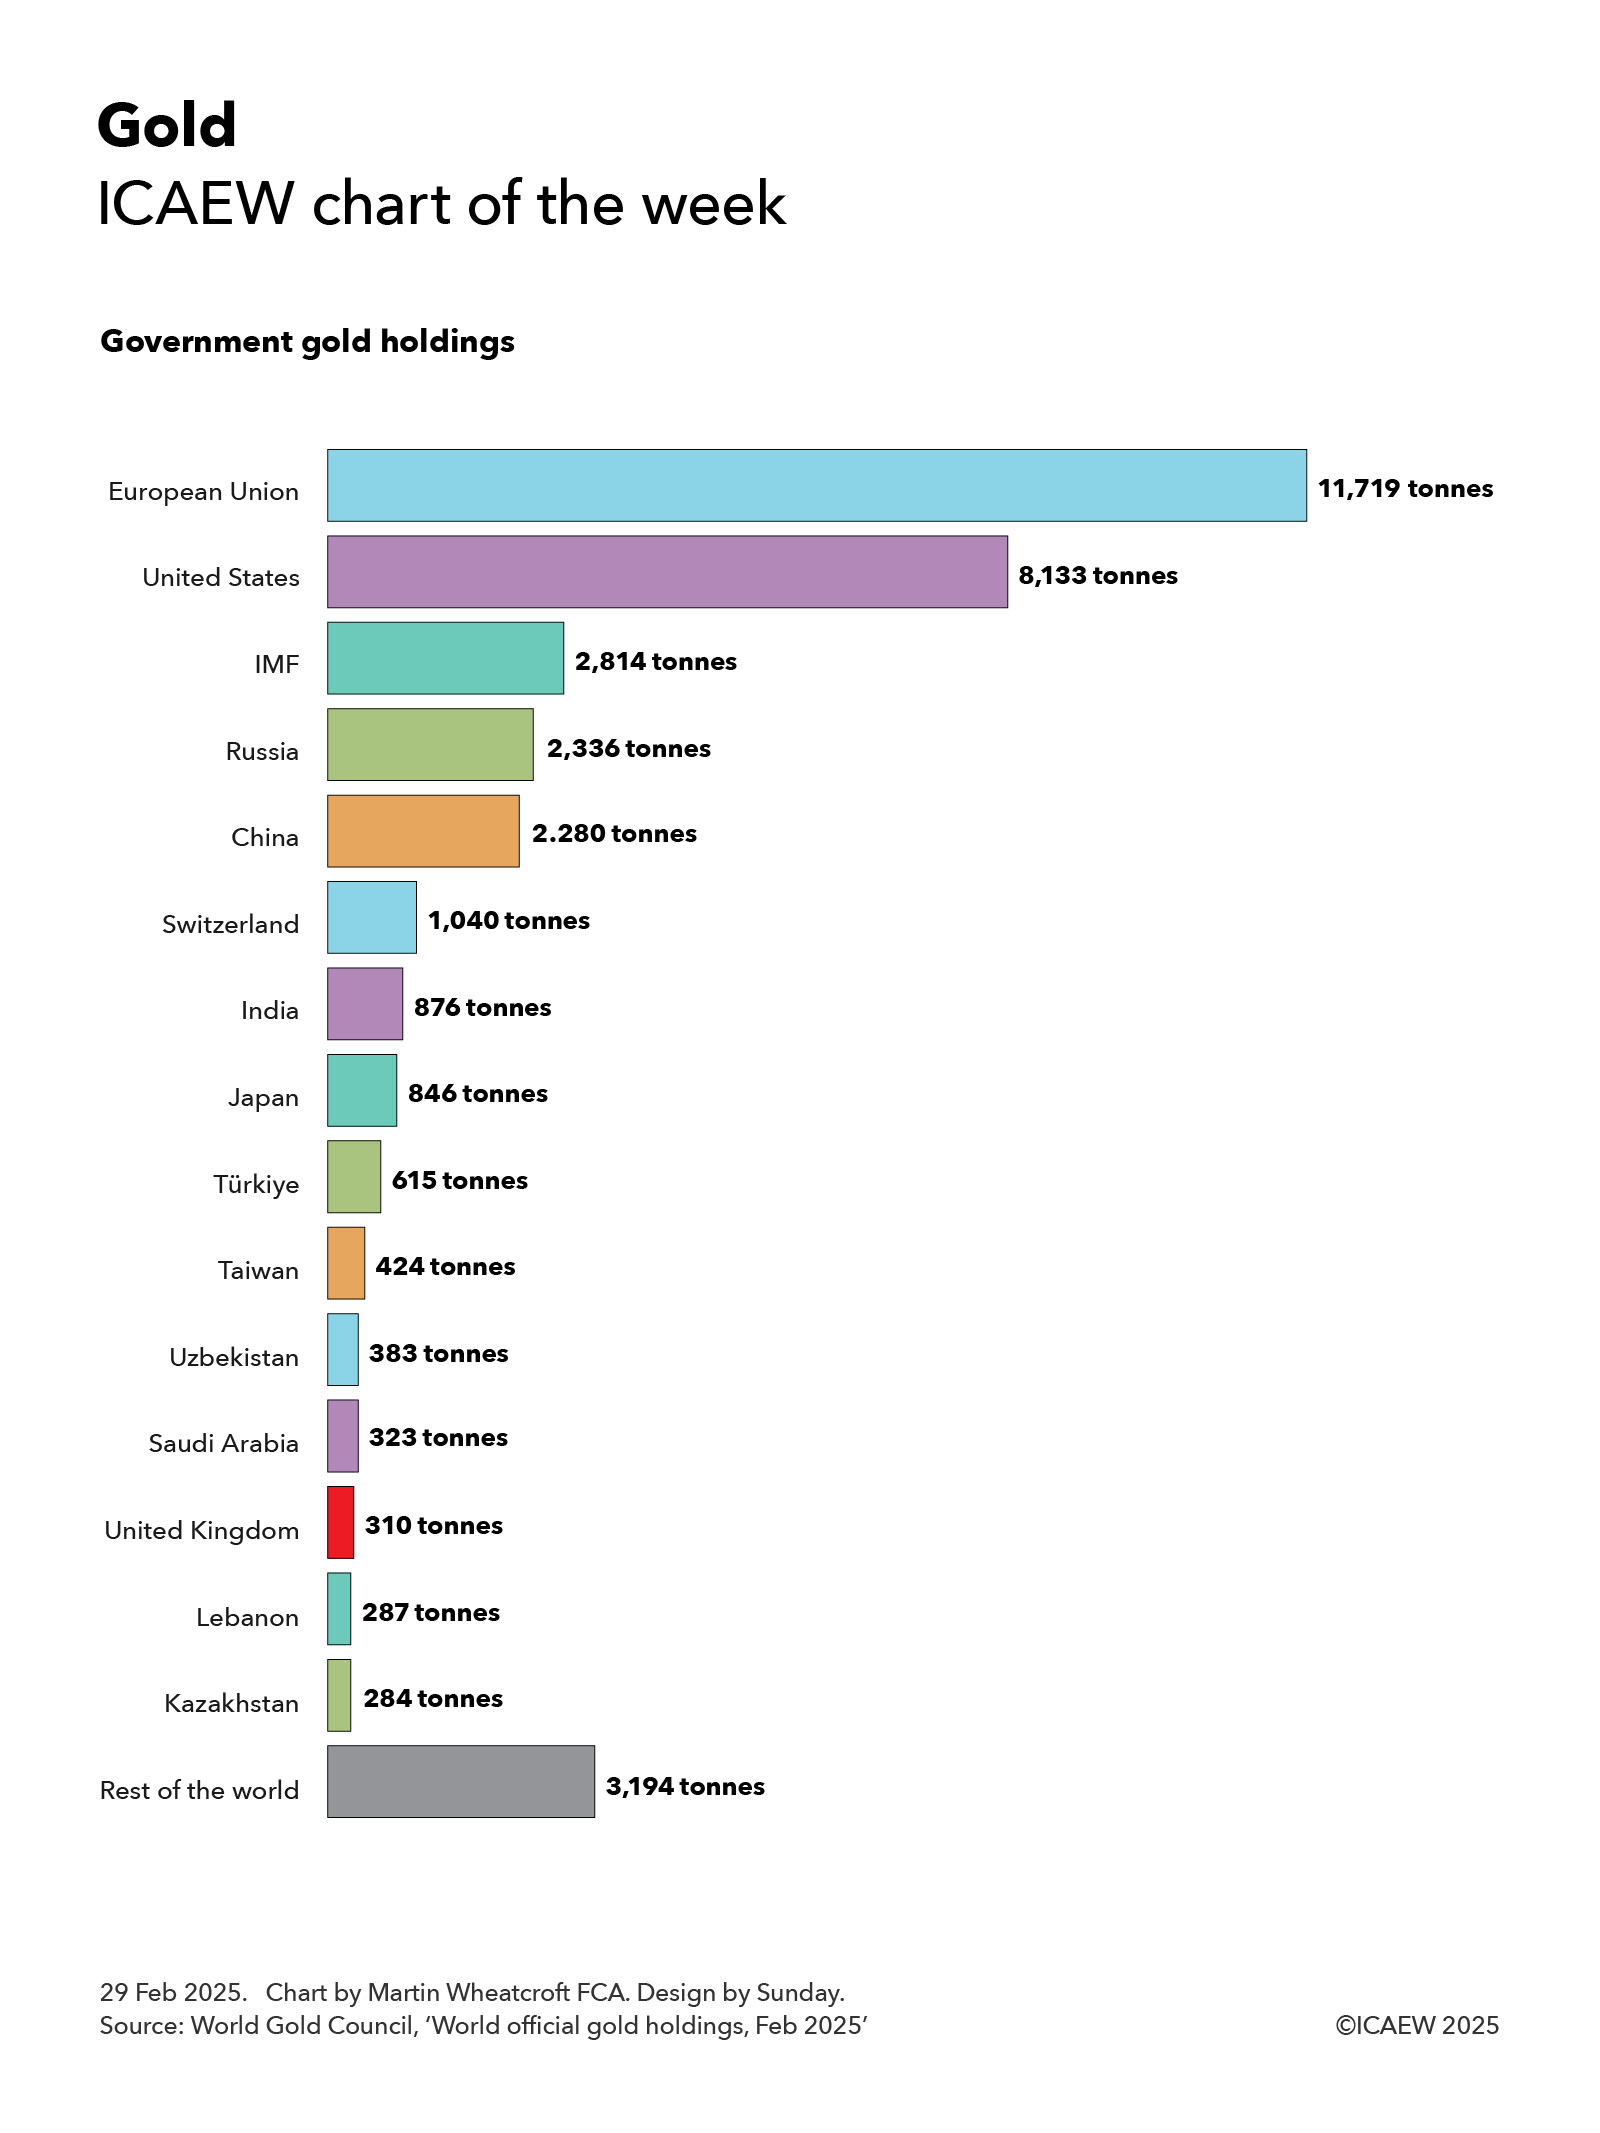
While the US is the largest individual holder of official gold reserves with 8,133 tonnes of gold worth around £600bn, the 27 countries of the EU and the European Central Bank collectively own a total of 11,719 tonnes of gold worth approximately £870bn. This includes Germany with 3,352 tonnes, Italy 2,452 tonnes, France 2,437 tonnes, Netherlands 615 tonnes, the European Central Bank 507 tonnes, Poland 448 tonnes, Portugal 383 tonnes, Spain 282 tonnes, Austria 280 tonnes, Belgium 227 tonnes, Sweden 126 tonnes, Greece 115 tonnes, Hungary 110 tonnes, Romania 104 tonnes and other EU member states with 281 tonnes.
The next biggest holder of gold is the IMF with 2,814 tonnes (worth around £210bn), followed by Russia with 2,336 tonnes (£175bn), China 2,280 tonnes (£170bn), Switzerland 1,040 tonnes (£77bn), India 876 tonnes (£65bn), Japan 846 tonnes (£63bn), Türkiye 615 tonnes (£46bn), Taiwan 424 tonnes (£31bn), Uzbekistan 383 tonnes (£28bn), Saudi Arabia 323 tonnes (£24bn), the UK 310 tonnes (£23bn), Lebanon 287 tonnes (£21bn) and Kazakhstan 284 tonnes (£21bn).
The total for other countries adds up to 3,194 tonnes worth, or around £235bn or so, including Thailand 235 tonnes, Singapore 220 tonnes, Algeria 174 tonnes, Iraq 163 tonnes, Venezuela 161 tonnes, Libya 147 tonnes, Brazil 130 tonnes, Philippines 130 tonnes, Egypt 127 tonnes, South Africa 125 tonnes, Mexico 120 tonnes, Qatar 111 tonnes, South Korea 104 tonnes and the Bank for International Settlements 102 tonnes.
While the level of official gold holdings is partly driven by the economic size of the countries concerned, it also depends on their reserve strategies, with US, German, French and Italian gold holdings making up around 75%, 74%, 72% and 71% of their official reserves respectively, in contrast with 6%, 9%, 11% and 15% for China, Switzerland, India and the UK, for example.
President Trump’s plan to visit Fort Knox to personally inspect his nation’s gold holdings reflects one of the benefits of investing in a physical commodity such as gold – you can count gold bars, weigh them and check their purity, as well as admire its shiny quality. He may have a less satisfying experience in verifying any future strategic crypto-currency reserve, where entries in a ledger are somewhat more ephemeral.