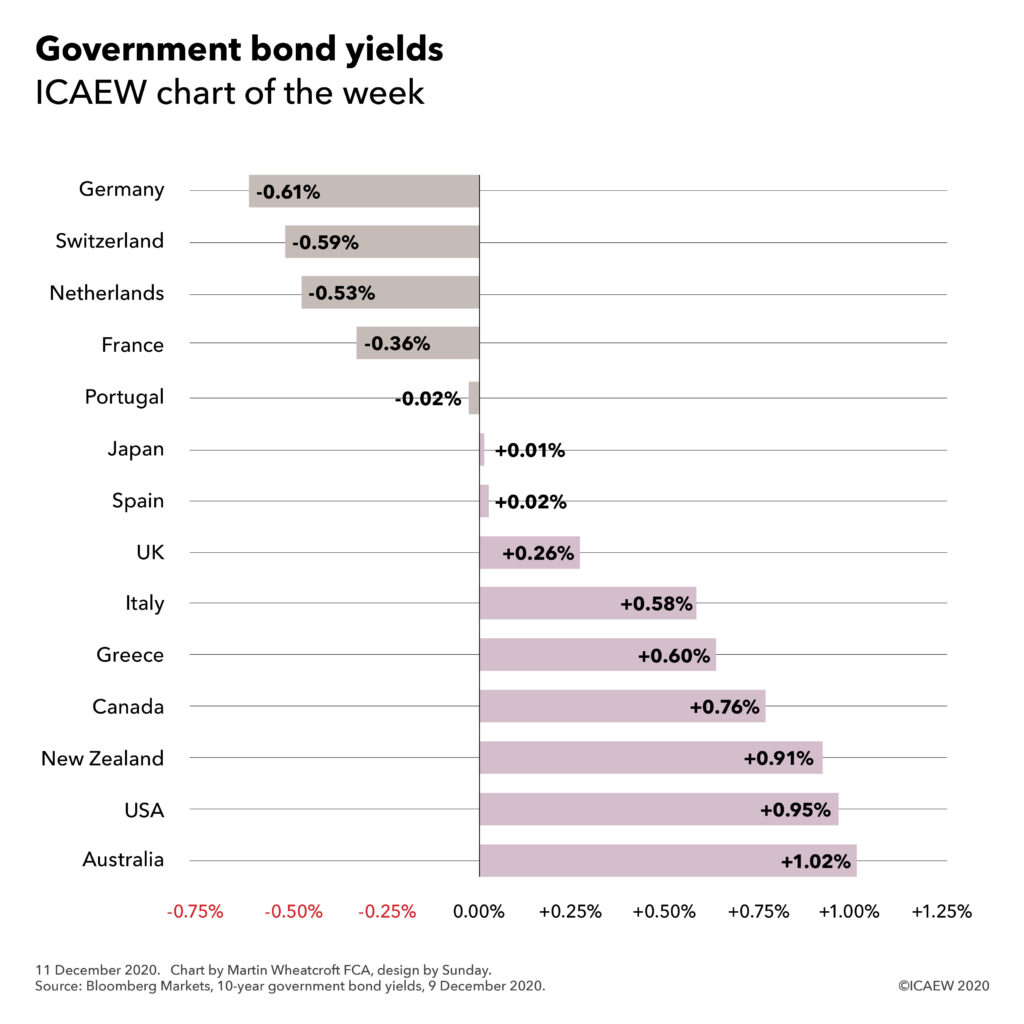
This week’s chart examines the complexity in the tax system and potential options for reform by looking at the number of tax bands for salaried employees across the UK.
The new tax year saw the introduction of an additional tax band to the UK system of personal taxation, bringing the total number to nine tax bands in England, Wales and Northern Ireland and twelve in Scotland.
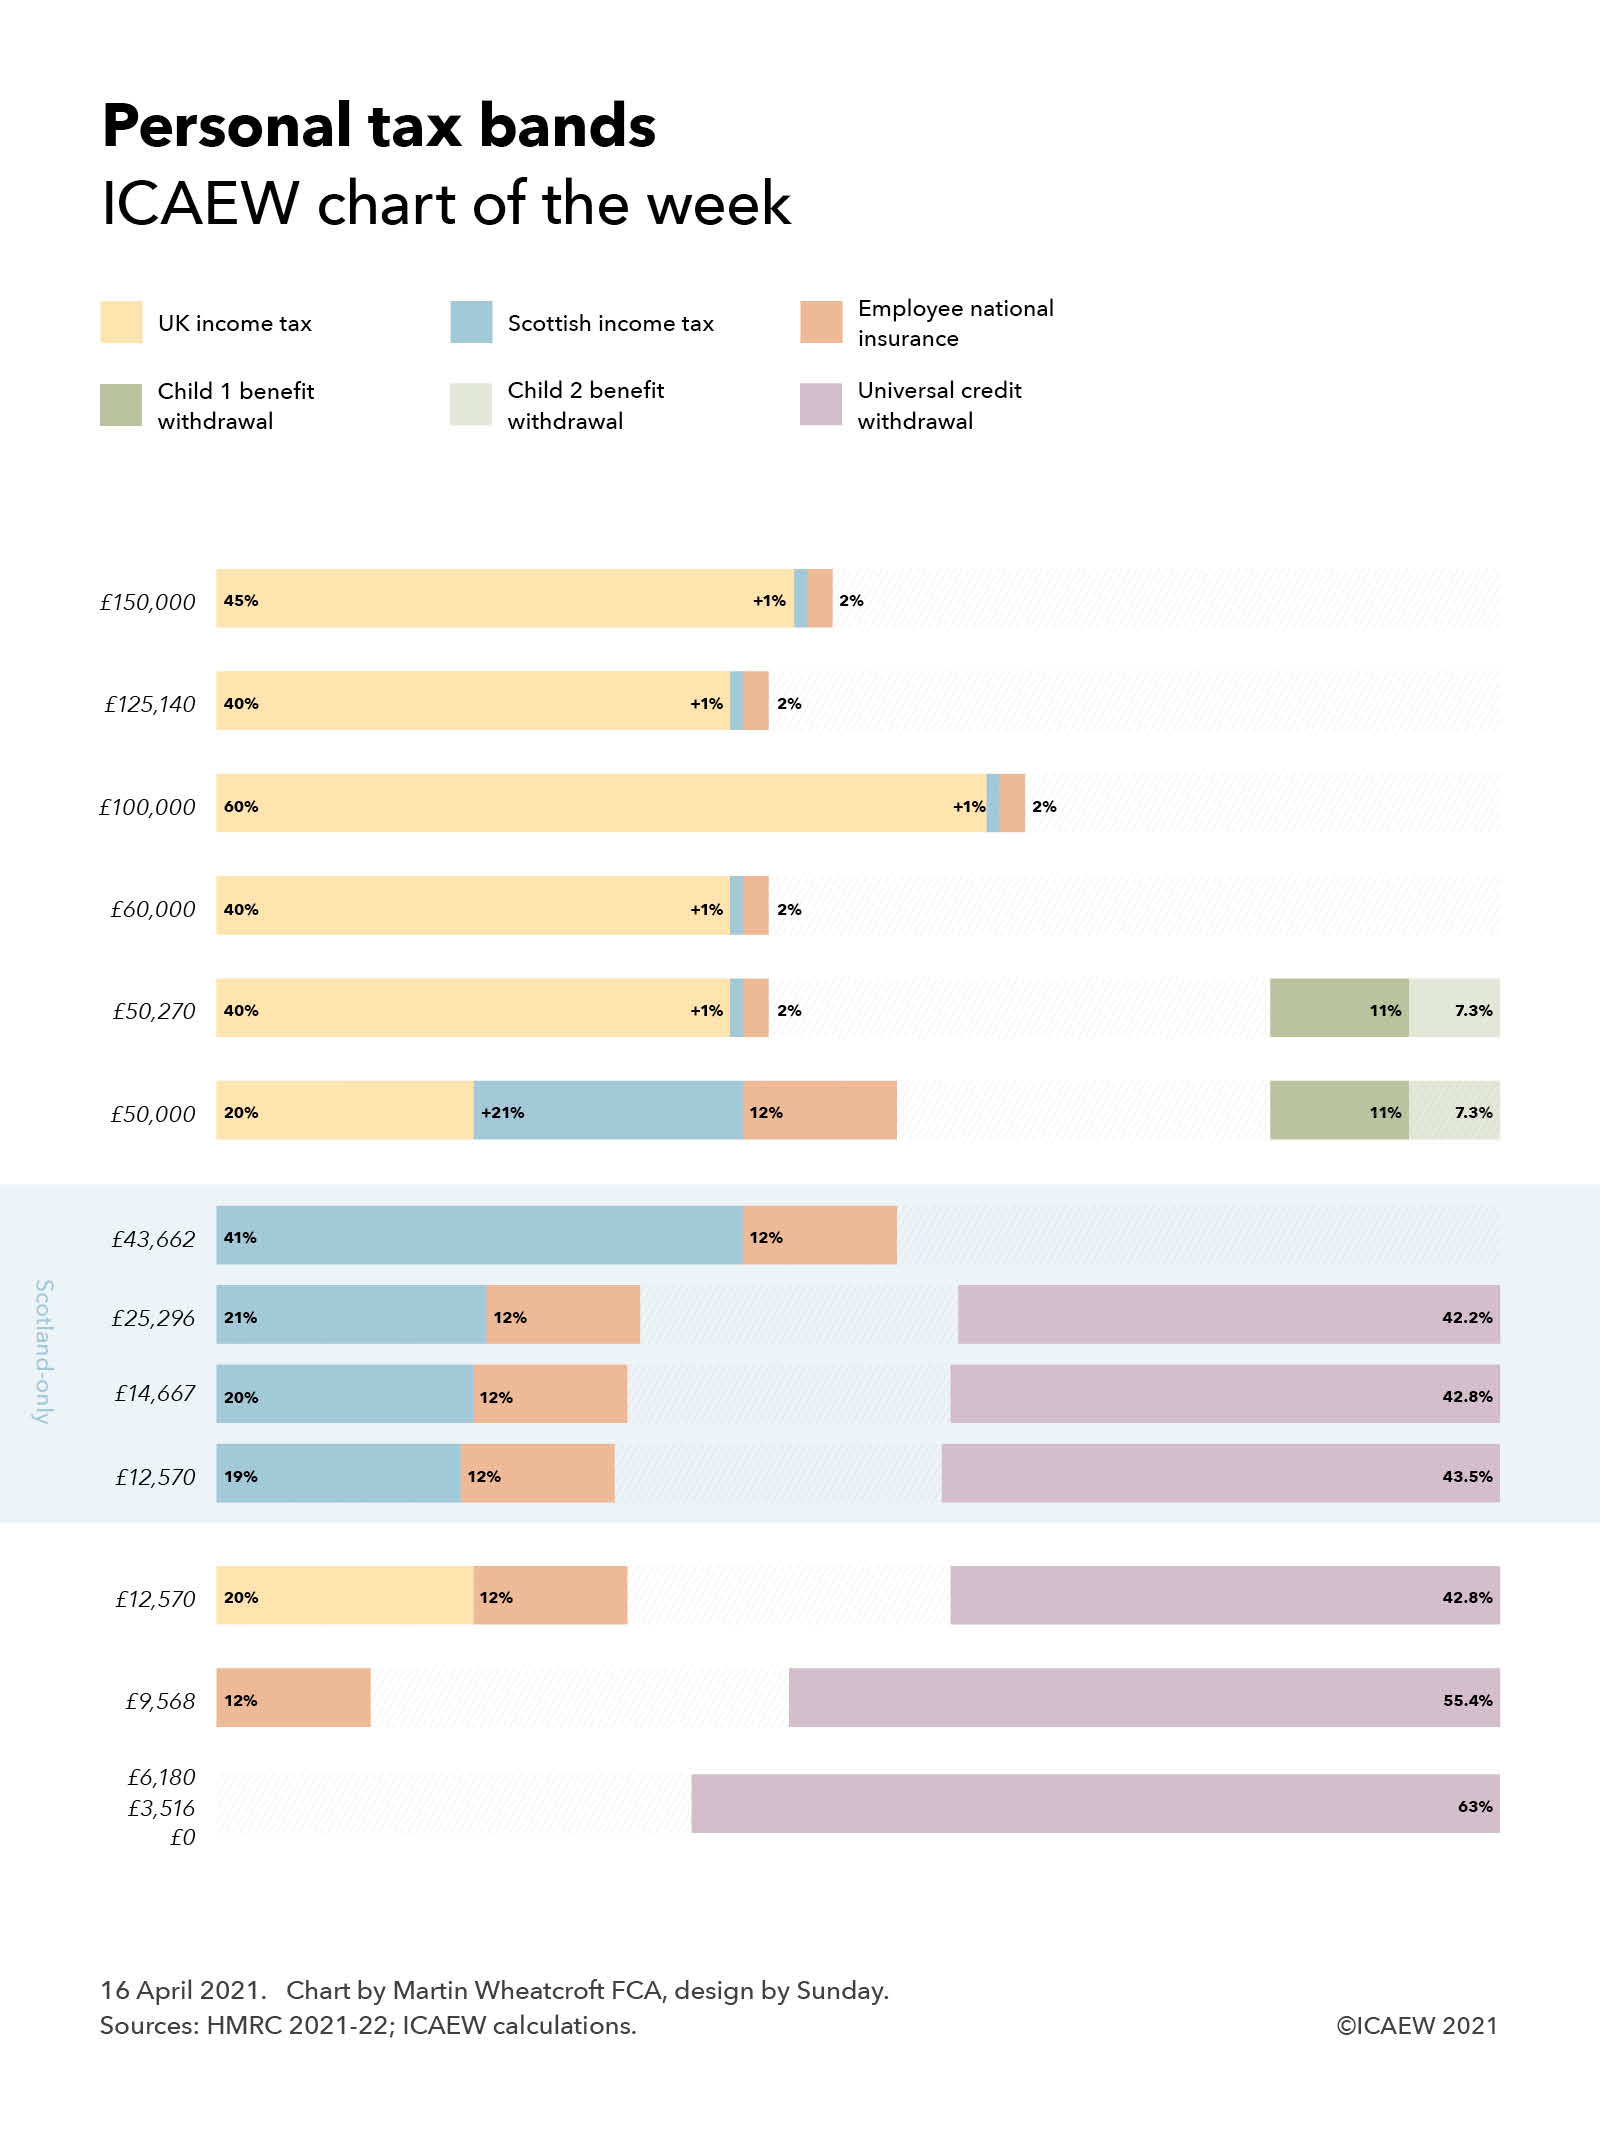
The #icaewchartoftheweek continues on the theme of complexity in the tax system and potential options for tax reform by looking at the number of tax bands for salaried employees, with up to nine tax bands in England, Wales and Northern Ireland and up to twelve in Scotland.
Although the advertised personal tax allowance of £12,570 a year suggests that individuals only start to pay tax above that point, in practice ‘taxation’ in its wider sense can start from as little as £0, which is when some of those claiming universal credit start to have their benefits withdrawn at a rate of 63p in the pound. The threshold is £0 for those without dependent children, £3,516 for those on housing benefit and with dependent children or limited capability to work, or £6,180 for those with dependent children or limited capability to work who are not on housing benefit. The rate of withdrawal is even higher for those receiving council tax benefit, with an additional 20% or more levied on incomes above a certain level until it is fully clawed back – the details vary by council.
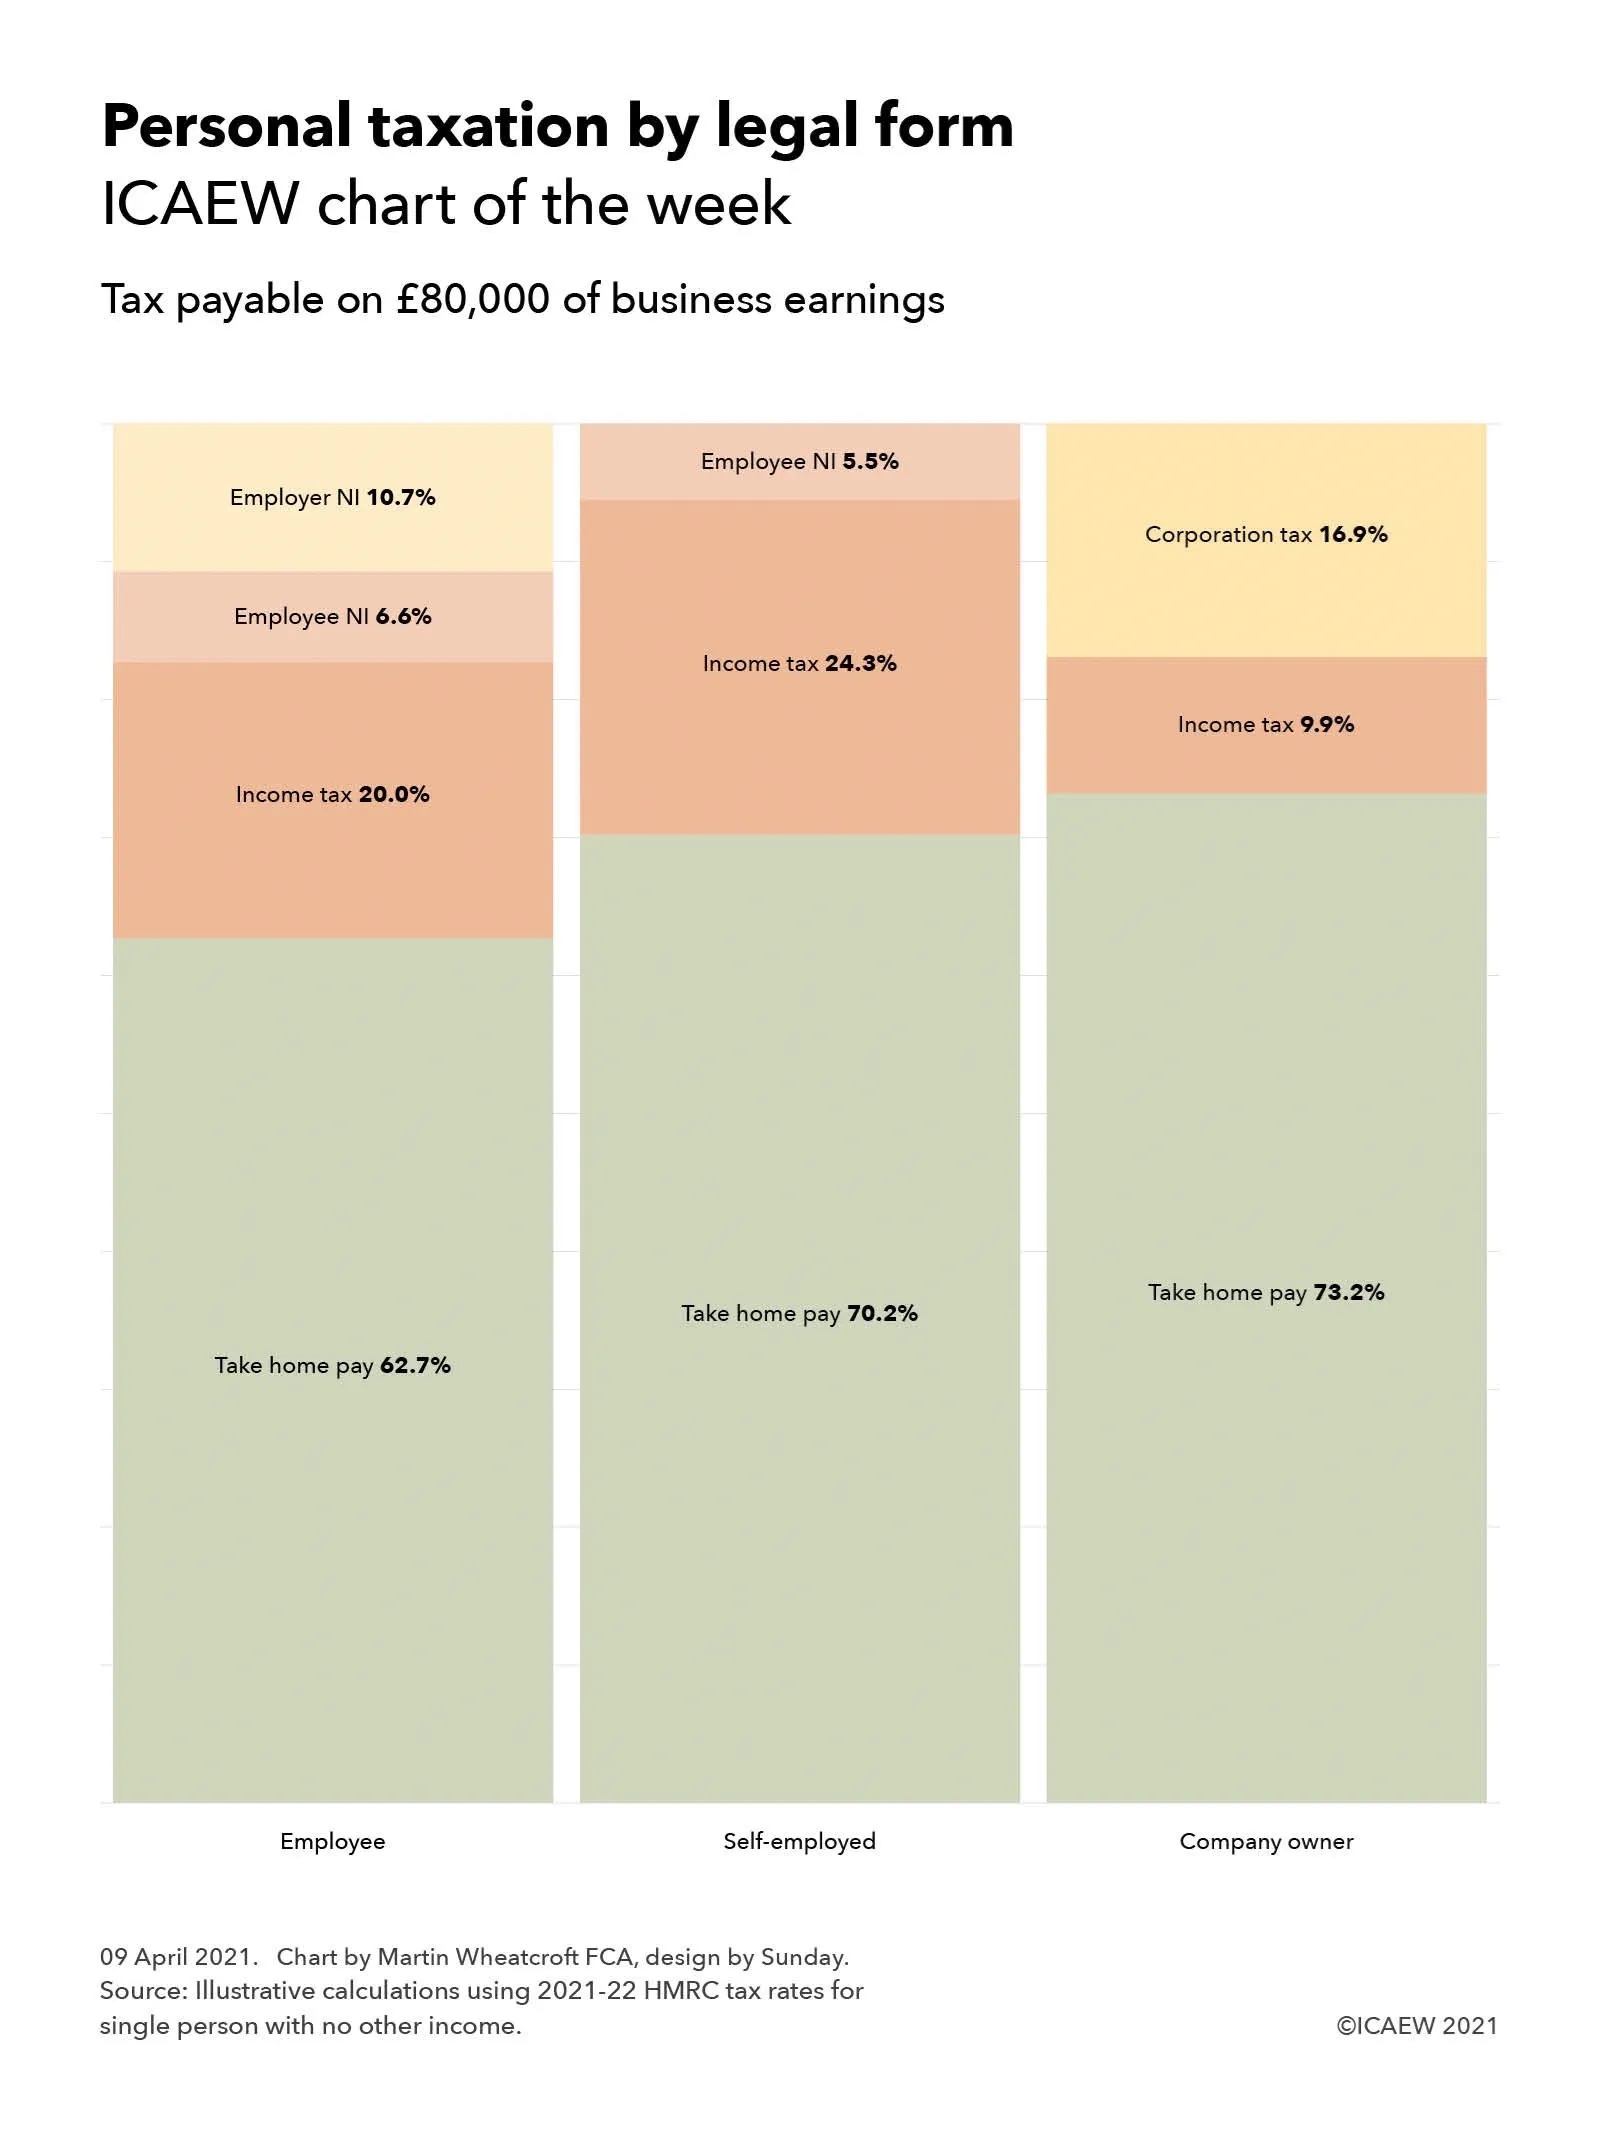
Tax in its more formal sense starts at £9,568 when employee national insurance of 12% starts to be levied. Although ‘constitutionally’ different in how the money collected is used and its role in entitlement to the state pension, in substance it operates as an income tax in all but name.
Income tax itself starts to be levied on earnings above £12,570 at a basic rate of 20%, adding to national insurance to give a marginal tax rate of 32% for those not on universal credit and 74.8% for those who are.
For those in England, Wales and Northern Ireland this tax band goes from £12,570 up to £50,000 but in Scotland, there are intermediate tax bands, with a lower rate of income tax of 19% between £12,570 and £14,667, 20% between £14,667 and £25,926, 21% between £25,926 and £43,662, and 41% above £43,662 when the higher rate of Scottish income tax kicks in.
The new tax band this year arises because the government failed to increase the £50,000 threshold at which child benefit is withdrawn from the higher-earning parent to align with the increase in the higher rate tax threshold to £50,270. This means the insertion of a new tax band between £50,000 and £50,270 as the government starts to withdraw entitlement to ‘universal’ child benefit of £21.15 a week for the eldest child and £14.00 a week for remaining children by collecting an additional tax of 11% for the eldest child and 7.3% for the second and each of any subsequent children.
Above £50,270, the higher rate of income tax of 40% starts to be levied in England, Wales and Northern Ireland, but the marginal rate of national insurance reduces to 2% meaning that this is a 10% increase from 32% to 42% in the combined marginal rate – at least assuming you don’t have children! This rate also applies to those with children from £60,000 up until £100,000 when the marginal rate jumps to 62% (63% in Scotland) as the personal income tax allowance is gradually withdrawn. The marginal rate reverts to 42% (43%) from £125,140 before increasing to 47% (48%) for those on the 45% top rate of income tax above £150,000.
While devolution has led to some of the complexity, this probably hasn’t been helped by the perennial tendency of governments to find ever more complicated approaches to extract additional money from taxpayers without touching the headline rates of tax – for example through the ‘withdrawal’ of the personal tax allowance, which in substance operates as an additional 20% tax payable by those earning between £100,000 and £125,140.
The consequence of this tinkering with the tax systems means there are now nine different tax bands in England, Wales and Northern Ireland with marginal tax rates of 0%, 12%, 32%, 32% + 11% (or more) for higher-earning parents, 42% + 11% (or more) for higher-earning parents, 42%, 62%, 42% and 47%. In Scotland there are twelve: 0%, 12%, 31%, 32%, 33%, 53%, 53% + 11% (or more) for higher earning parents, 43% + 11% (or more) for higher earnings parents, 43%, 63%, 43% and 48%.
Such a complex system invites the question of how it might be reformed, with the possibility of increasing the national insurance threshold to align with the income tax personal allowance being actively discussed in recent years to eliminate one of the bands. However, this now seems less likely than it once did since the pandemic caused such damage to the public finances. Other ideas have included aligning the 40% higher rate and 45% top rate of income tax (either up or down depending on political preference) or ‘folding’ in the personal tax allowance withdrawal into the tax system as part of the higher or top tax rates in conjunction with a reform to tax thresholds.
However, another option would be to add even more complexity, a real possibility now the Welsh government has obtained devolved powers to adjust its income tax rates and thresholds like Scotland, albeit powers that have thankfully not been used so far.
Either way, the nirvana that some tax reformers aspire to of a single flat rate of income tax applying to all earnings seems more remote than ever. One can but dream!