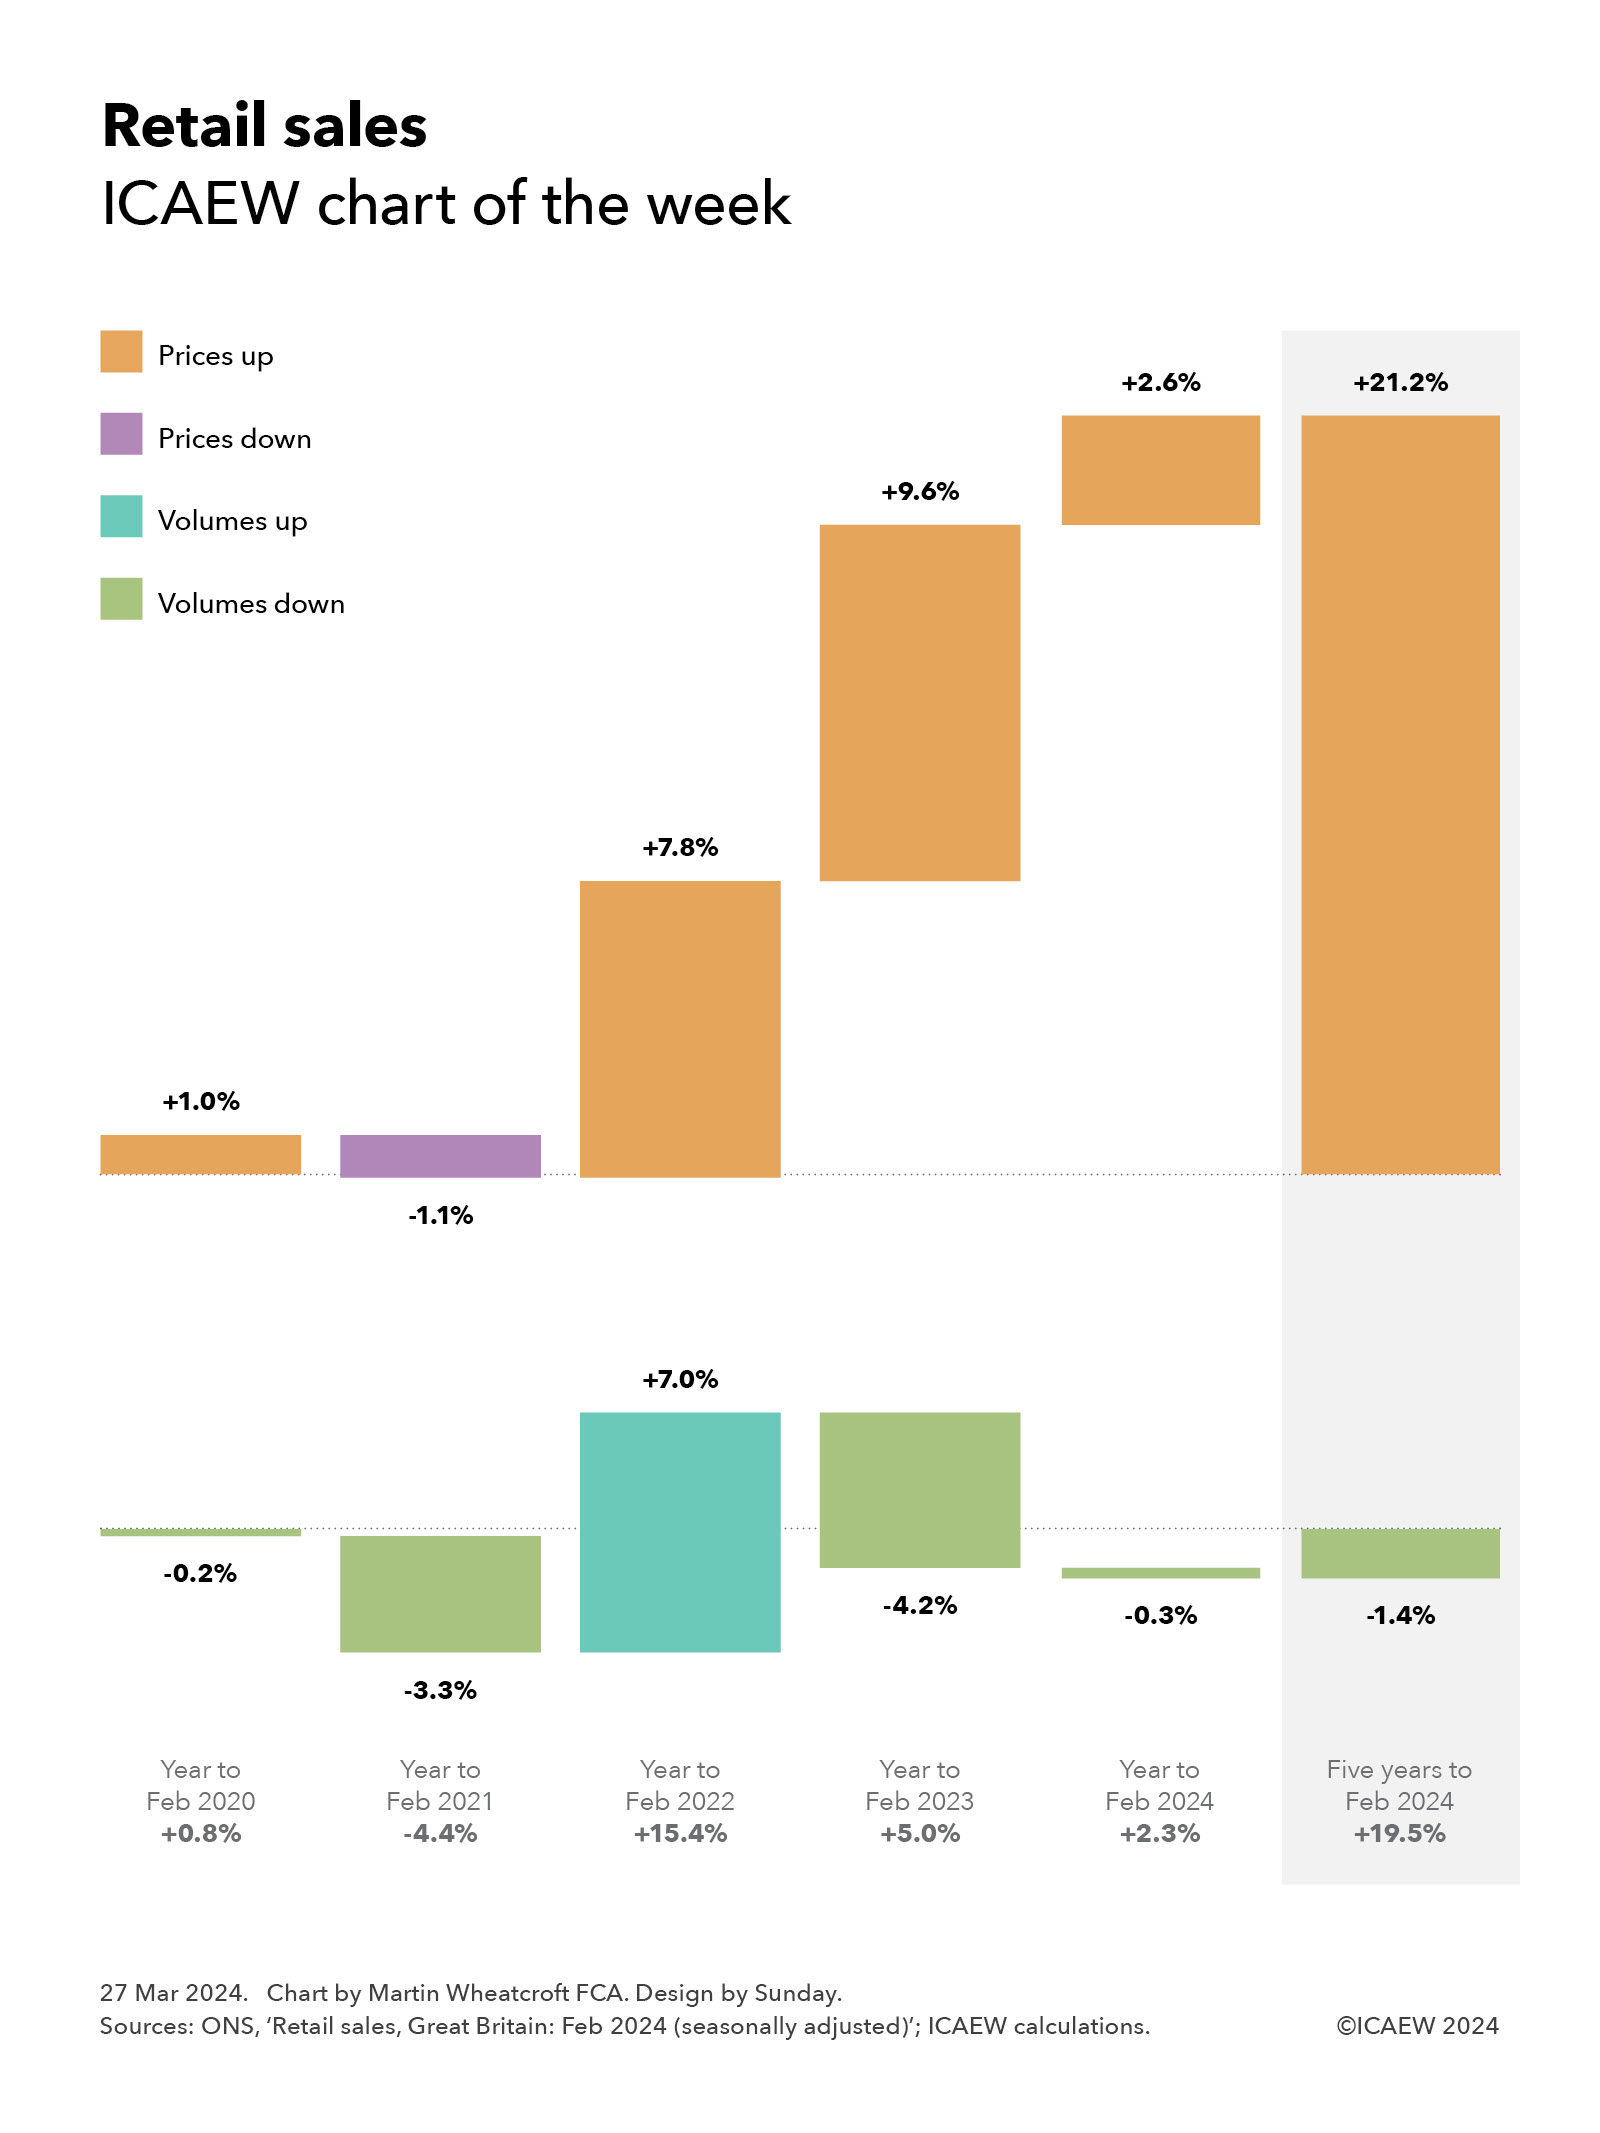
My chart for ICAEW this week looks at how retail sales have increased by 19.5% over the past five years, comprising a 1.4% fall in volumes and a 21.2% increase in prices.
The latest statistics from the Office for National Statistics (ONS) up to February 2024 highlight how retail sales in Great Britain (England, Wales and Scotland) have been on a rollercoaster ride over the past five years as the pandemic, then the cost-of-living crisis, battered the economy.
As our chart of the week illustrates, changes in retail sales can be split between volumes and prices, with growth in retail sales of 19.5% over the five years to February 2024 consisting of a 1.4% fall in volumes and a 21.2% increase in prices.
Our chart also shows how retail sales have increased by year, starting with a 0.8% increase in retail sales in the year to February 2020 (from a 0.2% fall in volumes and a 1% increase in prices) before the first pandemic lockdown the following month. That first year of the pandemic to February 2021 resulted in a 4.4% decline in sales (a 3.3% fall in volumes and a 1.1% reduction in prices) as we cut back on spending, followed by a massive 15.4% jump in retail sales in the year to February 2022 (7% from higher volumes and 7.8% from higher prices) as the nation emerged and started to spend heavily.
The cost-of-living crisis was behind a 5% increase in retail sales in the year to February 2023, as although prices rose 9.6% as inflation accelerated, households cut back on what they bought in response to drive a 4.2% fall in retail volumes.
Retail sales were up by a more modest 2.3% in the year to February 2024, comprising a 0.3% fall in volumes and a 2.6% increase in prices as inflation moderated.
Evening out the ups and downs gives an average increase in retail sales of 3.6% a year over the last five years, comprising an average fall of 0.3% a year in volumes and an average increase of 3.9% in prices.
This is not as positive a picture for retail business as the numbers might imply. Although it appears that retailers are selling slightly less overall at much higher prices, our chart doesn’t reflect the substantial increases many have seen in their input costs over the same period.
For more ICAEW analysis on the economy, click here.
My chart for ICAEW this week takes a look at how UK public debt has exploded since the financial crisis to more than quintuple from £0.6trn in March 2008 to a projected £3.1trn in March 2029.
As illustrated by our chart this week, the sums borrowed by the government since the financial crisis of a decade and half ago have been truly astonishing.
In March 2008, the official measure of net debt for the UK public sector was less than £0.6trn. During the financial crisis, government borrowing totalled £0.7trn over a four-year period, causing public sector net debt to more than double to £1.3bn in March 2012.
The eight austerity years saw government cut spending on public services to a significant degree but still borrow a further £0.5trn to see net debt reach £1.8trn in March 2020 – arguably not mending the roof while the sun was shining. This was then followed by an exceptional amount of borrowing during four years of pandemic and energy crisis (including the current financial year) that is expected to see net debt increase by a total of £0.9trn to reach £2.7trn in March 2024.
The Autumn Statement 2023 on Wednesday 22 November saw the Chancellor set out his latest plan for the UK public finances over the next five financial years. This includes a further £0.4trn of borrowing, with public sector net debt projected to amount to £3.1trn in March 2029 – more than quintuple the net amount owed by the UK state 21 years earlier in March 2008.
This assumes that the government can stick to its borrowing plans – many commentators have suggested that planned cuts in spending on public services are unrealistic, meaning more borrowing if taxes are not to rise.
The £2.5trn increase in debt between 2008 and 2029 comprises £2.2trn in borrowing to fund 21 years of deficits (the annual shortfall between receipts and spending) and £0.3trn in other borrowing to fund government lending (such as student loans) and working capital requirements.
As a share of the economy, the increase is less dramatic but still significant – rising from a net debt to GDP ratio of 35.6% in March 2008, to 74.3% in March 2012, to 85.2% in March 2020, to an anticipated 97.9% in March 2024. However, the good news is that net debt / GDP is expected to fall to 94.1% in March 2029 as inflation and economic growth offset the additional borrowing.
The worry for this (or any alternative) government is that while borrowing levels in the OBR’s forecast spreadsheet for the next five years appear manageable and are (just) within the current fiscal rules, the numbers assume that we don’t enter another recession or other economic crisis in that time. Otherwise, we could see debt exploding again.
Monthly public sector finances for October saw spending continue to exceed receipts by a large margin, even if by less than was predicted earlier in the year.
The Office for National Statistics (ONS) released the month public sector finances for October on Tuesday 21 November 2023. It reported a provisional deficit for the month of October of £15bn, bringing the cumulative deficit for the first seven months of the year to £98bn, £22bn more than in the same period last year.
Alison Ring OBE FCA, Public Sector and Taxation Director for ICAEW, said: “Although it is positive that the cumulative deficit to October of £98bn is less than the £115bn predicted by the OBR, cash going out continues to exceed cash coming in by a very large margin. Public sector net debt has now exceeded £2.6 trillion for the first time, which is a staggering new record.
“Tomorrow’s Autumn Statement will see the OBR revise and roll forward its forecast, giving the Chancellor so-called headroom to cut taxes or increase spending. But in reality there is no headroom when the public finances continue to be on an unsustainable path without a long-term fiscal strategy to fix them.”
Month of October 2023
The provisional shortfall in taxes and other receipts compared with total managed expenditure for the month of October 2023 was £15bn, made up of tax and other receipts of £85bn less total managed expenditure of £100bn, up 3% and 6% respectively compared with October 2022.
This was the second highest October deficit on record since monthly records began in 1993, following a monthly deficit of £18bn in October 2020 at the height of the pandemic.
Public sector net debt as of 31 October 2023 was £2,644bn or 97.8% of GDP, the first time it has exceeded £2.6trn – only eight months after it first reached £2.5trn.
Seven months to October 2023
The provisional shortfall in taxes and other receipts compared with total managed expenditure for the seven months to October 2023 was £98bn, £22bn more than the £76bn deficit reported for the first seven months of 2022/23. This reflected a widening gap between tax and other receipts for the seven months of £595bn and total managed expenditure of £693bn, up 5% and 8% respectively compared with April to October 2022.
Inflation benefited tax receipts for the first seven months compared with the first half of the previous year, with income tax up 10% to £137bn and VAT up 9% to £117bn. Corporation tax receipts were up 12% to £55bn, partly reflecting the increase in the corporation tax rate from 19% to 25% from 1 April 2023, while national insurance receipts were down by 4% to £99bn because of the abolition of the short-lived health and social care levy last year. Stamp duty on properties was down by 27% to £8bn and the total for all other taxes was up just 3% to £115bn, much less than inflation as economic activity slowed. Non-tax receipts were up 10% to £63bn, primarily driven by higher investment income.
Total managed expenditure of £693bn in the seven months to October 2023 can be analysed between current expenditure excluding interest of £587bn, up £39bn or 7% over the same period in the previous year, interest of £76bn, up £4bn or 5%, and net investment of £30bn, up £9bn or 44%.
The increase of £39bn in current expenditure excluding interest was driven by a £20bn increase in pension and other welfare (including cost-of-living payments), £12bn in higher central government pay, £6bn in additional central government procurement spending, plus £1bn in net other changes.
The rise in interest costs for the seven months of £4bn to £76bn comprises a £18bn or 53% increase to £52bn for interest not linked to inflation as the Bank of England base rate rose, mostly offset by an £14bn or 37% fall to £24bn for interest accrued on index-linked debt from lower inflation than last year.The £9bn increase in net investment spending to £30bn in the first seven months of the current year reflects high construction cost inflation amongst other factors that saw a £11bn or 17% increase in gross investment to £65bn, less a £2bn or 6% increase in depreciation to £35bn.
The cumulative deficit of £98bn is £17bn lower than the Office for Budget Responsibility (OBR)’s official forecast of £115bn for the first seven months of 2023/24 as compiled in March 2023. The OBR is expected to revise its forecast for the full year deficit down from £132bn in tomorrow’s Autumn Statement, but it is still on track to be more than double the £50bn projection for 2023/24 set out in the official forecast from a year earlier (March 2022).
Balance sheet metrics
Public sector net debt was £2,644bn at the end of October 2023, equivalent to 97.8% of GDP.
The debt movement since the start of the financial year was £105bn, comprising borrowing to fund the deficit for the seven months of £98bn plus £7bn in net cash outflows to fund lending to students, businesses and others net of loan repayments together with working capital movements.
Public sector net debt is £829bn more than the £1,815bn reported for 31 March 2020 at the start of the pandemic and £2,106bn more than the £538bn number as of 31 March 2007 before the financial crisis, reflecting the huge sums borrowed over the last couple of decades.
Public sector net worth, the new balance sheet metric launched by the ONS this year, was -£716bn on 31 October 2023, comprising £1,565bn in non-financial assets, £1,029bn in non-liquid financial assets, £2,644bn of net debt (£305bn in liquid financial assets less public sector gross debt of £2,949bn) and other liabilities of £666bn. This is a £102bn deterioration from the -£614bn reported for 31 March 2023.
Revisions
Caution is needed with respect to the numbers published by the ONS, which are expected to be repeatedly revised as estimates are refined and gaps in the underlying data are filled.
The latest release saw the ONS revise the reported deficit for the six months to September 2023 up by £1.7bn as estimates of tax receipts and expenditure were updated for better data, while the debt to GDP ratio at the end of September 2023 was revised down by 1.4 percentage points from 97.8% to 96.4% as a consequence of updated estimates of GDP.
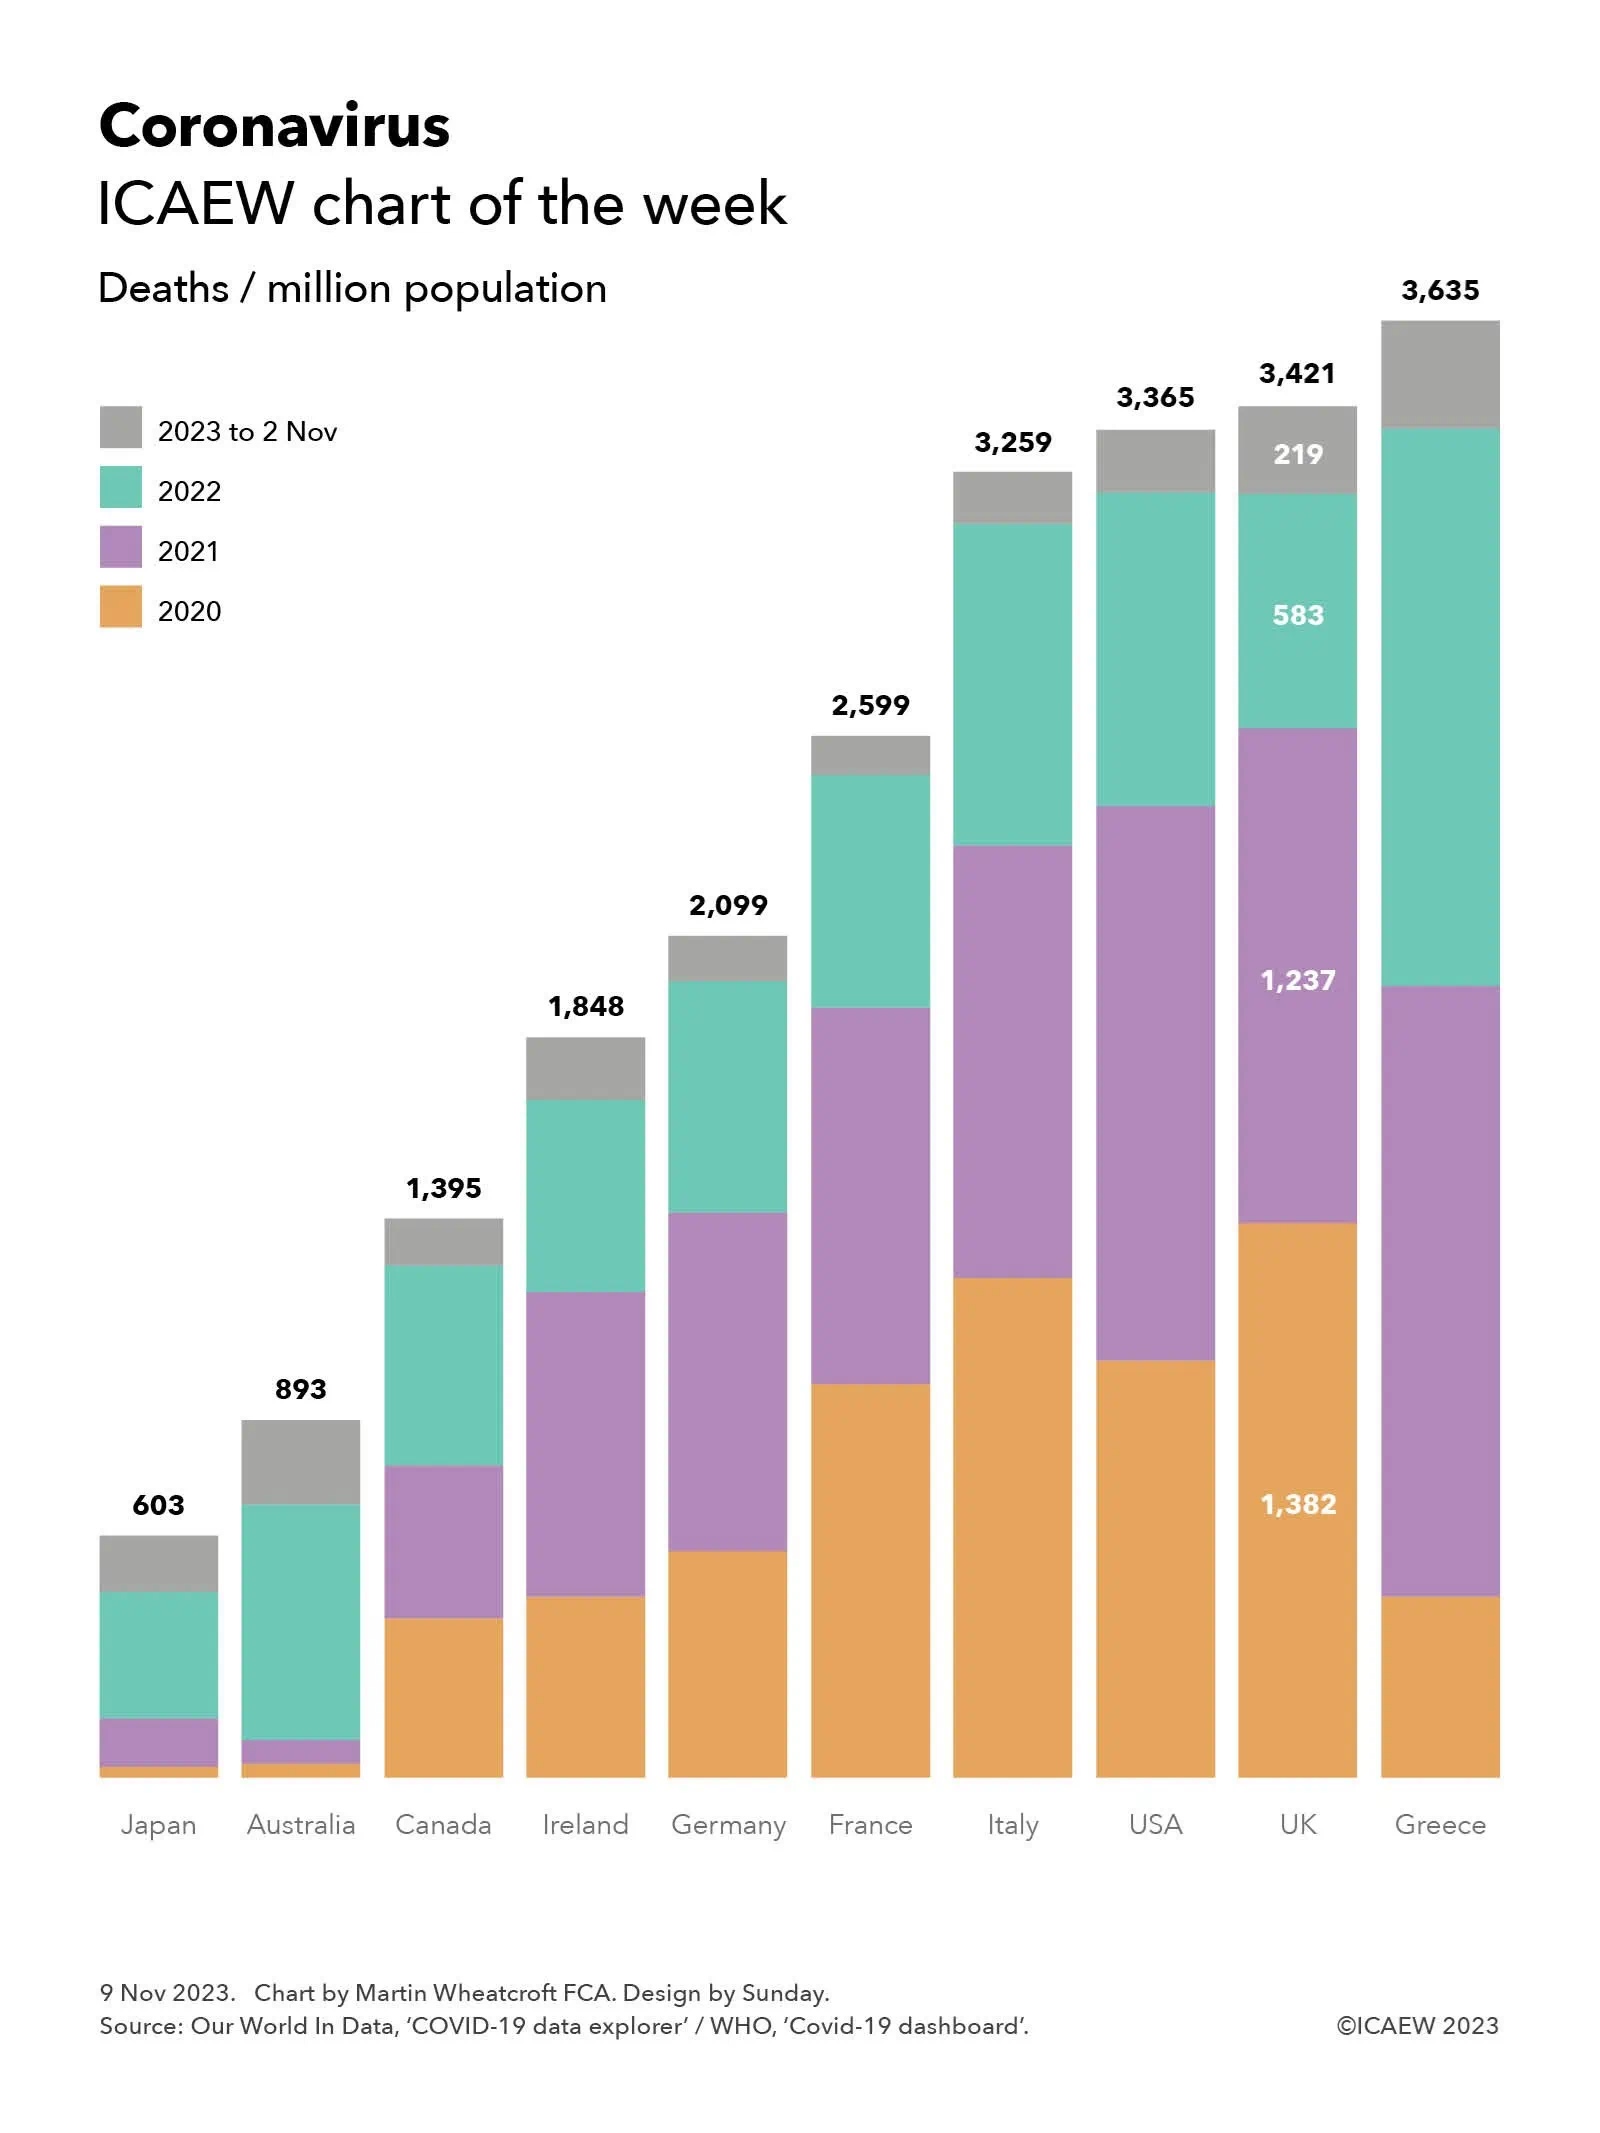
My chart this week looks at one of the big questions being looked at by the UK COVID-19 Inquiry: why did the UK experience one of the highest death rates in the developed world?
According to the official statistics, there were 3,421 deaths per million population attributed to COVID-19 in the UK between 1 January 2020 and 2 November 2023. This compares with 603 deaths per million in Japan, 893 in Australia, 1,395 in Canada, 1,848 in Ireland, 2,099 in Germany, 2,599 in France, 3,259 in Italy, 3,365 in the US and 3,635 in Greece.
Not shown in the chart are the total number of cumulative deaths attributed to COVID-19 (ie before dividing by the population) of 74,694 in Japan, 23,289 in Australia, 53,297 in Canada, 9,281 in Ireland, 174,979 in Germany, 167,985 in France, 192,406 in Italy, 1.14m in the USA, 230,974 in the UK, and 37,738 in Greece.
Both Our World In Data and the WHO give warnings about the data, especially given difficulties in identifying which deaths were caused by the coronavirus (especially in 2020 before testing was widely available), whether deaths are recorded when they happened or when they were reported, and differences in how countries attribute deaths to causes.
Despite those factors, these statistics give an overall impression of how badly the coronavirus affected different countries, especially when combined with other data, such as excess mortality (also not shown in the chart). According to Our World In Data, the cumulative difference between total deaths reported from all causes and projected deaths (based on an extrapolation from the years prior to the pandemic) changes the rankings for the countries in our chart, improving the UK’s position to an extent with the US has more excess deaths proportionately than the UK, and Italy more than Greece. Australia has the lowest level of excess deaths for these countries, below Japan, while France is between Canada and Ireland.
The chart also illustrates the deaths per million of population by year, highlighting how for the UK this was 1,382 in 2020, 1,237 in 2021, 583 in 2022, and 219 in 2023, up to 2 November 2023.
The UK COVID-19 Inquiry is looking at much more than the number of deaths as it considers how coronavirus affected all of us over the past few years, how people were affected, including short- and long-term impacts on health and how people died, as well as the impact on the economy and our lives more generally of COVID-19 – and the UK Government’s response to it.
The public finances continue to be battered by economic shocks as this week’s chart on the past five years of red ink illustrates.
The monthly public sector finances for March 2023 released on Tuesday 25 April contained the first cut of the government’s financial result for 2022/23, with our chart this week illustrating trends over the past five years in receipts, expenditure and the deficit.
As our chart highlights, tax and other receipts increased from £813bn in 2018/19 to £827bn in 2019/20, before falling to £793bn during the first year of the pandemic. They recovered to £920bn in 2021/22 before rising with inflation to a provisional estimate of £1,016bn for the year ended 31 March 2023.
Total managed expenditure (TME) increased from £857bn in 2018/19 to £888bn in 2019/20, before exceeding £1trn for the first time in 2020/21 as the pandemic caused expenditure to rise significantly. TME fell in 2021/22 to £1,041bn as pandemic-released spending was scaled back, before rising this year to £1,155bn as inflation, higher interest rates and energy support packages more than offset the pandemic related spending that was not repeated in 2022/23.
The deficit of £44bn in 2018/19 was the lowest it had been since the financial crisis, following an extended period of spending restraint over a decade. The purse strings were loosened a little in 2019/20 as previous government plans to eliminate the deficit were abandoned, with the deficit rising to £61bn. The huge cost of the pandemic saw the deficit rise to £313bn in 2020/21 as the borrowing rose to meet the huge costs of dealing with the pandemic, before falling back to £121bn in 2021/22.
There were hopes that the situation would improve further, with the government in October 2021 budgeting for a deficit of £83bn. Unfortunately, rampant inflation and the energy crisis following Russia’s invasion of Ukraine mean that the government does not currently expect to reduce the deficit to below £50bn until 2027/28 at the earliest. And that is with what some commentators believe are unrealistic assumptions about the government’s ability to reduce spending on public services beyond the cuts already delivered.
Provisional receipts in 2022/23 were 25% higher than the outturn for 2018/19, which in the absence of economic growth has principally been driven by inflation of around 15% over that period combined with an increase in the level of taxation and other receipts from around 37% to approaching 41% of the economy. Total managed expenditure is provisionally 35% higher than in 2018/19, although this includes substantial amounts of one-off expenditures on the energy support packages and index-linked debt interest that should moderate, at least assuming inflation reduces in the coming financial year.
Not shown in the chart is what these numbers mean for public sector net debt, which has increased by £753bn over the past five years from £1,757bn at 1 April 2018 to a provisional £2,530bn at 31 March 2023. This comprises £678bn in borrowing to fund the deficits shown in the chart, and £75bn to fund lending by government and working capital requirements.
Our chart this week may be well presented, but it is not a pretty picture.
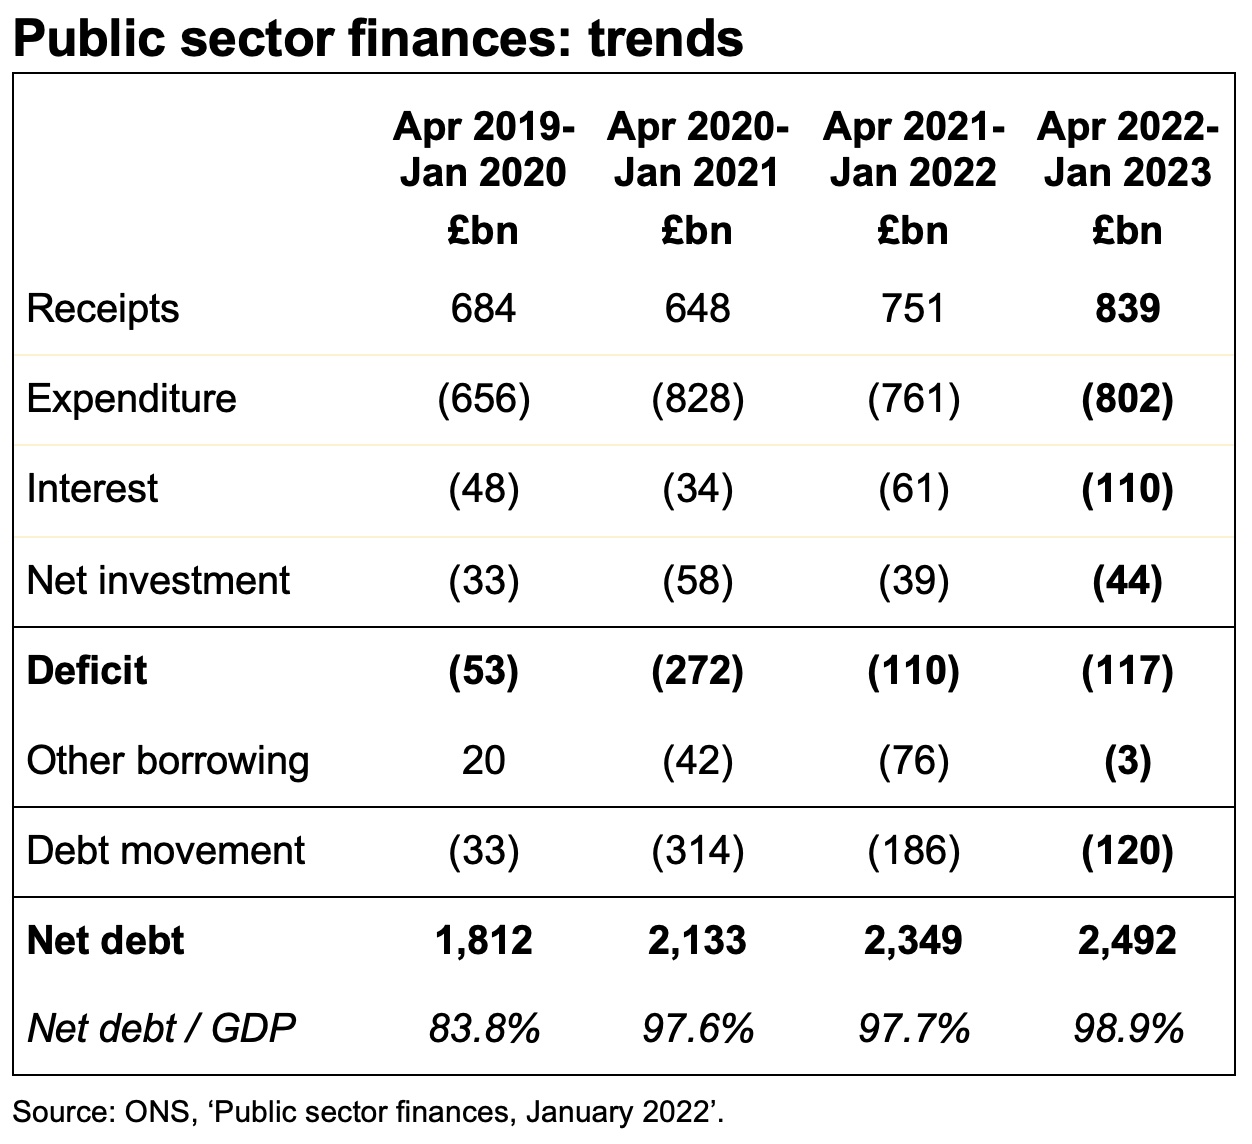
Better than expected self assessment tax receipts helped generate a small fiscal surplus of £5bn in January, reducing the year-to-date deficit to £117bn, £7bn more than the comparative period in the previous financial year.
The monthly public sector finances for January 2023 released on Tuesday 21 February 2023 reported a provisional surplus for the month of £5bn. This was a significant improvement over the deficit of £26bn reported for the previous month (December 2022), but £7bn less than the surplus reported for the same month last year (January 2022).
A surplus arose primarily because better than expected self assessment tax receipts were sufficient to offset the effect of higher interest costs, higher inflation on index-linked debt, and the cost of the energy price guarantee for households and businesses incurred during the month. January also saw the Office for National Statistics (ONS) record a £2bn charge for custom duties that the UK had failed to collect when it was a member of the EU Customs Union.
The cumulative deficit for the first 10 months of the financial year was £117bn, which is £7bn more than in the same period last year but £155bn lower than in 2020/21 during the first stages of the pandemic. It was £64bn more than the deficit of £53bn reported for the first 10 months of 2019/20, the most recent pre-pandemic pre-cost-of-living-crisis comparative period.
The deficit was £22bn below the Office for Budget Responsibility (OBR)’s revised forecast made at the time of the Autumn Statement in November, primarily because the energy price guarantee has cost less than anticipated.
Public sector net debt was £2,492bn or 98.9% of GDP at the end of January 2023, dipping below the £2.5tn reported last month because of corrections to prior month data. This is £672bn higher than net debt of £1,820bn at 31 March 2020, reflecting the huge sums borrowed since the start of the pandemic. The OBR’s latest forecast is for net debt to reach £2,571bn by March 2023 and to approach £3trn by March 2028.
Tax and other receipts in the 10 months to 31 January 2023 amounted to £839bn, £88bn or 12% higher than a year previously. Higher income tax and national insurance receipts were driven by rising wages and the higher rate of national insurance for part of the year, while VAT receipts benefited from inflation in retail prices.
Expenditure excluding interest and investment for the ten months of £802bn was £41bn or 5% higher than the same period in 2021/22, with Spending Review planned increases in spending, the effect of inflation, and the cost of energy support schemes partially offset by the furlough programmes and other pandemic spending in the comparative period not being repeated this year.
Interest charges of £110bn for the 10 months were £49bn or 80% higher than the £61bn reported for the equivalent period in 2021/22, through a combination of higher interest rates and higher inflation driving up the cost of RPI-linked debt.
Cumulative net public sector investment to January was £44bn, £5bn more than a year previously. This is much less than might be expected given the Spending Review 2021 pencilled in significant increases in capital expenditure budgets in the current year.
The increase in net debt of £120bn since the start of the financial year comprised borrowing to fund the deficit for the 10 months of £117bn together with a further £3bn to fund student loans, lending to businesses and others, and working capital requirements, net of cash inflows from repayments of deferred taxes and loans made to businesses during the pandemic.
Alison Ring OBE FCA, Public Sector and Taxation Director for ICAEW, said: “With a small surplus, January’s fiscal numbers benefited from stronger self-assessment tax receipts than expected, providing some comfort to Chancellor Jeremy Hunt as he assembles his first Budget. The deficit for the current financial year is still on track to be one of the highest ever recorded, reaching £117bn for the ten months to January 2023 after energy support and interest costs more than offset the benefit of higher tax receipts.
“Although it appears that inflation has peaked, the near-term economic outlook continues to deteriorate and so calls for immediate tax cuts are likely to remain unanswered. We are asking the Chancellor to take urgent action to eliminate the backlog at HMRC that is inhibiting business growth, and to make improving the resilience of the UK economy and the public finances a priority.”
Caution is needed with respect to the numbers published by the ONS, which are expected to be repeatedly revised as estimates are refined and gaps in the underlying data are filled.
The ONS made several revisions to prior period fiscal numbers to reflect revisions to estimates. These had the effect of reducing the reported fiscal deficit for the nine months ended 31 December 2022 by £6bn to £122bn and reducing the reported fiscal deficit for the year to 31 March 2022 by £1bn to £122bn.
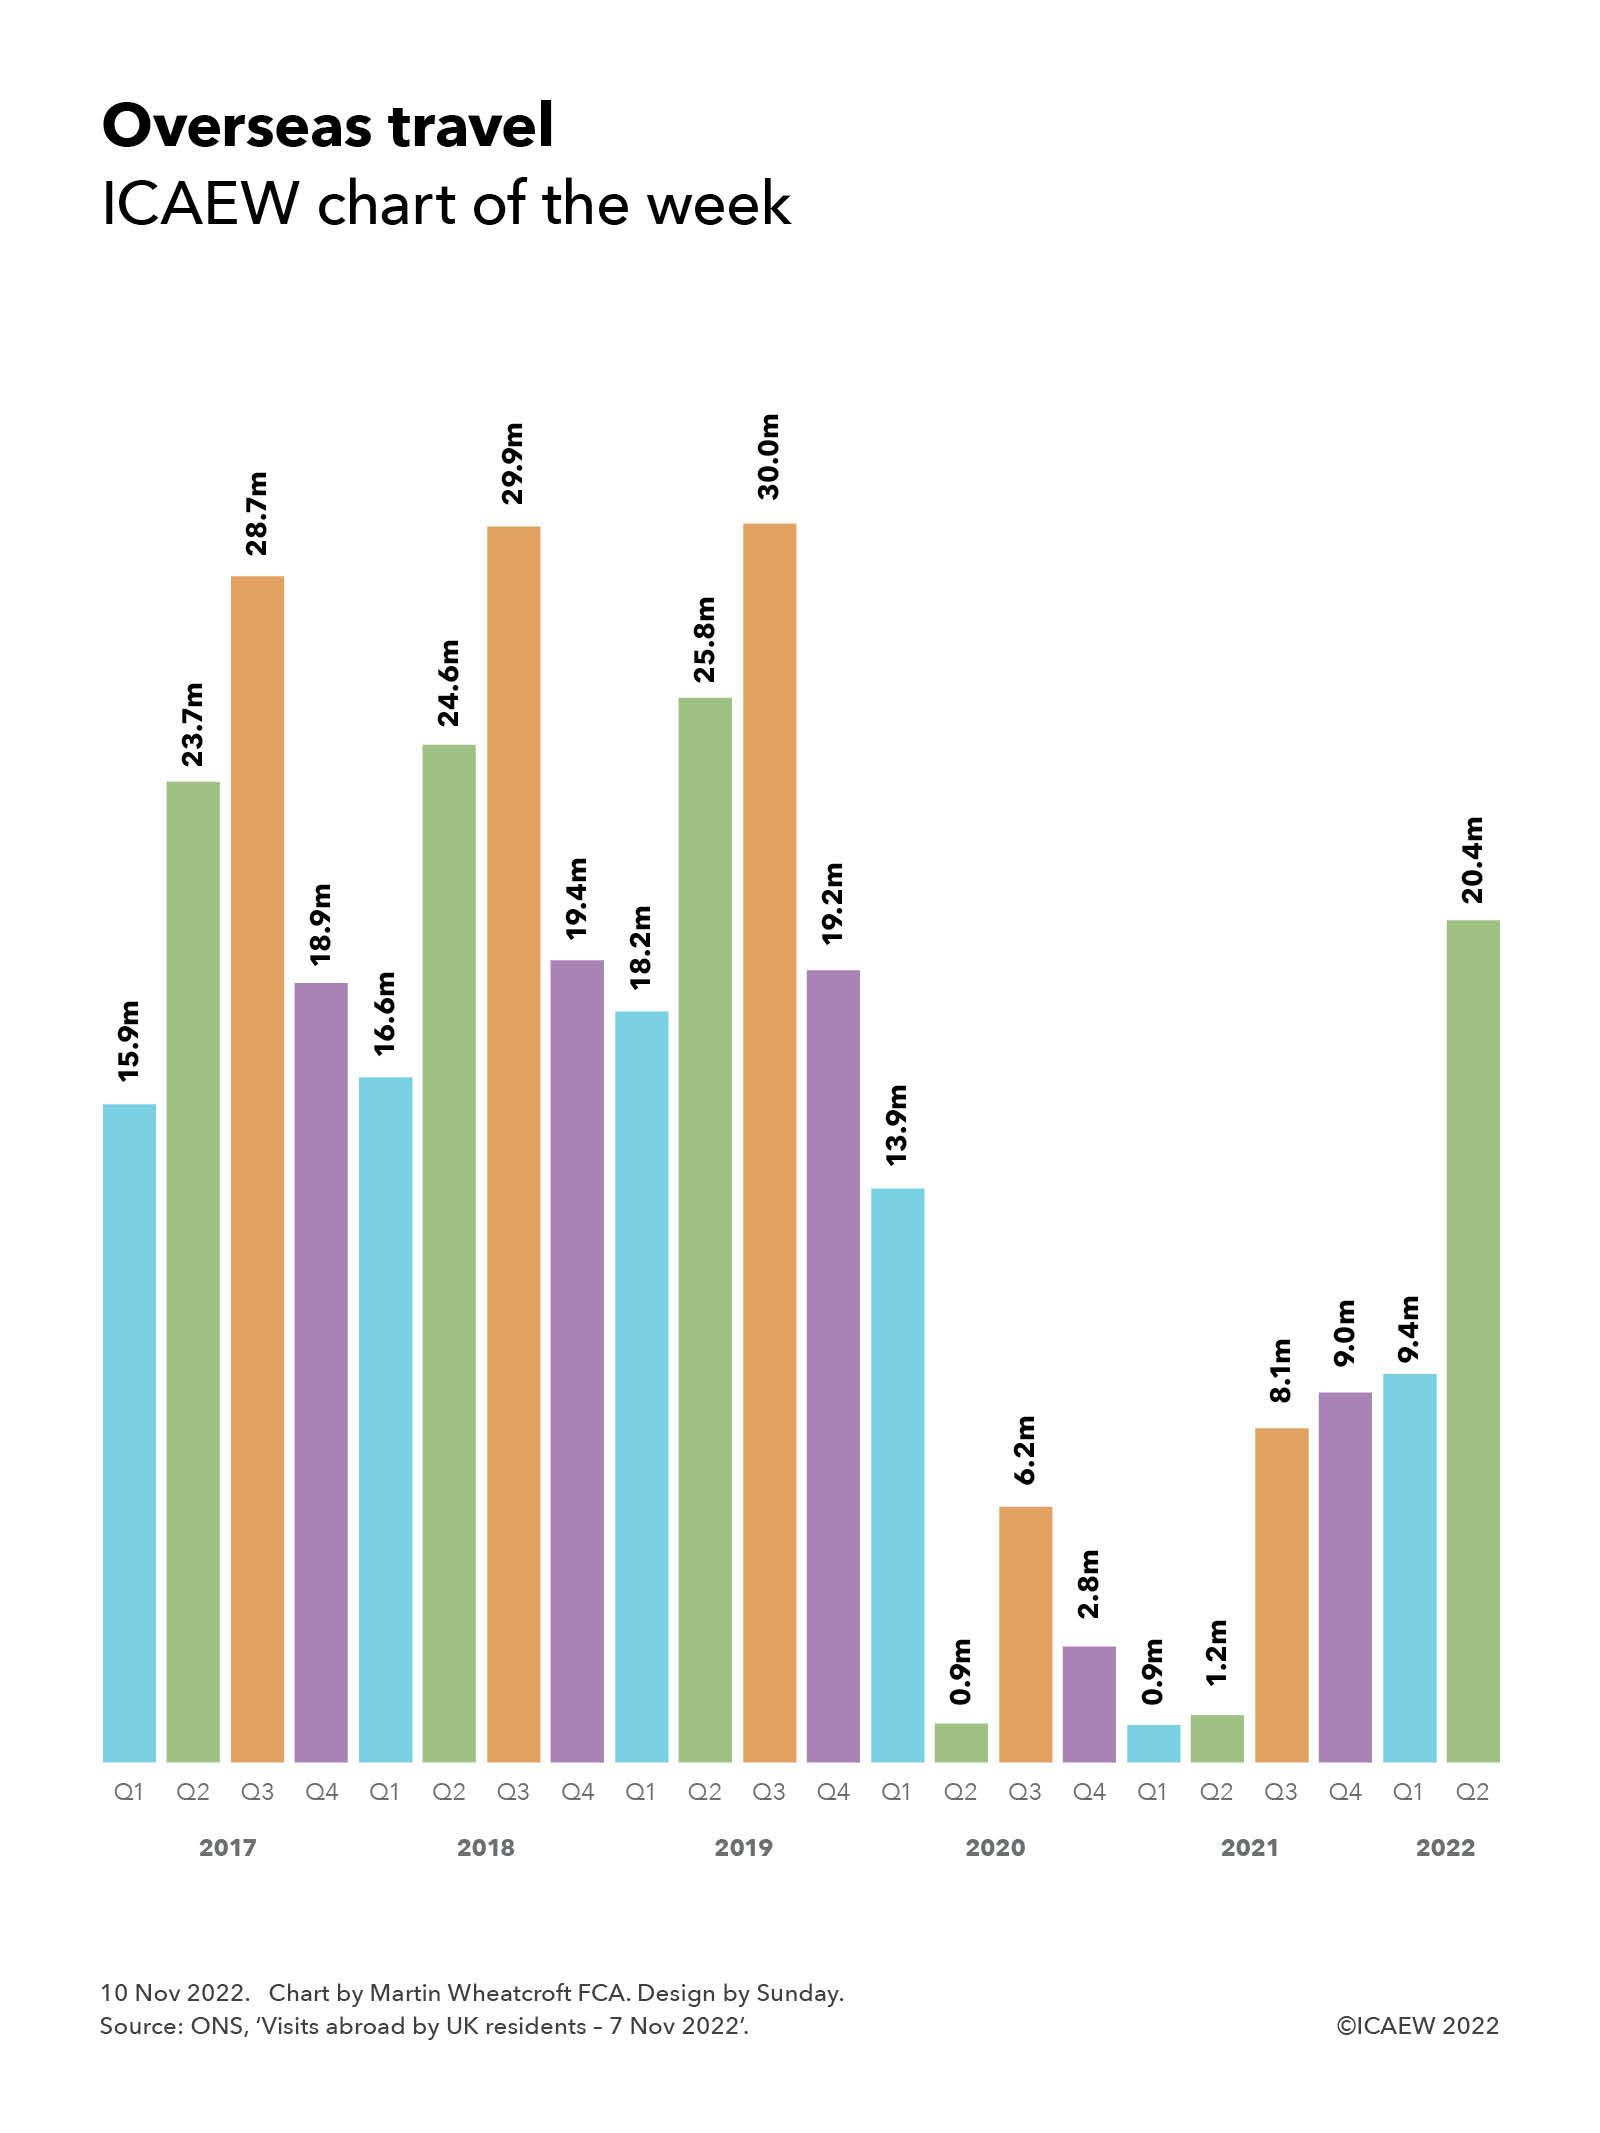
My chart this week is about visits abroad by UK residents, illustrating how people have started to travel again following restrictions during the pandemic.
Visits abroad by UK residents have picked up following the depths of the pandemic but have yet to recover to pre-pandemic levels.
According to the Office for National Statistics, the number of visits abroad by UK residents by quarter amounted to 15.9m, 23.7m, 28.7 and 18.9m in 2017; 16.6m, 24.6m, 29.9m and 19.4m in 2018; 18.2m, 25.8m, 30.0m and 19.2m in 2019; 13.9m, 0.9m, 6.2m and 2.8m in 2020; 0.9m, 1.2m, 8.1m and 9.0m in 2021; and 9.4m and 20.4m in the first two quarters of 2022.
Although substantially higher than at the height of COVID-19 travel restrictions, trips abroad during the first half of 2022 were still substantially lower than before the pandemic.
The 20.4m visits during the second quarter of 2022 comprised 15.1m to countries in the European Union, 1.3m to other European countries, 1.0m to North America and 3.0m to other countries around the world. Of these trips, 13.4m were for holidays, 5.1m were to visit friends or relatives, 1.4m for business and 0.5m were for other reasons.
These numbers compare with 25.8m visits in the second quarter of 2019, comprising 18.9m to the EU, 1.4m to other European countries, 1.6m to North America and 3.9m to the rest of the world. This comprised an estimated 16.8m holidays, 6.0m visits to friends or relatives, 2.5m business trips and 0.5m other.
The amount spent by travellers in the second quarter of 2022 was estimated to be £15.8bn, an average of approximately £775 per visit. This compares with an average of around £630 in the second quarter of 2019, reflecting a weaker pound, inflation and the mix of travellers and countries visited.
Trips abroad during the key summer quarter of July to September 2022 has yet to be released by the ONS, so we wait to see whether there will be anywhere near the peak of 30.0m visits recorded in Q3 of 2019.
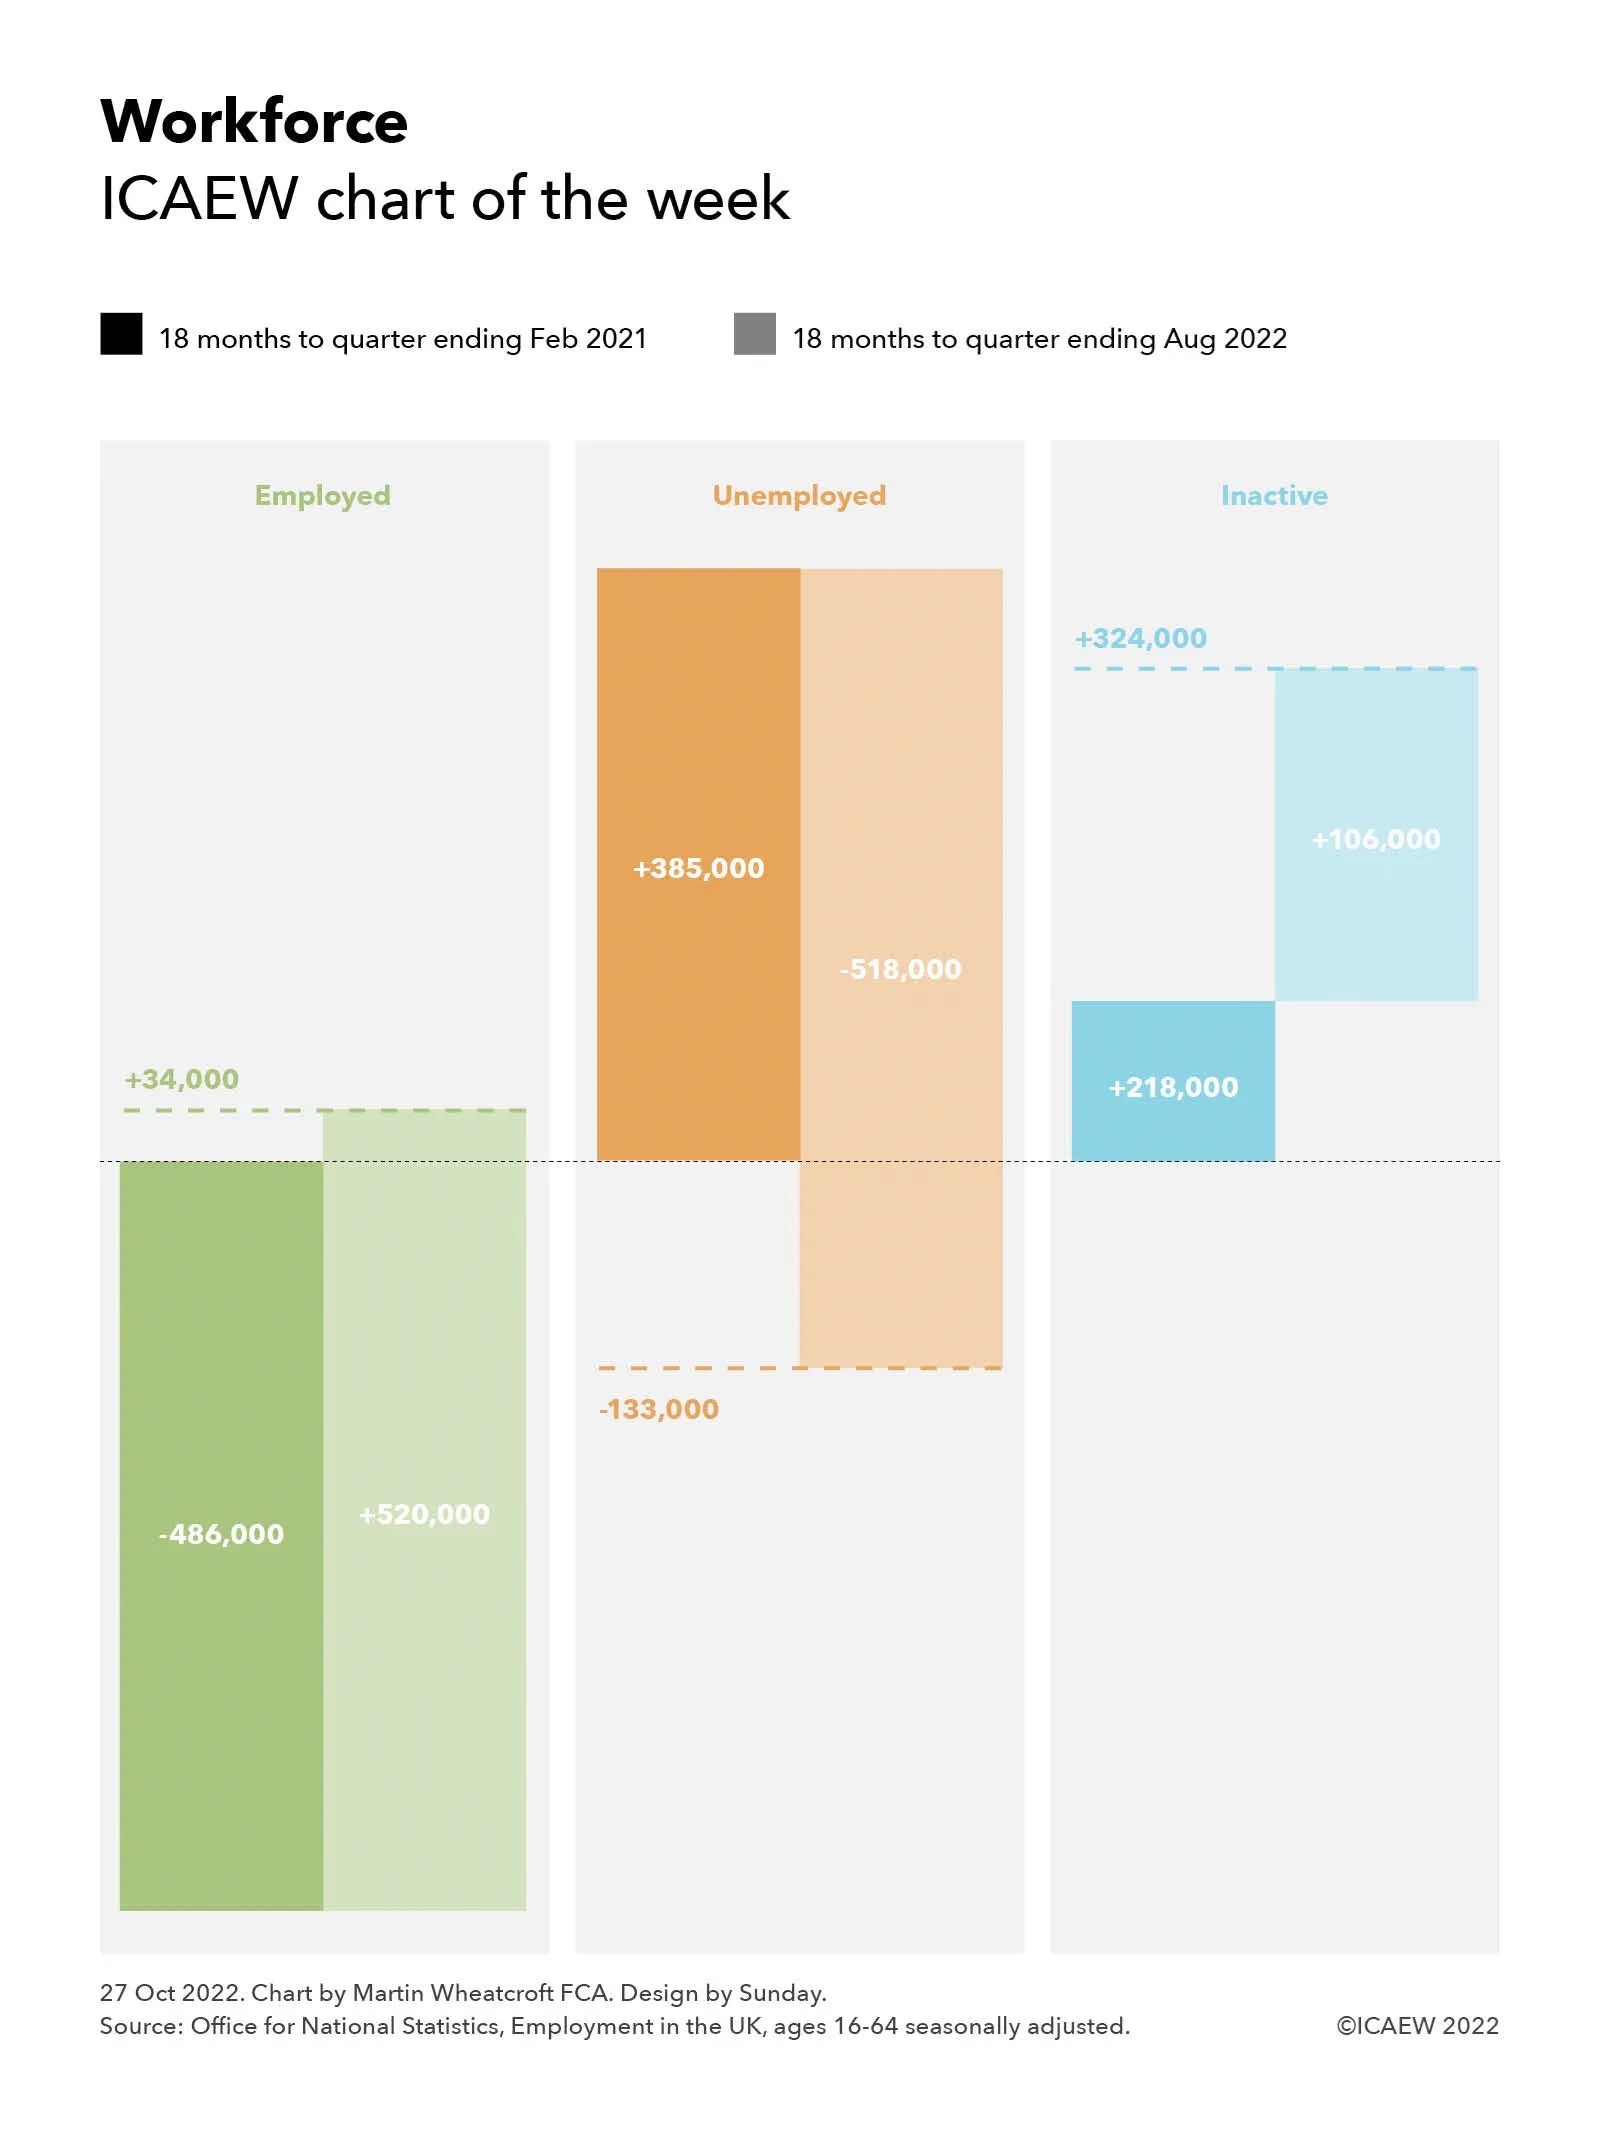
My chart this week looks at the changes in the numbers of people between 16 and 64 who are employed, unemployed or economically inactive over the past three years.
According to the Office for National Statistics, on a seasonally adjusted basis the working-age population (ages 16 to 64) comprised 31,366,000 people in employment, 1,297,000 unemployed and 8,675,000 economically inactive in the quarter from June to August 2019.
As our chart this week illustrates, the numbers in employment fell by 486,000 over the following 18 months to the quarter from December 2019 to February 2021. Over the same period, there were 385,000 more people aged 16 to 64 recorded as being unemployed and 106,000 more as economically inactive. This was a net increase of just 5,000 as the normal growth in population was offset by migrants returning home at the start of the pandemic and a higher death rate than normal as a consequence of the pandemic.
Over the subsequent 18 months to the quarter from June to August 2022, employment of those between the ages of 16 and 64 recovered as the economy reopened, growing by 520,000, while unemployment fell by 518,000. However, the number economically inactive continued to grow, increasing by a further 218,000.
This resulted in a net movement over the three years of 225,000, comprising 34,000 more people in employment (to 31,400,000 in the quarter ended August 2022), 133,000 fewer unemployed (to 1,164,000), and 324,000 more who were economically active (to 8,999,000).
The numbers who were economically inactive in the June to August 2022 quarter comprised 2,419,000 students (up 103,000 from three years previously), 1,726,000 homemakers (down 254,000), 2,662,000 who were sick (up 424,000), 1,181,000 in early retirement (up 61,000) and 1,011,000 others (down 10,000).
This is not the total workforce, which in the quarter to August 2022 also includes 1,355,000 aged 65 or over in employment (up 27,000 from three years previously), 24,000 who were registered as unemployed (up 7,000) and 10,994,000 economically inactive (up 355,000), the majority of whom were retired.
Not shown in the chart is the change in the number of vacancies, which fell by 188,000 in the 18-month period from 812,000 in the quarter from June to August 2019 to 624,000 in the quarter from December 2020 to February 2021 and then rose by 635,000 over the following 18 months to 1,259,000 in the quarter from June to August 2022, a net movement of +447,000 over three years.
There has been much debate about the rise in the number of people who are categorised as long-term sick, which is believed to be down to a combination of ‘long Covid’ and NHS treatment backlogs.
The big jump in vacancies over the last three years – to a point where there are now more vacancies than the number of people recorded as unemployed – is putting significant pressure on businesses that are struggling to recruit new workers.
This position could change rapidly, however, with many commentators concerned that the cost-of-doing business crisis could result in a sharp rise in unemployment and a fall in vacancies over the next six months as consumers reign back spending in response to energy costs, rapidly rising prices, higher mortgage payments and an increasingly uncertain economic outlook.
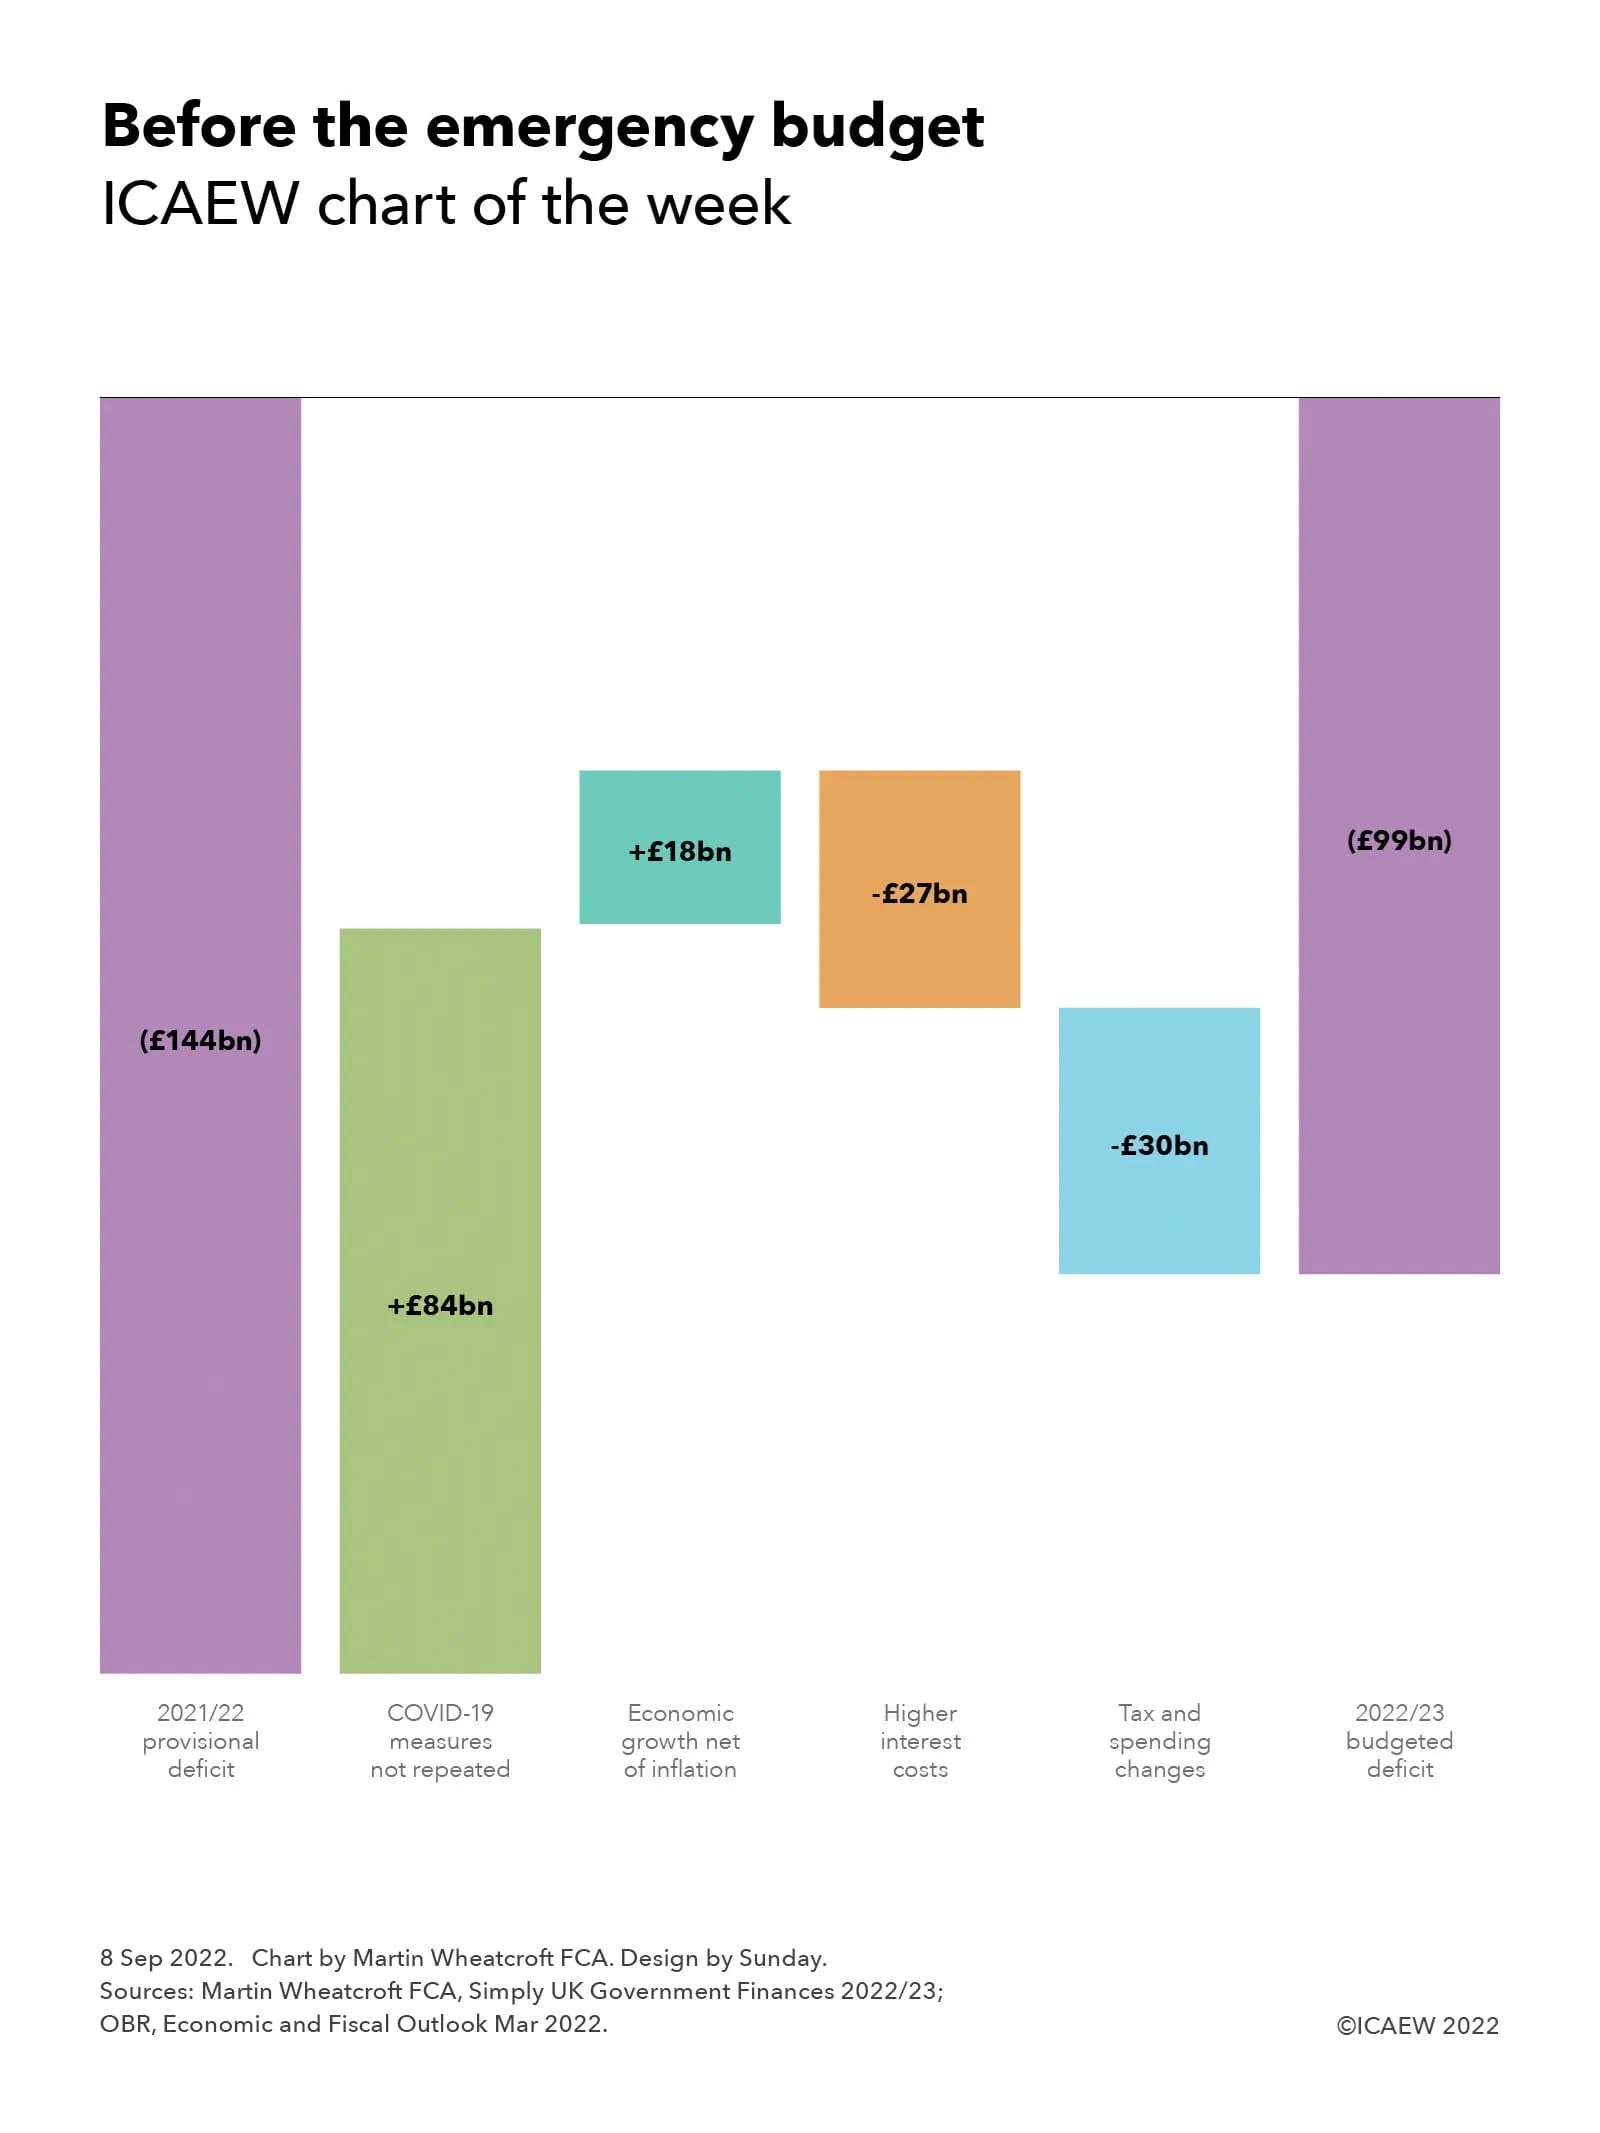
My chart this week looks at how the budgeted deficit was supposed to play out according to the Spring Statement back in March, ahead of an emergency fiscal event expected within the next few weeks.
The new Chancellor will be looking at a range of possible large scale interventions to support individuals and businesses as they face unprecedented cost-of-living and cost-of-doing-business crises this winter. Several commentators have suggested that the combination of tax cuts trailed by new Prime Minister Liz Truss and a massive emergency support package could add more than £100bn to the deficit, more than doubling the budgeted deficit of £99bn established back in March 2022 just before the start of the financial year.
My chart illustrates how the deficit was expected to change from a provisional outturn of £144bn for the deficit in the year ended 31 March 2022, when taxes and other receipts were £914bn and total managed expenditure amounted to £1,058bn.
Last year’s totals included £84bn in COVID-19 related measures (£14bn of tax cuts and £70bn of spending measures) that are not repeated this year, with further spending this year – including continuing to treat COVID-19 patients and tackling NHS backlogs that stem from the pandemic – folded into departmental budgets set during the three-year Spending Review back in October 2021.
Economic growth net of inflation was expected to reduce the deficit by a further £18bn, comprising £21bn in extra receipts from forecast economic growth of 2.2% less £3bn (£41bn on spending, £38bn on receipts) from forecast inflation of 4.1%. The latter uses the GDP deflator measure for the ‘whole economy’ and was estimated at a point when consumer price inflation was expected to reach 8.0% this year.
Inflation also drove much of the jump in interest costs of £27bn in comparison with the previous year, principally because of interest accrued on inflation-linked gilts, but also as a consequence of higher interest rates.
Tax and spending changes amounted to £30bn, comprising £31bn in additional spending less a net £1bn in tax changes. The former comprises a £21bn or 2.0% increase in public spending principally stemming from the 2021 Spending Review, together with £10bn of support for household energy bills announced by former chancellor Rishi Sunak back in February and March 2022. Tax rises were expected to add £20bn to the top line, of which £18bn stems from the rise in national insurance rates from April pending the introduction of the health and social care levy next year. However, this was offset by £19bn in tax cuts and other movements, including a £6bn tax cut from increasing national insurance thresholds, £2bn from cutting fuel duty by 5p, and £1bn from freezing the business rates multiplier.
These changes result in a budgeted deficit of £99bn, being forecast tax and other receipts of £988bn less public spending of £1,087bn.
These amounts exclude £15bn in additional help for energy bills since the budget was finalised in March 2022, partially offset by £5bn from the windfall tax on energy companies announced at the same time. Adjusting for these two items, however, is relatively small beer compared with the large-scale fiscal announcements made by new Chancellor Kwasi Kwarteng. This is before the Office for Budget Responsibility works its magic in updating the fiscal forecasts for changes in the economic situation, taking account of higher inflation and interest rates, and lower economic growth or even an economic contraction.
The worsening economic outlook continues to overshadow the public finances, providing perhaps one of the worst foundations for any incoming Chancellor since the Second World War.
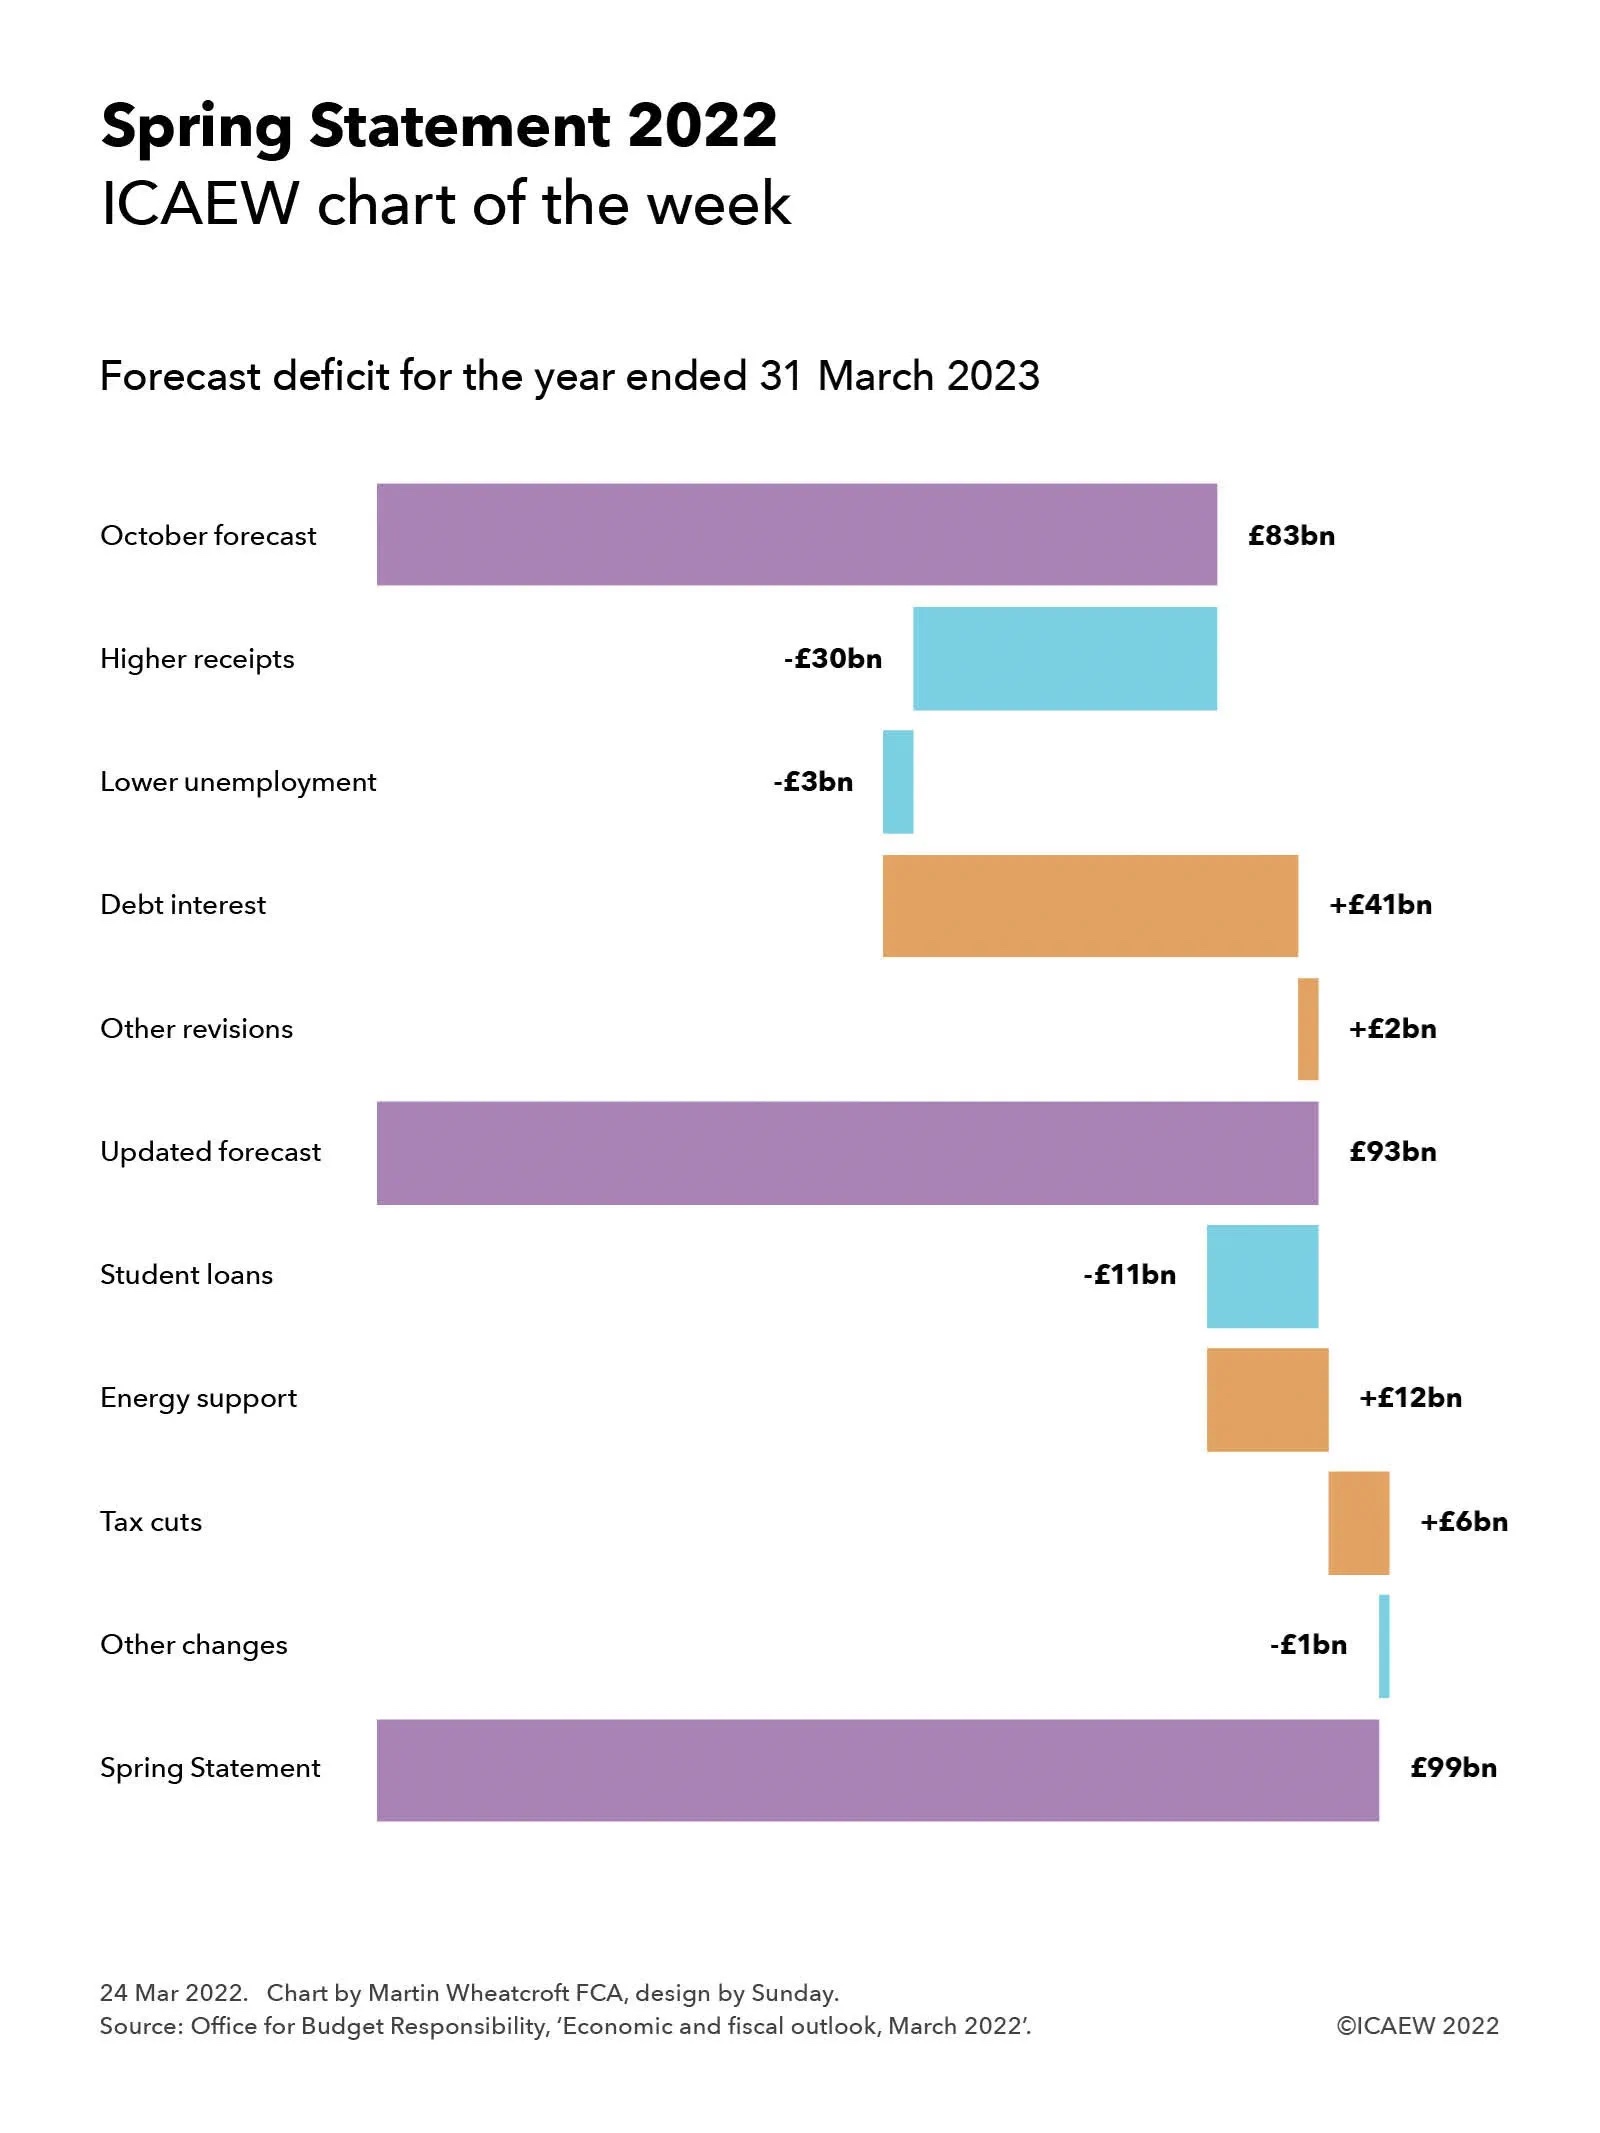
This week we look at the Spring Statement, where the story is all about inflation as the Chancellor responded to the pressures that have contributed to the cost of living crisis.
What Chancellor Rishi Sunak had originally hoped would be a short report to Parliament on the latest economic and fiscal forecasts turned into a fully-fledged fiscal event as he responded to a ‘cost of living’ crisis that is expected to put severe pressure on household budgets and is risking the viability of many businesses. The Office for Budget Responsibility (OBR) estimates that the Chancellor’s energy support package and tax cuts will cover around a third of the decline in living standards expected in the coming financial year.
Inflation is now centre stage in a way that it hasn’t been since the 1970s.
Our chart summarises the changes in the forecast for fiscal deficit the coming financial year commencing on 1 April 2022, showing how last October’s forecast of a £83bn shortfall between receipts and expenditure has increased to a £99bn shortfall in the latest forecasts by the OBR.
The good news is that the economic recovery from the pandemic has been stronger than previously thought, with the pandemic support measures such as the furlough scheme being rewarded with stronger tax receipts coming through into the forecasts. An extra £30bn is expected in 2022/23, complemented by lower unemployment than expected, which also reduces the forecast for welfare spending by an estimated £3bn.
Offsetting that is a huge rise in interest costs. This is driven by a sharp rise in the retail prices index (RPI), to which a substantial proportion of the government’s debt is linked, combined with higher interest rates as the Bank of England attempts to prevent inflation rising even further. These factors add an extra £41bn to the forecast interest bill for next year, bringing it up to £83bn, three and a half times the £24bn in 2020/21 and more than 50% higher than the £54bn now expected for the current financial year. Interest in subsequential financial years has been revised up by around £9bn a year on the basis (the forecasters hope) that inflation is brought back under control in 2023/24.
Other changes to the fiscal forecast add £2bn to the deficit forecast, bringing it up to £93bn before taking account of policy decisions announced since last October. The first, which for some reason was not highlighted by the Chancellor in his speech, was the impact of increasing the amounts that graduates will have to repay on their student loans, reducing the anticipated bad debt write-off in 2022/23 by £11bn from the estimate made last October.
The Chancellor did talk about the energy support package that he announced last month as the energy prices rises coming in April were announced. However, he did not add to that package directly – instead choosing to announce tax cuts of about £6bn in 2022/23. The main element is an increase from July of around £3,000 in the threshold at which National Insurance is payable by employees, which will benefit many low to middle income families, but not (as the Institute for Fiscal Studies, the Resolution Foundation and others have pointed out) the very poorest that will be hit hardest by price rises. More than two thirds of the benefit will go to higher income households.
Overall, the OBR says the energy support package and tax cuts together will offset around a third of the fall in living standards that is expected in the coming year.
Other policy changes amounting to around £1bn were offset by indirect effects of £2bn, resulting in a net £1bn benefit to bring the forecast deficit to £99bn, some £16bn higher in total than that predicted in October.
These numbers don’t include the 1p cut in the basic rate of income tax from 6 April 2024 that was also announced by the Chancellor. This is expected to cost around £6bn a year in lower tax receipts, but is expected to be more than offset by the effect of freezing both income tax and national insurance thresholds (expected to bring in somewhere in the region of £18bn extra a year). In effect, the Chancellor has chosen to bank the ‘benefit’ of higher inflation on his decision to freeze thresholds.
The big question is whether the Chancellor will be able to hold off from providing further support to households and businesses for the rest of the financial year. Most commentators appear to suggest that it is likely that he will return to the despatch box in the House of Commons before the next round of energy prices rises in October in order to make further announcements.
![Exploding debt
Step chart showing how UK public sector net has changed between March 2008 and the projected position in March 2029.
[debt bars shaded orange, changes shaded in purple]
March 2008: £0.6trn
Financial crisis: +£0.7trn
March 2012: £1.3trn
Austerity years: +£0.5trn
March 2020: £1.8trn
Pandemic / energy crisis: +£0.9trn
March 2024: £2.7trn
[bar colours shaded by 50% to indicate the following are projected numbers]
Latest plan: +£0.4trn
March 2029: £3.1trn
30 Nov 2023.
Chart by Martin Wheatcroft FCA. Design by Sunday.
Source: OBR, 'Public finances databank - Nov 2023'.](https://martinwheatcroft.com/wp-content/uploads/2023/11/icaewchart286debt.jpg)
![Public sector finance trends: October 2023
Table showing receipts, expenditure, interest, net investment, deficit, other borrowing and debt movement for the seven months to October 2023 plus net debt and net debt / GDP at 31 October 2023.
Receipts: £466bn (Oct 2019), £425bn (Oct 2020), £500bn (Oct 2021), £565bn (Oct 2022), £595bn (Oct 2023)
Expenditure: (£457bn), (£582bn), (£536bn), (£548bn), (£587bn)
Interest: (£38bn), (£26bn), (£41bn), (£72bn), (£76bn)
Net investment: (£20bn), (£42bn), (£28bn), (£21bn), (£30bn)
[line above subtotal]
Deficit: (£49bn), (£225bn), (£105bn), (£76bn), (£98bn)
Other borrowing: £5bn, (£61bn), (£61bn), £5bn, (£7bn)
[line above total]
Debt movement: (£44bn), (£286bn), (£166bn), (£71bn), (£105bn)
[line below total]
Net debt: £1,821bn, £2,101bn, £2,319bn, £2,454bn, £2,644bn.
Net debt / GDP: 82.1%, 99.3%, 97.5%, 95.5%, 97.8%](https://martinwheatcroft.com/wp-content/uploads/2023/11/2023-10-Trends.jpg)