ICAEW chart of the week: Autumn Statement 2023

My chart for ICAEW this week illustrates how Chancellor Jeremy Hunt used almost all of the available upside from inflation and fiscal drag to fund his tax measures and a series of business growth initiatives.

Autumn Statement 2023

Step chart (waterfall diagram) showing the average change to 2023/24 to 2027/28 forecasts since the Spring Budget 2023.

Forecast revisions (steps in orange):

Inflation +$41bn
Fiscal drag +£7bn
Other changes +£4bn
Debt interest -£21bn
Welfare uprating -£13bn

= Forecast revisions +£18bn (subtotal in purple)

Policy measures (steps in blue):

Tax measures -£11bn
Spending and other -£6bn

= Net changes +£1bn (total in purple)


23 Nov 2023.
Chart by Martin Wheatcroft FCA. Design by Sunday.
Sources: HM Treasury, 'Autumn Statement 2023'; OBR, 'Economic and fiscal outlook, Nov 2023'.

The Autumn Statement 2023 on Wednesday 22 November featured a surprise tax cut to national insurance and a perhaps less surprising decision to make full expensing of business capital expenditure permanent.

As my chart illustrates, the forecasts for the deficit over the next five years benefited by £41bn a year on average in higher receipts from inflation, £7bn a year on average in additional ‘fiscal drag’ as higher inflation erodes the value of frozen tax allowances more quickly, and a net £4bn in other upward forecast revisions. These improvements to the forecasts were offset by an average of £21bn a year in higher debt interest and £13bn from the expected inflation-driven uprating of the state pension and welfare benefits, to arrive at a net improvement of £18bn a year on average over the five financial years from 2023/24 to 2027/28 before policy decisions.

In theory, these upward forecast revisions should be absorbed by more spending on public services as higher inflation feeds through into salaries and procurement costs. However, the Chancellor has chosen to (in effect) sharply cut public spending and use almost all of the upward revisions to fund tax measures and business growth initiatives instead. These amounted to £11bn a year on average in tax changes and £6bn a year on average in spending increases and other changes to reduce the net impact to just £1bn a year on average over the five-year period.

The resulting net change of £1bn on average in forecasts for the deficit is to reduce the forecast deficit by £8bn for the current year (from £132bn to £124bn) and by £1bn for 2024/25 (to £85bn), with no net change in 2025/26 (at £77bn), an increase of £5bn in 2027/28 (to £68bn), and no net change for 2027/28 (at £49bn).

The main tax changes announced were the cuts in national insurance for employees by 2 percentage points from 12% to 10% and by 1 percentage point for the self-employed from 9% to 8%, reducing tax receipts by an average of £9bn over five years. This is combined with the effect of making full expensing permanent of £4bn – this change mainly affects the later years of the forecast (£11bn in 2027/28), although ironically the average is a better proxy for the long-term cost of this change, which the OBR estimates is around £3bn a year. 

Other tax changes offset this to a small extent. 

Spending and other changes of £6bn a year on average comprise incremental spending of £7bn a year plus £2bn higher debt interest to fund that spending, less £3bn in positive economic effects from that spending and from the tax measures above.

Although the cumulative fiscal deficit over five years has been revised down by £4bn, the OBR has revised its forecast for public sector net debt as of 31 March 2028 up by £94bn from to £3,004bn. This principally reflects changes in the planned profile of quantitative tightening and higher lending to students and businesses.

The big gamble the Chancellor appears to be making by choosing to opt for tax cuts now is that the OBR and Bank of England’s pessimistic forecasts for the economy are not realised – enabling him to find extra money in future fiscal events to cover the effect of inflation on public service spending. Otherwise, while it may be possible to cut public spending by as much as the Autumn Statement suggests, it is difficult to see how he can do so without a further deterioration in the quality of public services given he is not providing any additional investment in technology, people and process transformation to deliver sustainable efficiency gains.
This chart was originally published by ICAEW.

ICAEW chart of the week: National Insurance Fund 2020-21

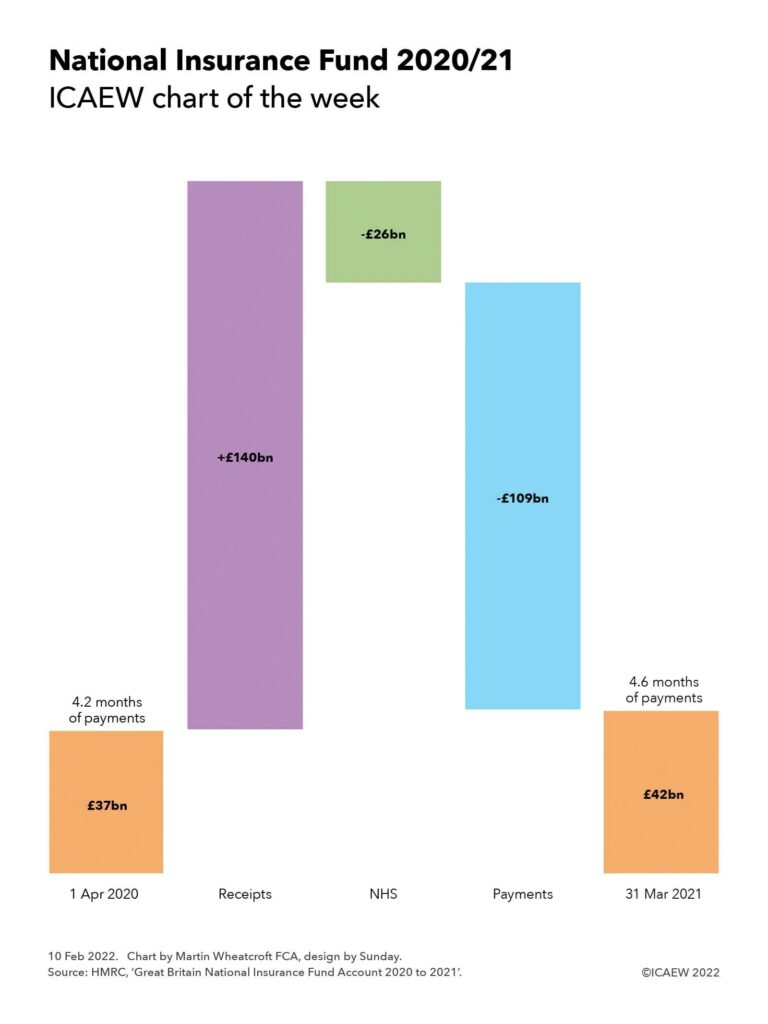
We take a look at the Great Britain National Insurance Fund, illustrating how the balance in the fund grew from the equivalent of 4.2 months of annual payments to 4.6 months over the course of 2020-21.

Step chart showing movements in the Great Britain National Insurance Fund in 20201/21.

Opening balance £37bn (4.2 months of payments) + receipts £140bn - NHS £26bn - payments £109bn = closing balance £42bn (4.6 months of payments).

One of the many myths about the UK’s public finances is around the use of the word ‘fund’. This is often assumed to imply there is a pot of money set aside to cover spending requirements, when in practice it tends to refer to a budget allocation. An example is the National Productivity Investment Fund that was announced in 2016, which turned out to refer to unallocated amounts within the government’s budget for capital expenditure over several years.

Despite this terminology there are some actual ‘funds’ that have a legal basis and which have money in them, such the Contingencies Fund, where cash of £425bn passed through its accounts in response to the pandemic last year (up from £17bn in the previous year). However, net assets remained unchanged by this tidal wave of money at just £2m, highlighting how many such funds are principally mechanisms to facilitate the flow of money around government on the way to its intended destination.

The Great Britain National Insurance Fund and the Northern Ireland National Insurance Fund are perhaps the most well known of these funds, being the source of payments for the state pension and contributory welfare benefits. Surprisingly, there is a balance in these funds, which caused some excitement in a House of Lords debate last year when a peer decided that this was a pot of money that could be used to fund more spending.

Before getting too excited, it is important to understand that although the £42bn in the Great Britain National Insurance Fund sounds like a large amount of money, the reality is that it is more akin to a float, representing less than five months’ worth of annual payments from the fund and a relatively small fraction of the trillions of pounds in future payments expected to be paid out of the fund over the next quarter of a century and beyond. Likewise for the £1bn in the Northern Ireland National Insurance Fund.

In addition, when you delve into the accounts, you discover that most of the balances are invested in HM Treasury’s Debt Management Account, which are in effect intercompany balances (or ‘intra-government’ to be more technically accurate).

As our chart illustrates, the Great Britain National Insurance Fund had a balance of £37bn on 1 April 2020, equivalent to about 4.2 months of expenditure in the 2019/20 financial year. National Insurance receipts in Great Britain (ie, not including Northern Ireland) amounted to £140bn during 2020/21, including £3bn from other tax receipts to make up for contributions not received for those on statutory maternity, paternity, parental or bereavement pay.

Some £26bn of the national insurance contributions was deducted and sent off to help pay for the NHS, reducing the amount added to the fund to £114bn, while payments from the fund during the year amounted to £109bn. The latter comprised £100.4bn for the state pension, £5.2bn to cover contributory welfare benefits (employment and support allowance and jobseeker’s allowance), £0.9bn in administration costs, £0.8bn in bereavement and maternity allowances, £0.7bn in transfers to the Northern Ireland equivalent fund, £0.5bn in redundancy payments and £0.2bn in other payments.

The £5bn or so of surplus was added to the balance of the fund, taking it to £42bn at 31 March 2021, equivalent to 4.6 months of annual payments.

To be fair to the noble lord concerned, it might well be possible to use some of the money in the fund by reducing the effective float balance by a month or two, at least on a one-off basis. However, in the context of public spending in excess of £1.2tn a year and public sector net debt of £2.3tn, it is not likely to go that far!

This chart was originally published by ICAEW.

ICAEW chart of the week: personal tax bands

This week’s chart examines the complexity in the tax system and potential options for reform by looking at the number of tax bands for salaried employees across the UK.

Chart showing personal tax bands from £150,000 (45% UK income tax +1% Scottish income tax + 2% Employee national insurance) down to £0.

See text for more details.

The new tax year saw the introduction of an additional tax band to the UK system of personal taxation, bringing the total number to nine tax bands in England, Wales and Northern Ireland and twelve in Scotland.

The #icaewchartoftheweek continues on the theme of complexity in the tax system and potential options for tax reform by looking at the number of tax bands for salaried employees, with up to nine tax bands in England, Wales and Northern Ireland and up to twelve in Scotland.

Although the advertised personal tax allowance of £12,570 a year suggests that individuals only start to pay tax above that point, in practice ‘taxation’ in its wider sense can start from as little as £0, which is when some of those claiming universal credit start to have their benefits withdrawn at a rate of 63p in the pound. The threshold is £0 for those without dependent children, £3,516 for those on housing benefit and with dependent children or limited capability to work, or £6,180 for those with dependent children or limited capability to work who are not on housing benefit. The rate of withdrawal is even higher for those receiving council tax benefit, with an additional 20% or more levied on incomes above a certain level until it is fully clawed back – the details vary by council.

Tax in its more formal sense starts at £9,568 when employee national insurance of 12% starts to be levied. Although ‘constitutionally’ different in how the money collected is used and its role in entitlement to the state pension, in substance it operates as an income tax in all but name.

Income tax itself starts to be levied on earnings above £12,570 at a basic rate of 20%, adding to national insurance to give a marginal tax rate of 32% for those not on universal credit and 74.8% for those who are.

For those in England, Wales and Northern Ireland this tax band goes from £12,570 up to £50,000 but in Scotland, there are intermediate tax bands, with a lower rate of income tax of 19% between £12,570 and £14,667, 20% between £14,667 and £25,926, 21% between £25,926 and £43,662, and 41% above £43,662 when the higher rate of Scottish income tax kicks in.

The new tax band this year arises because the government failed to increase the £50,000 threshold at which child benefit is withdrawn from the higher-earning parent to align with the increase in the higher rate tax threshold to £50,270. This means the insertion of a new tax band between £50,000 and £50,270 as the government starts to withdraw entitlement to ‘universal’ child benefit of £21.15 a week for the eldest child and £14.00 a week for remaining children by collecting an additional tax of 11% for the eldest child and 7.3% for the second and each of any subsequent children.

Above £50,270, the higher rate of income tax of 40% starts to be levied in England, Wales and Northern Ireland, but the marginal rate of national insurance reduces to 2% meaning that this is a 10% increase from 32% to 42% in the combined marginal rate – at least assuming you don’t have children! This rate also applies to those with children from £60,000 up until £100,000 when the marginal rate jumps to 62% (63% in Scotland) as the personal income tax allowance is gradually withdrawn. The marginal rate reverts to 42% (43%) from £125,140 before increasing to 47% (48%) for those on the 45% top rate of income tax above £150,000.

While devolution has led to some of the complexity, this probably hasn’t been helped by the perennial tendency of governments to find ever more complicated approaches to extract additional money from taxpayers without touching the headline rates of tax – for example through the ‘withdrawal’ of the personal tax allowance, which in substance operates as an additional 20% tax payable by those earning between £100,000 and £125,140.

The consequence of this tinkering with the tax systems means there are now nine different tax bands in England, Wales and Northern Ireland with marginal tax rates of 0%, 12%, 32%, 32% + 11% (or more) for higher-earning parents, 42% + 11% (or more) for higher-earning parents, 42%, 62%, 42% and 47%. In Scotland there are twelve: 0%, 12%, 31%, 32%, 33%, 53%, 53% + 11% (or more) for higher earning parents, 43% + 11% (or more) for higher earnings parents, 43%, 63%, 43% and 48%. 

Such a complex system invites the question of how it might be reformed, with the possibility of increasing the national insurance threshold to align with the income tax personal allowance being actively discussed in recent years to eliminate one of the bands. However, this now seems less likely than it once did since the pandemic caused such damage to the public finances. Other ideas have included aligning the 40% higher rate and 45% top rate of income tax (either up or down depending on political preference) or ‘folding’ in the personal tax allowance withdrawal into the tax system as part of the higher or top tax rates in conjunction with a reform to tax thresholds.

However, another option would be to add even more complexity, a real possibility now the Welsh government has obtained devolved powers to adjust its income tax rates and thresholds like Scotland, albeit powers that have thankfully not been used so far.

Either way, the nirvana that some tax reformers aspire to of a single flat rate of income tax applying to all earnings seems more remote than ever. One can but dream!

This chart was originally published by ICAEW.

ICAEW chart of the week: personal taxation by legal form

ICAEW’s chart this week compares the differences in the tax payable depending on legal form – an area ripe for reform in theory, but much more difficult in practice.

Chart showing tax payable on £80,000 of business earnings:

Employee - income tax: 20.0%, employee NI 6.6%, employer NI 10.7% - take home pay 62.7%.

Self-employed - income tax: 24.3%, employee NI 5.5% - take home pay 70.2%.

Company owner - income tax 9.9%, corporation tax 16.9% - take home pay 73.2%.

Comments by the Chancellor last year suggested he might tackle one of the thorniest challenges in the UK tax system – the differences in tax paid by individuals depending on the legal form through which they conduct their business activities. However, as the controversy over IR35 has demonstrated, a significant amount of political capital is likely to be needed if changes are to be made.

The #icaewchartoftheweek provides an illustrative example of just how significant the differences can be, with £80,000 in business earnings attracting an effective tax rate of 37.3% if paid to an employee on a salary of £71,460, 29.8% if paid to an individual who is self-employed or in a partnership, or 26.8% if earned through a company and distributed as dividends. 

(It is important to note that this is a theoretical illustrative example for a single person with no other earnings and not paying any pension contributions, with the company owner in the example paying a salary equivalent to the secondary threshold for national insurance before paying the rest as dividends. Actual amounts of tax paid will of course depend on both business and individual circumstances, which can vary significantly.)

The last decade or so has seen a significant increase in the numbers of people becoming self-employed or conducting business through their own companies, and the tax authorities have been concerned about the loss in tax that has followed. One way they have sought to tackle this is by removing the tax benefits of being self-employed or operating through a company from some people, which is the approach adopted by IR35. Coming into force this month, IR35 in effect creates a new legal status of ‘deemed employee’ for tax purposes, reclassifying individuals back into the scope of employment taxes. This has proved highly controversial, accompanied as it is by extensive compliance requirements and general unhappiness by those determined to be subject to it.

Another potential approach would be to change the taxes and tax rates applying to three different forms – either by reducing the taxes on employees or by increasing them on the self-employed or those operating through companies. The former seems unlikely given the state of the public finances, but the challenge in increasing rates can be extremely politically difficult, as former Chancellor Philip Hammond found a few years ago when he proposed a relatively modest increase in the amount of national insurance to be paid by the self-employed.

Whether current Chancellor of the Exchequer Rishi Sunak will take forward a suggestion he made last year when he announced the self-employed income support scheme last year that taxes on the self-employed might rise is yet to be seen. However, what is likely is that this and future Chancellors will continue to look at this particular aspect of the tax system and wonder how they might collect a little more from the ranks of the self-employed and company owners. 

This chart was originally published by ICAEW.