ICAEW chart of the week: IMF Fiscal Monitor

Our chart this week finds that the UK is ranking highly in the IMF’s latest five-year forecasts for general government net debt.

Bar chart

General government net debt/GDP: 2029 forecast

Emerging and developing economies (green bars)
World (purple bar)
Advanced economies (blue bar)
UK (red bar)

Kazakhstan (green) 8%
Canada (blue) 13%
Saudi Arabia (green) 22%
Iran (green) 23%
Australia (blue) 24%
South Korea (blue) 29%
Türkiye (green) 30%
Indonesia (green) 37%
Germany (blue) 43%
Netherlands (blue) 43%
Nigeria (green) 47%
Mexico (green) 51%
Poland (green) 55%
Egypt (green) 56%
Pakistan (green) 61%
Brazil (green) 70%
World (purple) 79%
South Africa (green) 84%
Spain (blue) 92%
UK (red) 98%
France (blue) 107%
US (blue) 108%
Italy (blue) 136%
Japan (blue) 153%


18 Apr 2024.
Chart by Martin Wheatcroft FCA. Design by Sunday.
Source: IMF Fiscal Monitor: 17 Apr 2024.

©️ ICAEW 2024

The International Money Fund (IMF) released its latest IMF Fiscal Monitor on 17 April 2024, highlighting how public debts and deficits are higher than before the pandemic and public debts are expected to remain high. The IMF says: “Amid mounting debt, now is the time to bring back sustainable public finances”, commenting that as prospects for a global economic soft landing have improved, it is time for action to bring government finances back under control. 

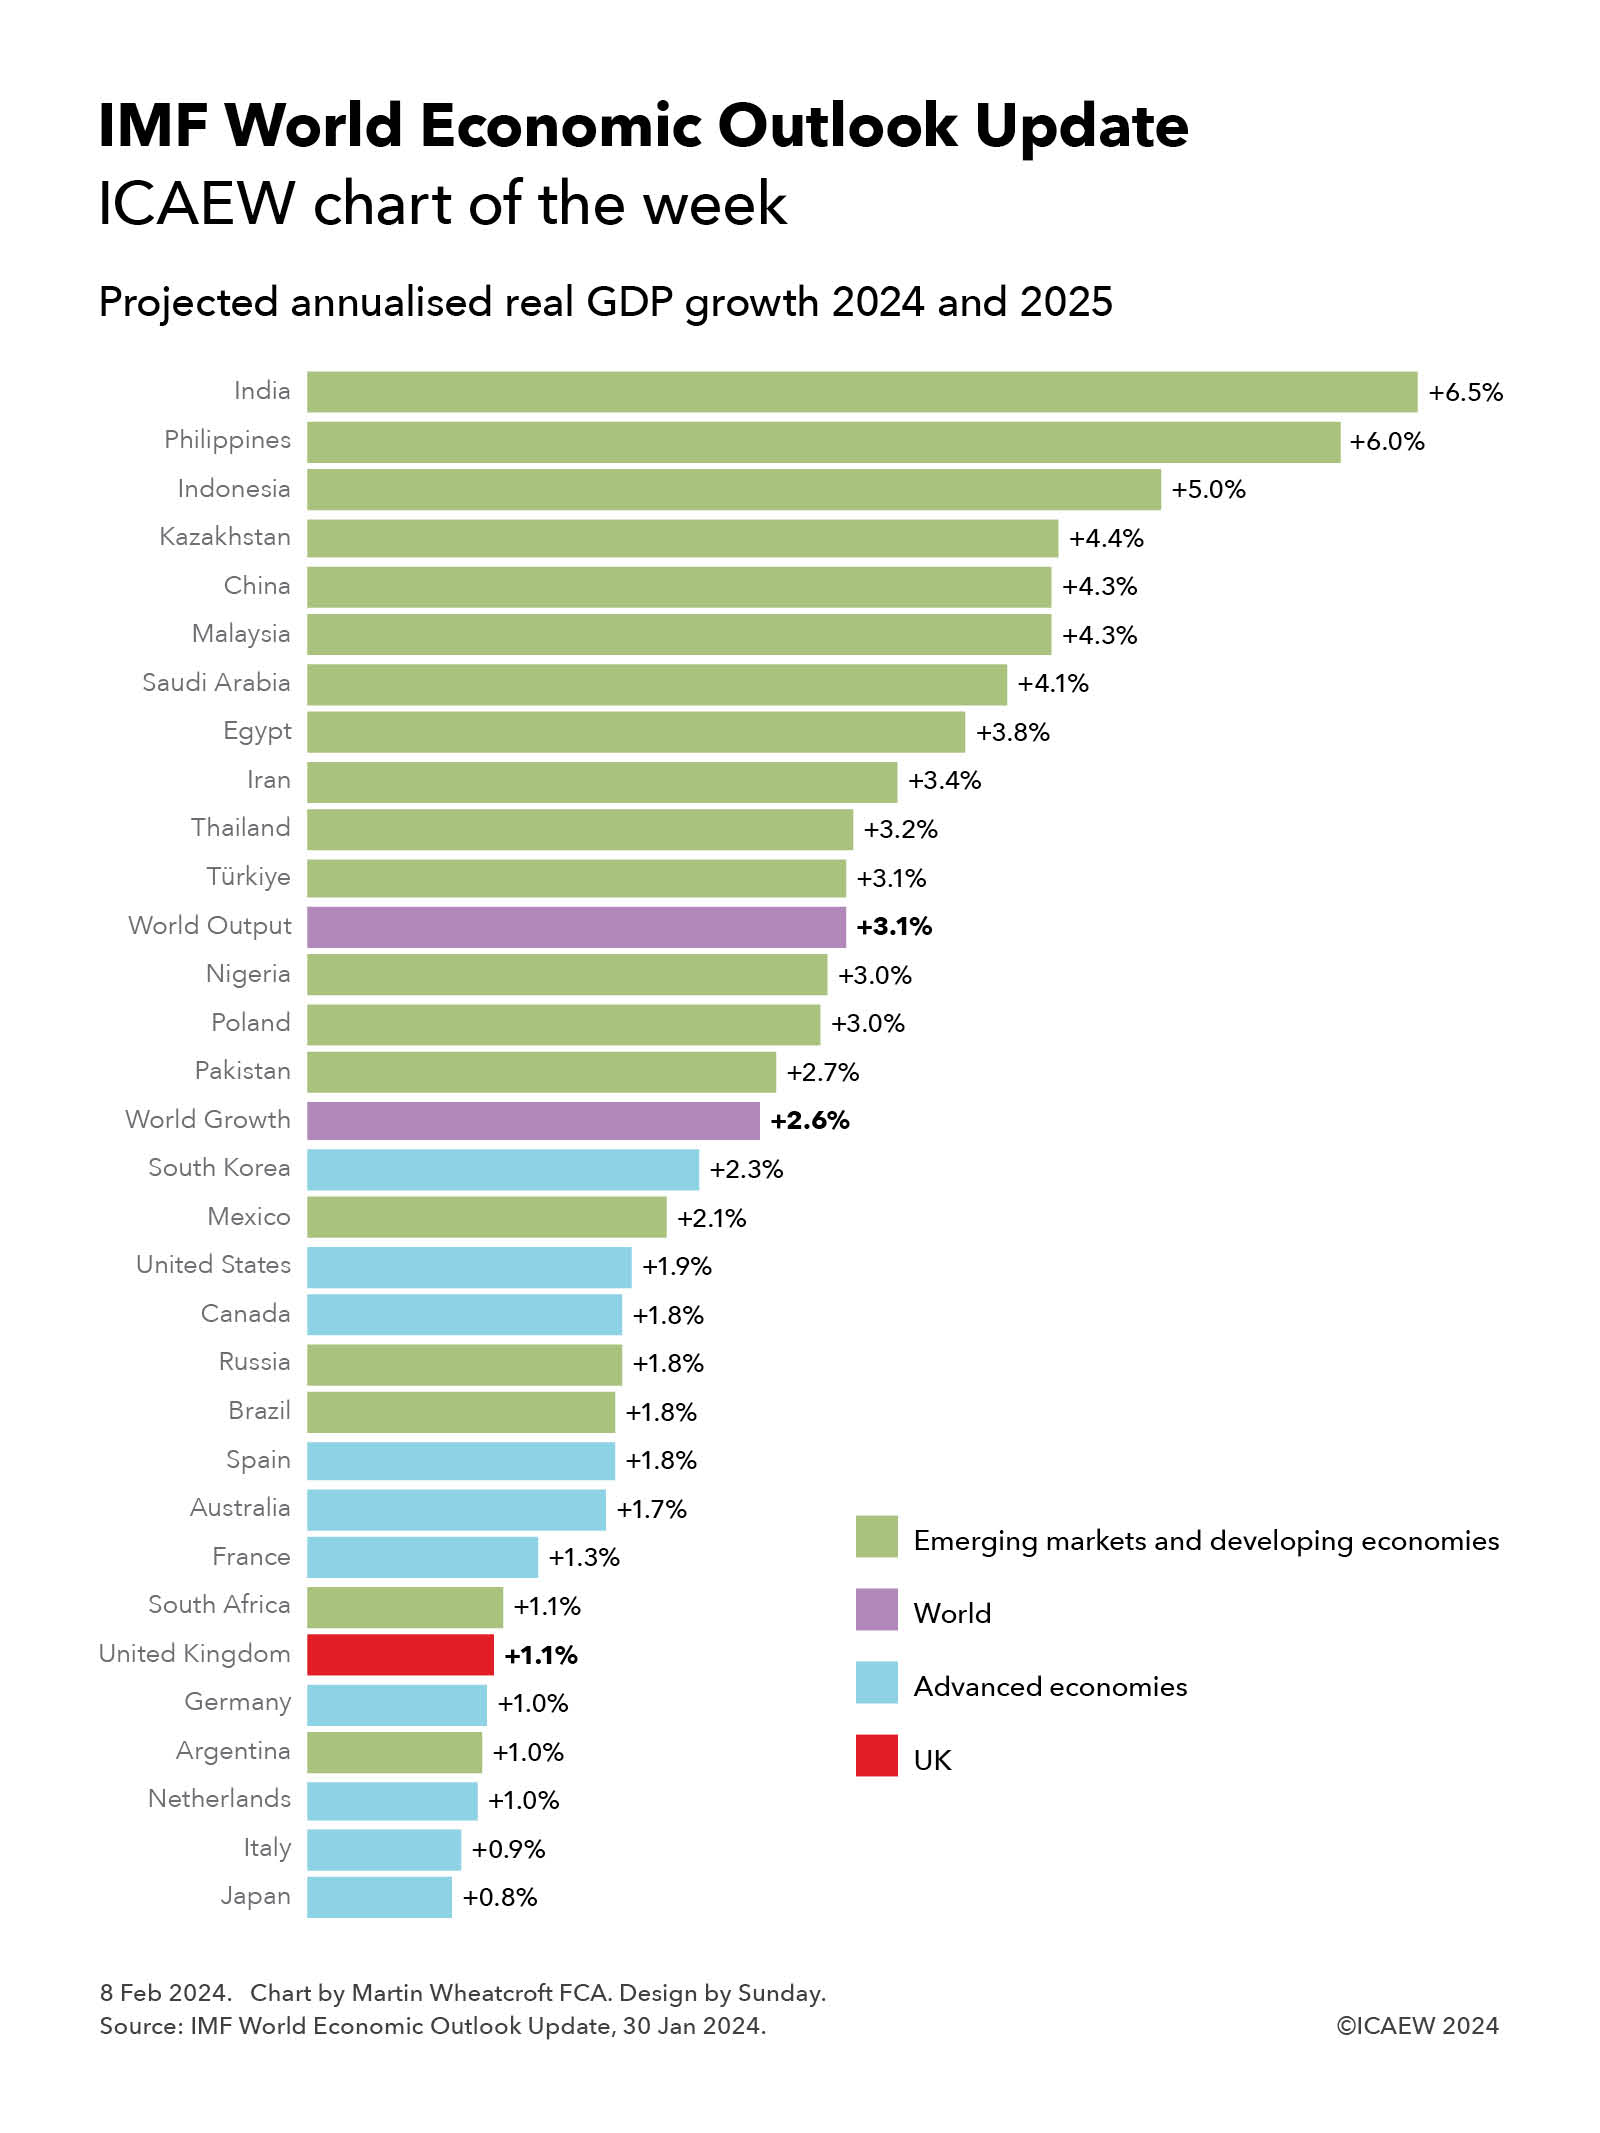
Our chart this week illustrates how the UK is one of the ‘leading’ nations in government borrowing, with general government net debt projected by the IMF to reach 98% of GDP by 2029, compared with 92.5% in 2023. (Note: general government net debt is different to the public sector net debt measure used in the UK public finances – the latter includes the Bank of England and other public corporations.)

The chart illustrates how the major countries with the largest debt burdens tend to be advanced economies, with Spain (92% of GDP), the UK (98%), France (107%), US (108%), Italy (136%) and Japan (153%) having debt levels close to, or exceeding, the sizes of their economies.

Some countries are in much better fiscal positions, with Germany expected to bring its general government net debt down to 43% of GDP by 2029, while the Netherlands (43%), South Korea (29%), Australia (24%) and Canada (13%) also have relatively low levels of public debt compared with other advanced economies.

Emerging market ‘middle-income’ and ‘low-income’ developing countries often have much lower levels of public debt than advanced countries, often simply because it is more difficult for them to borrow to the same extent as well as not having the same scale of welfare provision as richer countries to finance. Examples include Kazakhstan (projected to have a general government debt of 8% of GDP in 2029), Saudi Arabia (22%), Iran (23%), Türkiye (30%) and Indonesia (37%). However, that does not stop some emerging and developing countries borrowing more, such as Nigeria (47%), Mexico (51%), Poland (55%), Egypt (56%), Pakistan (61%), Brazil (70%) and South Africa (84%).

Not shown in the chart are China and India for which no net debt numbers are available. The IMF projects them to have general government gross debt in 2029 of 110% and 78% of GDP respectively, indicating how their public debts have grown substantially in recent years. However, without knowing their levels of cash holdings it is less clear where they stand in the rankings.

Also not shown is Norway, the only country with negative general government net debt reported by the IMF. Norway’s general government net cash is projected to reach 139% of GDP in 2029, up from 99% in 2023.

As with all metrics, there are some issues in comparing the circumstances of individual countries. Many countries will also have investments, other public assets, or natural resource rights that are not netted off against debt, while many will also have other liabilities or financial commitments that aren’t counted within debt. For example, the UK has significant liabilities for unfunded public sector pensions as well as even larger financial commitments to the state pension, either of which, if included, would move the UK above the US in the rankings.

The IMF believes that as the world recovers from the pandemic and inflation is brought under control, it is important for countries to start tackling the deficits in the public finances and start bringing down the level of public debt. 

This may be difficult for countries such as the UK where significant pressures on the public finances mean public debt is expected to increase over the medium term rather than fall.

This chart was originally published by ICAEW.

ICAEW chart of the week: IMF World Economic Outlook Update

My chart for ICAEW this week illustrates how countries rank in the IMF’s latest forecasts for economic growth over 2024 and 2025.

IMF World Economic Outlook Update
ICAEW chart of the week

(Horizontal bar chart)

Legend:

Emerging markets and developing economies (green)
World (purple)
Advanced economies (blue)
UK (red)

Projected annualised real GDP growth 2024 and 2025

Bars in green except where noted.

India: +6.5%
Philippines: +6.0%
Indonesia: +5.0%
Kazakhstan: +4.4%
China: +4.3%
Malaysia: +4.3%
Saudi Arabia: +4.3%
Egypt: +3.8%
Iran: +3.4%
Thailand: +3.2%
Türkiye: +3.1%
World Output: +3.1% (purple)
Nigeria: +3.0%
Poland: +3.0%
Pakistan: +2.7%
World Growth: +2.6% (purple)
South Korea: +2.3% (blue)
Mexico: +2.1%
United States: +1.9% (blue)
Canada: +1.8% (blue)
Russia: +1.8%
Brazil: +1.8%
Spain: +1.8% (blue)
Australia: +1.7% (blue)
France: +1.3% (blue)
South Africa: +1.1%
United Kingdom: +1.1% (red)
Germany: +1.0% (blue)
Argentina: +1.0%
Netherlands: +1.0% (blue)
Italy: +0.9% (blue)
Japan: +0.8% (blue)


8 Feb 2024.
Chart by Martin Wheatcroft FCA. Design by Sunday.
Source: IMF World Economic Outlook Update, 30 Jan 2024.

(c) ICAEW 2024

Each January, the International Money Fund (IMF) traditionally releases an update to its World Economic Outlook forecasts for the global economy. This year it says that it expects the global economy to grow by an average of 2.6% over the course of 2024 and 2025 at market exchange rates, or by 3.1% when using the economists-preferred method of converting currencies at purchasing power parity (PPP).

The chart shows how the 30 countries tracked by the IMF fit between emerging market and developing economies, most of which are growing faster than the global averages, and advanced economies, which tend to grow less quickly. 

The biggest drivers of the global forecast are the US, China and the EU, with both the US and China expected by the IMF to grow less strongly on average over the next two years than in 2023. This contrasts with an improvement over 2023 (which involved a shrinking economy in Germany) by the advanced national economies in the EU over the next two years – apart from Spain, which is expected to fall back from a strong recovery in 2023. 

Growth in emerging and developing countries is expected to average 4.1% over the two years, led by India (now the world’s fifth largest national economy after the US, China, Germany and Japan), followed by the Philippines, Indonesia, Kazakhstan growing faster than China, followed by Malaysia, Saudi Arabia, Egypt, Iran, Thailand and Türkiye. 

Nigeria, Poland and Pakistan are expected to grow slightly less than world economic output, followed by Mexico. 

Russia, Brazil and South Africa are expected to grow less strongly, while Argentina is expected to grow the least, with a forecast contraction in 2024 expected to be followed by a strong recovery in 2025.

The strongest-growing of the advanced economies in the IMF analysis continues to be South Korea, followed by the US, Canada, Spain, Australia, France, the UK, Germany, the Netherlands and Italy, with Japan expected to have the lowest average growth. Overall, the advanced economies are expected to grow by an average of 1.6% over the next two years.

For the UK, forecast average growth of 1.0% over the next two years is expected to be faster than the 0.5% estimated for 2023, but at 0.6% in 2024 and 1.6% in 2025 we may not feel that much better off in the current year.

Of course, forecasts are forecasts, which means they are almost certainly wrong. However, they do provide some insight into the state of the world economy and how it appears to be recovering the pandemic.

For further information, read the IMF World Economic Outlook Update.

More data

Not shown in the chart are the estimate for 2023 and the breakdown in 2024 and 2025, so for those who are interested, the forecast percentage growth numbers are as follows:

Emerging market and developing countries:

CountryAverage over
2024 and 2025
2023
Estimate
2024
Forecast
2025
Forecast
India6.5%6.7%6.5%6.5%
Philippines6.0%5.3%6.0%6.1%
Indonesia5.0%5.0%5.0%5.0%
Kazakhstan4.4%4.8%3.1%5.7%
China4.3%5.2%4.6%4.1%
Malaysia4.3%4.0%4.3%4.4%
Saudi Arabia4.1%-1.1%2.7%5.5%
Egypt3.8%3.8%3.0%4.7%
Iran3.4%5.4%3.7%3.2%
Thailand3.2%2.5%4.4%2.0%
Türkiye3.1%4.0%3.1%3.2%
Nigeria3.0%2.8%3.0%3.1%
Poland3.0%0.6%2.8%3.2%
Pakistan2.7%-0.2%2.0%3.5%
Mexico2.1%3.4%2.7%1.5%
Russia1.8%3.0%2.6%1.1%
Brazil1.8%3.0%2.6%1.1%
South Africa1.1%0.6%1.0%1.3%
Argentina1.0%-1.1%-2.8%5.0%

Advanced economies (including the UK): 

CountryAverage over
2024 and 2025
2023
Estimate
2024
Forecast
2025
Forecast
South Korea2.3%1.4%2.3%2.3%
USA1.9%2.5%2.1%1.7%
Canada1.8%1.1%1.4%2.3%
Spain1.8%1.1%1.4%2.3%
Australia1.7%1.8%1.4%2.1%
France1.3%0.8%1.0%1.7%
UK1.1%0.5%0.6%1.6%
Germany1.0%-0.3%0.5%1.6%
Netherlands1.0%0.2%0.7%1.3%
Italy0.9%0.7%0.7%1.1%
Japan0.8%1.9%0.9%0.8%

This chart was originally published by ICAEW.

ICAEW chart of the week: BRICS+

The ICAEW chart of the week returns from its summer holidays to look at the planned expansion of BRICS from five to 11 countries.

Venn diagram showing the G20, G7, BRICS, and BRICS+:

G20 in green, encompassing G7 in teal with USA, Japan, Canada and UK plus in blue with dotted line around Germany, France, Italy and the European Union (the EU members of the G7).

Then five countries in G20, but not in the G7, BRICS or BRICS+, being Korea, Australia, Mexico, Indonesia and Türkiye.

Tne BRICS+ in purple with Argentina and Saudi Arabia followed by BRICS in orange with Brazil, Russia, India, China and South Africa. Still in the BRICS+ purple, but outside the G20 green are Ethiopia, Iran, Egypt and UAE.

Sources: G20, G7, BRICS.

Footnote gives share of global GDP: G20 86%. G7 52% (USA 26%, EU 17%), KAMIT 7%, BRICS 25%, BRICS+ 28%.

“The BRICs” was originally coined by Jim O’Neill in 2001 as an abbreviation for Brazil, Russia, India and China, four fast-growing economies that he predicted would come to dominate the world economy.

This investment shorthand evolved into something more substantive in 2006 when ministers from the four countries got together on the sidelines of a meeting at the UN. Leader summits started in 2009, followed by the addition of South Africa in 2011, which resulted in the capitalisation of the final ‘s’ to form BRICS. 

BRICS has developed over time to become a counterweight to the G7, providing an alternative forum for leaders of these five major nations to discuss common concerns such as economic development, currency stability, climate change, and tackling drug trafficking and organised crime. BRICS has been increasingly important to Russia since its ejection from the G7 (then the G8) following its invasion of Crimea in 2014 and to China as relations with the G7 have deteriorated over the last decade.

The most recent summit (the 15th) was on 22-24 August 2023, at which it was announced that six additional countries would be joining on 1 January 2024 to bring the number of members to 11.

Our chart this week takes the form a Venn diagram to illustrate how BRICS, and the expanded “BRICS+” grouping (pending a new official name), fit with two other major intergovernmental organisations where leaders meet on a regular basis – the G7 and the G20.

It starts with the G20, a grouping of 19 nations and the European Union that together represent 86% of the global economy. Within this sit the eight members of the G7 group of advanced economies, representing 52% of the global economy: the USA (26%), Japan (4%), the UK (3%), Canada (2%), Germany (4%), France (3%), Italy (2%) and the European Union (17% including Germany, France and Italy). The five BRICS nations represent 25% of the global economy comprising: Brazil (2%), Russia (1.7%), India (4%), China (17%) and South Africa (0.4%).

The diagram is complicated by the expanded BRICS+ as although invitees Argentina (0.6%) and Saudi Arabia (1.0%) are also members of the G20, the other four new members – Ethiopia (0.2%), Iran (0.3%), Egypt (0.3%) and the United Arab Emirates (0.5%) – are outside the G20. These new members together represent 3% of the global economy, taking the expanded BRICS+ to 28%.

Squeezed between the G7 and BRICS+ are five G20 members that together make up around 7% of the global economy that are not in either grouping, being (South) Korea (1.6%), Australia (1.6%), Mexico (1.8%), Indonesia (1.4%) and Türkiye (0.8%). As yet there is no sign of an intergovernmental organisation for these “KAMIT” nations to complement the G7 and BRICS, although in practice they are often invited as guests to G7 summits in addition to their participation in meetings of the G20.

The attraction of intergovernmental forums such as the G7, BRICS and the G20 is that they enable national leaders to engage directly with their counterparts on a wide range of topics, in contrast to the often narrower focus and more formal diplomatic structures of treaty-based international organisations such as the Organisation for Economic and Co-operation Development (OECD), the World Bank or the Organisation of American States (OAS) for example.

Their informal nature gives national leaders more flexibility to (for example) change their memberships without lengthy treaty negotiations or to work together on pressing issues of mutual concern. However, that informality also makes it difficult to create binding resolutions, which is perhaps why the global alternative reserve currency proposed at the first BRICS summit in 2009 had still not been implemented by the time of the 15th summit this August. 

Read more: G20G7BRICS.

ICAEW chart of the week: global military spending

19 March 2021: The UK’s Integrated Review is the inspiration for this week’s chart, illustrating the 20 countries around the world that spend the most on their militaries.

Chart showing global military spending in 2019 led by USA (£526bn) and China (£200bn) followed by 18 other countries - see text below the chart for details.

The UK Government launched its Integrated Review of Security, Defence, Development and Foreign Policy on 16 March 2021, setting out a vision for the UK’s place in the world following its departure from the European Union and in the context of increasing international tensions and emerging security threats.

At the core of the Integrated Review is security and defence, and ICAEW’s chart of the week illustrates one aspect of that by looking at military spending around the world. 

The chart shows spending by the top 20 countries, which together comprise in the order of £1.2tn of estimated total military spending of around £1.4tn to £1.5tn globally in 2019 – an almost textbook example of the 80:20 rule in action.

More than a third of the total spend is incurred by just one country – the USA – which spent in the order of £526bn in 2019 converted at current exchange rates. The next biggest were China and India at £200bn and £50bn respectively, although differences in purchasing power mean that they can afford many more soldiers, sailors and aircrew for the same amount of money. This is followed by Saudi Arabia (£45bn), Russia (£41bn), France (£38bn), the UK (£38bn), Germany (£38bn), Japan (£34bn), South Korea (£33bn), Australia (£21bn), Italy (£20bn), Canada (£17bn), Israel (£16bn), Brazil (£14bn), Spain (£13bn), Turkey (£11bn), the Netherlands (£9bn), Iran (£9bn) and Poland (£9bn).

Exchange rates affect the relative orders of many countries in the list, for example between Russia, France, the UK and Germany which can move up or down according to movements in their currencies, while there are a number of caveats over the estimates used given the different structures of armed forces around the world and a lack of transparency in what is included or excluded in defence budgets in many cases.

In addition, the use of in-year military spending does not necessarily translate directly into military strength. Military capabilities built up over many years or in some cases (such as the UK) over many centuries need to be taken into account, as do differing levels of technological development and spending on intelligence services, counter-terrorism and other aspects of security. Despite these various caveats, estimated military spending still provides a useful proxy in understanding the global security landscape and in particular highlights the UK’s position as a major second-tier military power – in the top 10 countries around the world.

Global Britain in a Competitive Age: the Integrated Review of Security, Defence, Development and Foreign Policy sets out some ambitious objectives for security and defence, which it summarises as follows: “Our diplomatic service, armed forces and security and intelligence agencies will be the most innovative and effective for their size in the world, able to keep our citizens safe at home and support our allies and partners globally. They will be characterised by agility, speed of action and digital integration – with a greater emphasis on engaging, training and assisting others. We will remain a nuclear-armed power with global reach and integrated military capabilities across all five operational domains. We will have a dynamic space programme and will be one of the world’s leading democratic cyber powers. Our diplomacy will be underwritten by the credibility of our deterrent and our ability to project power.”

The estimates of military spending used in the chart were taken from the Stockholm International Peace Research Institute (SIPRI)’s Military Expenditure Database, updated to current exchange rates.

This chart was originally published by ICAEW.