ICAEW chart of the week: NZ government balance sheet

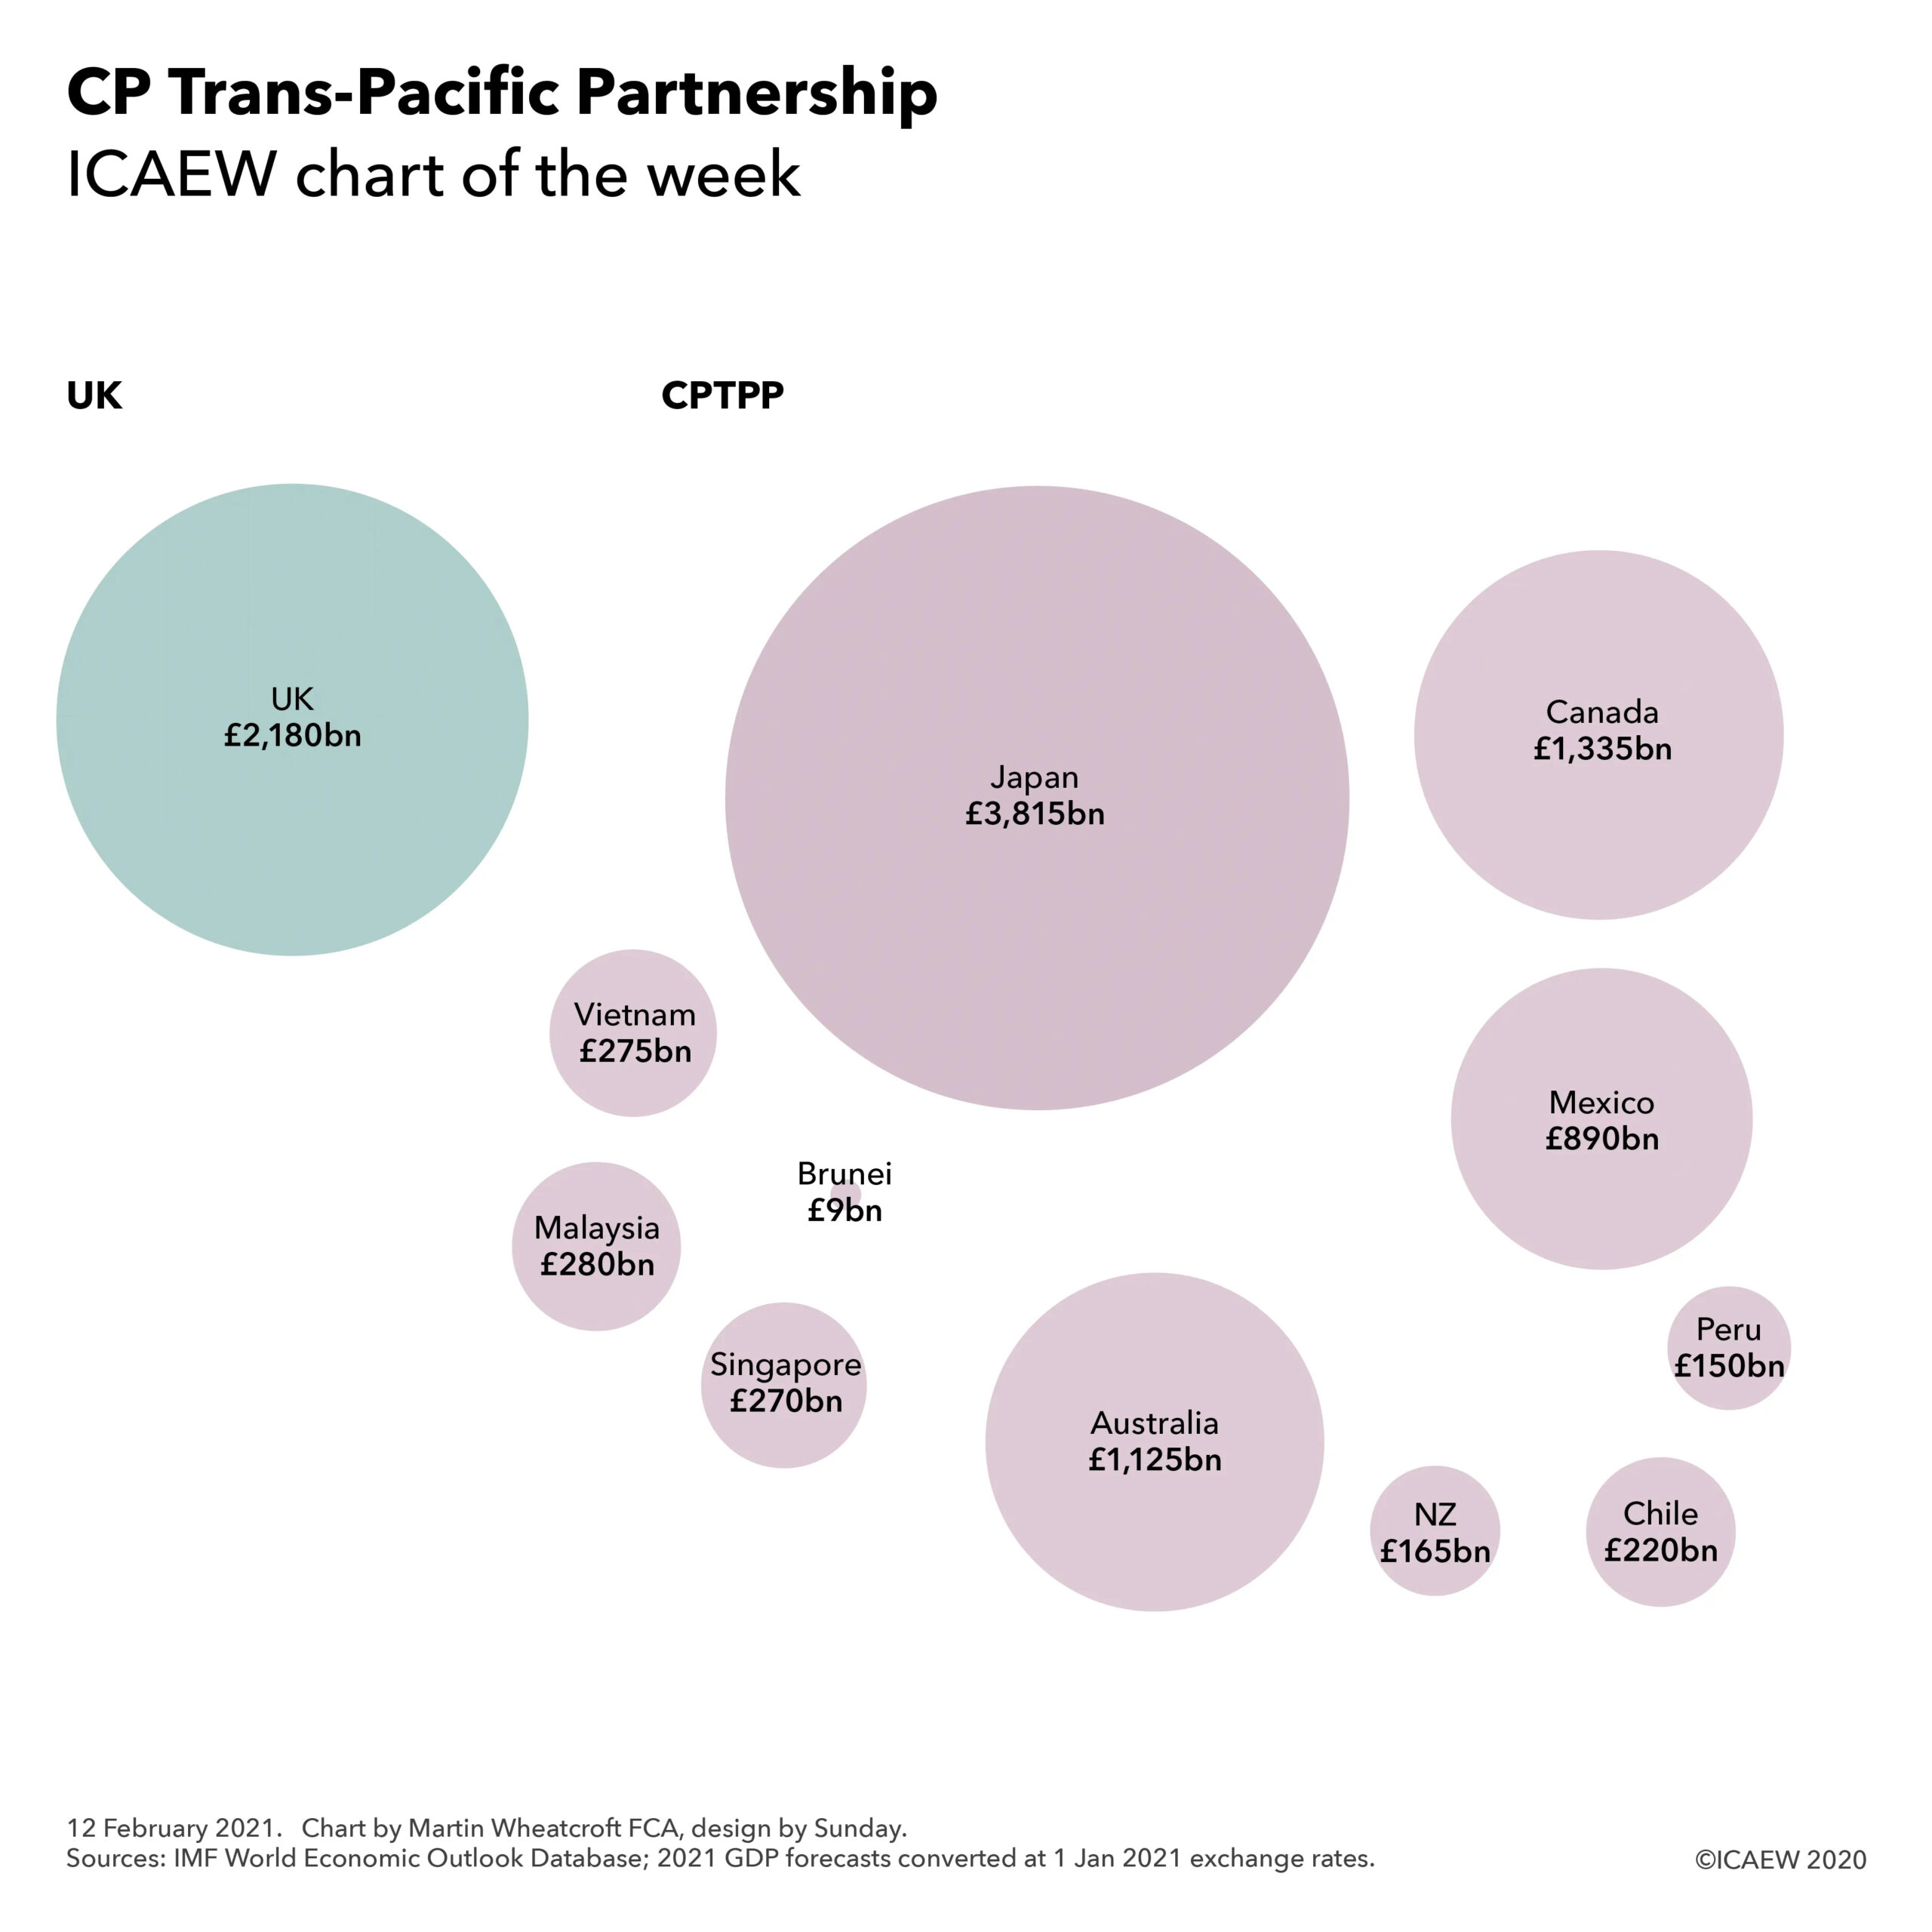
Our chart this week delves into New Zealand’s public finances, one of the very few developed countries to have a government balance sheet with positive net assets.

Step chart illustrating New Zealand government balance sheet.

Assets NZ$438bn = PP&E NZ$ 213bn + Other assets NZ$ 24bn + Financial assets NZ$ 201bn.

Liabilities NZ$ 281bn = Borrowings NZ$ 163bn + Insurance liabilities NZ$ 60bn + Other liabilities NZ$ 58bn.

Net worth NZ$ 157bn = Taxpayer funds NZ$ 20bn + Revaluation and other reserves NZ$ 137bn.

The signing of the UK-New Zealand Free Trade Agreement on 28 February 2022 prompted us to take a look at New Zealand’s public finances, one of the few developed countries with public assets in excess of public liabilities, and a pioneer of accruals accounting in government.

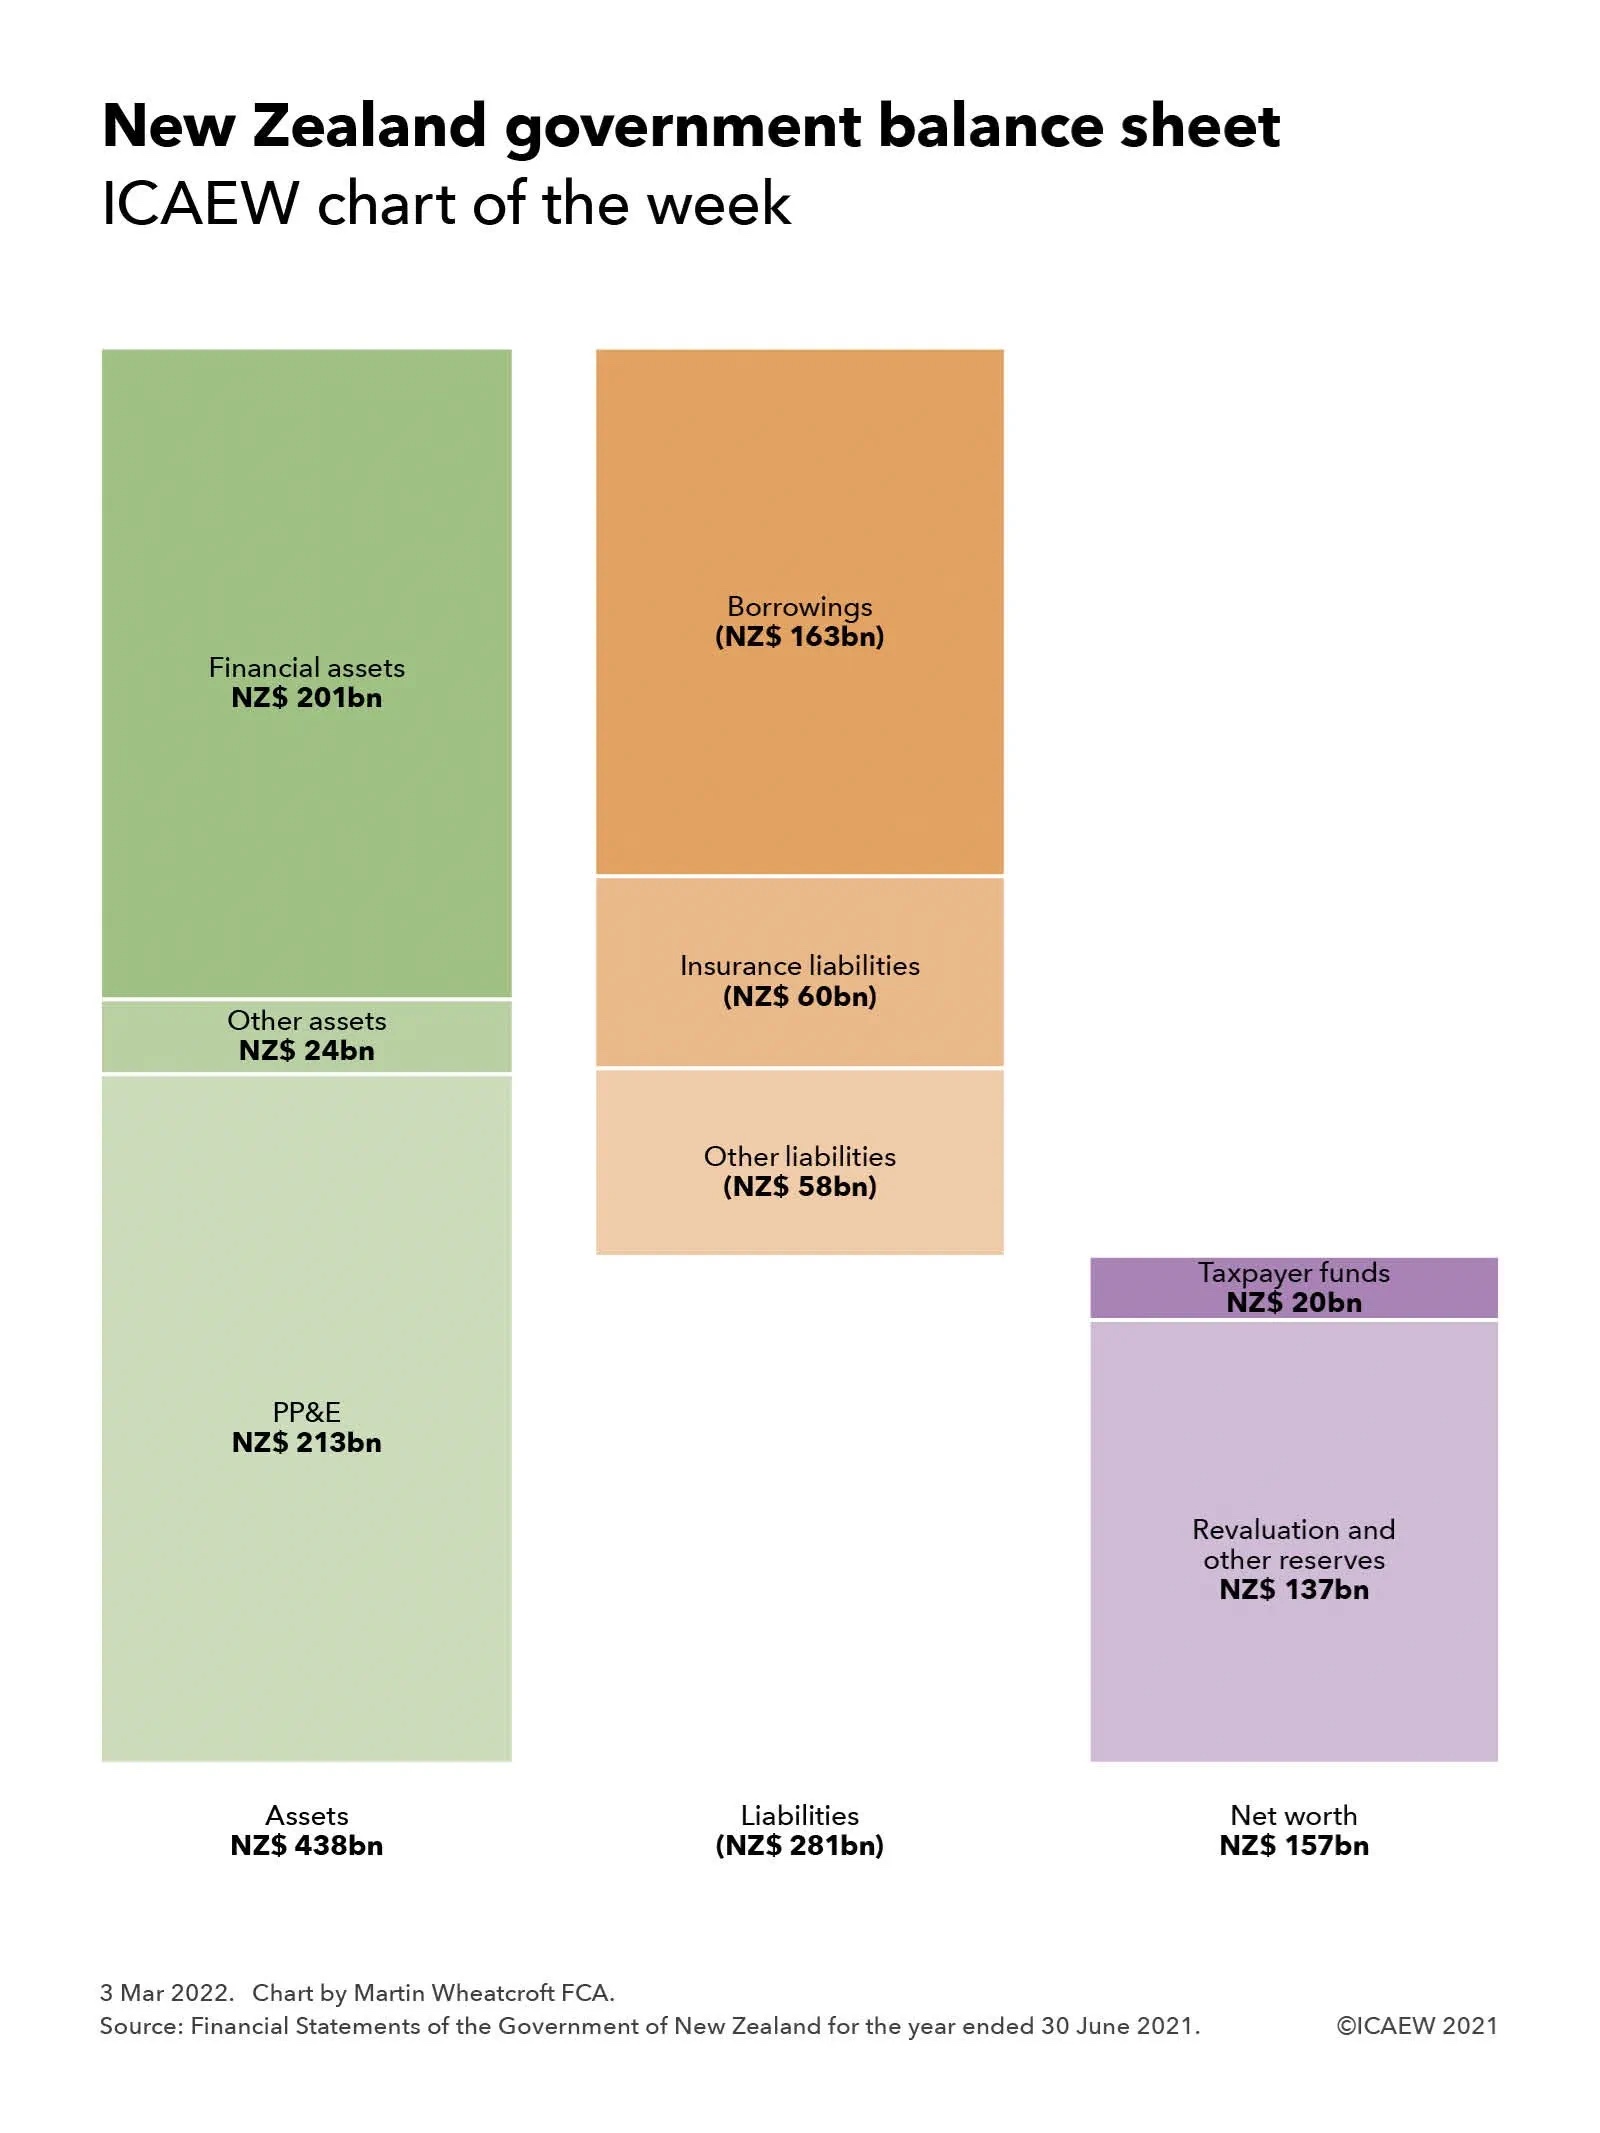
Our chart this week summarises the total crown balance sheet reported in the Financial Statements of the Government of New Zealand for the year ended 30 June 2021, comprising assets of NZ$438bn (£223bn) less liabilities of NZ$281bn (£143bn) to give net worth of NZ$157bn (£80bn).

New Zealand is a leading country in adopting accruals accounting for use in government, with the financial statements prepared in accordance with New Zealand-adopted accruals-based International Public Sector Accounting Standards (IPSAS), which are aligned with IFRS with some adaptation for the public sector. The New Zealand government not only uses IPSAS for financial accounting and reporting, similar to how the UK’s Whole of Government Accounts is based on IFRS, but they also use these standards for budgeting, management accounting and fiscal target setting. This contrasts with the UK, which uses a distinct UK-specific ‘resource’ accounting framework for budgeting and management accounting, and the statistics-based National Accounts system for fiscal target setting.

The asset side of the balance sheet includes NZ$213bn (£109bn) of property, plant and equipment, other non-financial assets of NZ$24bn (£12bn) and financial assets of NZ$201bn (£102bn). The latter includes marketable securities, student loans, residential loans and other financial investments in addition to receivables and cash.

Liabilities include NZ$163bn (£82bn) of borrowings, insurance liabilities of NZ$ 60bn (£31bn) and other liabilities of NZ$58bn (£30bn). Insurance liabilities are relatively high compared with many other countries as a consequence of New Zealand’s unique national no-fault accident compensation scheme that covers everyone in the country, including visitors.

Net worth is made up of taxpayer funds of NZ$20bn (£10bn) and reserves of NZ$137bn (£70bn), with the latter comprising a property revaluation reserve of NZ$134bn (£68bn) and minority interests of NZ$6bn (£3bn) less negative reserves of NZ$3bn (£1bn) principally relating to defined benefit retirement plans and veterans disability entitlements.

With a population of 5.1m, net worth on a per capita basis at 30 June 2021 is equivalent to approximately NZ$31,000 (£16,000) per person, comprising NZ$86,000 (£44,000) in assets per person less NZ$55,000 (£28,000) in liabilities per person. This compares with the approximate negative net worth of £37,000 per person based on the UK Whole of Government Accounts at 31 March 2019, comprising £31,000 in assets per person less £68,000 in liabilities per person.

While some caution needs to be taken in comparing these amounts given differences in accounting policies and the exclusion of local government from the New Zealand numbers, they do provide an insight into how on a proportional basis the New Zealand public sector is much better capitalised than the UK public sector.

While there are significant differences between the economies of New Zealand and the UK that no doubt explain the respective strengths and weaknesses of their public balance sheets, the presence of accountants in New Zealand’s highest office, most recently Sir John Key (prime minister 2008-2016), may also have something to do with it.

This chart was originally published by ICAEW.

ICAEW chart of the week: CP Trans-Pacific Partnership

12 February 2021: The UK wrote to New Zealand at the start of this month formally requesting permission to apply for membership of the Comprehensive and Progressive Trans-Pacific Partnership. What is the CPTPP and what opportunities would joining provide to the UK?

The #icaewchartoftheweek is on the UK’s application to join the Comprehensive and Progressive Trans-Pacific Partnership (CPTPP), a group of eleven countries on the other side of the world. This trade organisation was established to improve trade links between countries surrounding the Pacific, reducing trade barriers between the countries involved and aligning regulations in areas such as intellectual property. 

It is sometimes described as the third largest free-trade area in the world, after the US-Mexico-Canada Free Trade Agreement (USMCA, formerly NAFTA) and the EU-EEA-Switzerland Common Market, but it is important to understand that it is much less integrated than a customs union (with shared tariffs), a common market (with fuller regulatory alignment) or an economic union (such as the highly integrated EU Single Market with unified standards and regulations). 

According to IMF forecasts for 2021, Japan is the largest economy in the CPTPP with GDP of £3,815bn, while Brunei is the smallest with GDP of £9bn. The other members are Canada (£1,335bn), Australia (£1,125bn), Mexico (£890bn), Malaysia (£280bn), Vietnam (£275bn), Singapore (£270bn), Chile (£220bn), New Zealand (£165bn) and Peru (£150bn). This compares with a forecast of £2,180bn for UK GDP in 2021.

Membership is not exclusive, with CPTPP members involved in a number of other multilateral free trade agreements. Canada and Mexico are also members of USMCA. Malaysia, Singapore, Vietnam and Brunei are members of the 10-nation Association of South East Asian Nations (ASEAN), which in turn has free trade agreements with Japan, Australia and New Zealand, China, India and South Korea. Mexico, Peru and Chile are members of the four-nation Pacific Alliance with Columbia. In addition, China is leading the formation of the Regional Comprehensive Economic Partnership which includes all of the non-Americas members of the CPTPP in addition to China, South Korea and the other members of ASEAN.

The CPTPP replaced the original proposal for a Trans-Pacific Partnership (TPP) that would have included the US, but the remaining nations decided that it was still worthwhile pursuing a revised trade arrangement even after the US withdrew its application four years ago. A new administration could see the USA change its mind and seek to join the CPTPP after all.

Why does the UK want to join a trade pact on the other side of the world? The immediate trade benefits are likely to be relatively modest given the distances involved and which are likely to be secured through bilateral trade agreements already under discussion.

One reason is likely to be geo-political, as membership would strengthen relationships with allies in the Pacific, advancing the UK Government’s ‘global Britain’ agenda. There may also be an advantage in being directly involved in the development of international trade policy in the Pacific region which contains the two largest individual economies in the world (the US and China), potentially influencing trade policy across the planet.

Of course, part of the motivation might be less about trade in the Pacific and more about trade across the Atlantic. After all, if the US were to join the CPTPP, the UK’s membership might provide a base from which to eventually develop a more comprehensive bilateral free trade agreement. This could fulfil a key strategic objective of improving trade ties with the USA by going around the world, albeit in a lot more than 80 days!

This chart was originally published by ICAEW.