ICAEW chart of the week: Global stock markets

Our chart looks at how the top 10 stocks from nine companies made up more than a fifth of global stock market values on 31 December 2025.
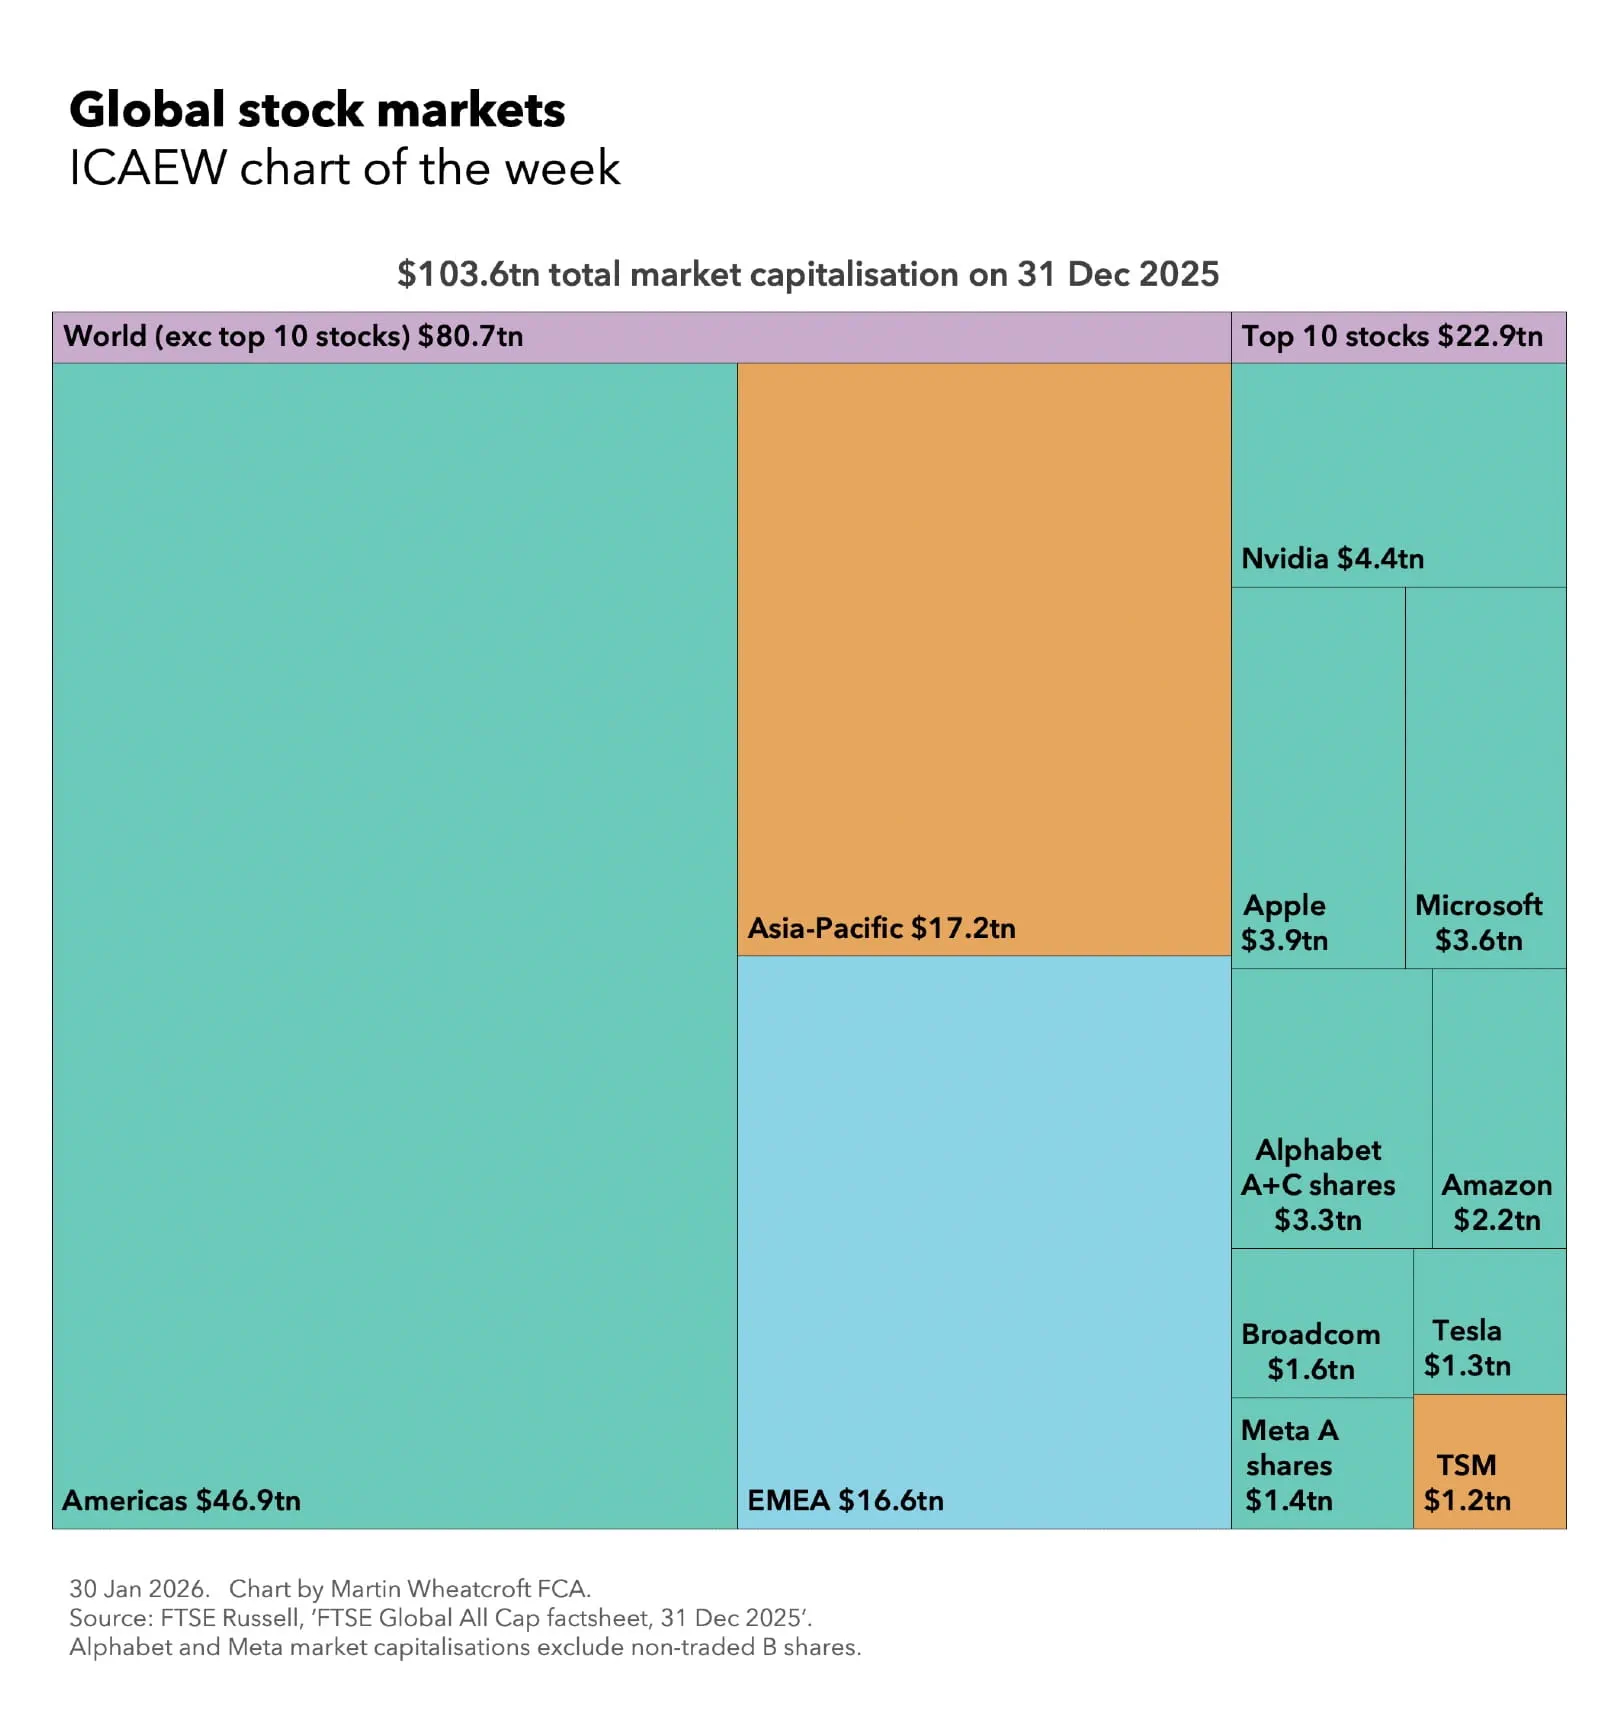
Our chart this week is on equity markets around the world, illustrating how the 10,077 shares in the FTSE Global All Cap Index had a total market capitalisation of $103.6tn on 31 December 2025.

This can be analysed as $80.7tn (78% of the total) excluding the top 10 stocks and $22.9tn (22%) for the top 10 stocks.

Excluding the top nine US stocks, the Americas had a total market capitalisation of $46.9tn (45%). In Asia Pacific, excluding the largest non US stock, the total was $17.2tn (17%). Europe, the Middle East and Africa (EMEA) accounted for $16.2tn (16%).

The top 10 stocks are led by Nvidia, valued at $4.4tn (4.2% of the total global stock market capitalisation on 31 December 2025), followed by Apple at just over $3.9tn (3.8%), Microsoft on $3.6tn (3.5%), Alphabet A and C shares combined $3.3tn (3.2%), Amazon on $2.2tn (2.1%), Broadcom on $1.6tn (1.5%), Meta A shares on $1.4tn (1.4%), and Tesla on $1.3tn (1.2%).

The tenth stock (and ninth company) is that of Taiwan Semiconductor Manufacturing (TSM), which had a market capitalisation of $1.2tn (1.2% of the global total) on 31 December 2025.

The market capitalisations for Alphabet and Meta shown exclude the values of their non-traded B shares, which means their total equity values were closer to $4.0tn and $1.7tn respectively on 31 December 2025. The FTSE Global All Cap Index also doesn’t include the $1.6tn estimated market value of Saudi Aramco as less than 2.5% of this stock is traded.

If the top 10 stocks are included with their respective regions, the chart would show the Americas with a market capitalisation of $68.9tn (66% of the total), Asia-Pacific with $18.4tn (18%) and EMEA unchanged at $16.2tn (16%).

Not shown in the chart is how market capitalisations are distributed within each global region. The Americas comprise the US with $43.0tn (41.0%) excluding the top nine US stocks, or $64.7tn (62.0%) if they are included, Canada with $3.2tn (3.1%) and Latin America countries with $0.8tn (0.7%).

The market capitalisation of Asia-Pacific country stocks is led by Japan $5.8tn (5.6%), followed by China including Hong Kong with $3.9tn (3.7%), India $2.1tn (2.0%), Australia and New Zealand $1.8tn (1.7%), Korea $1.6tn (1.5%), Taiwan excluding TMS is $1.2tn (1.2%) and ASEAN nations $0.9tn (0.9%). Taiwan including TMS is $2.4tn (2.3%).

In EMEA, EU member country stocks add up to $9.3tn (9.0% of the total), the UK $3.4tn (3.3%), EFTA countries $2.3tn (2.2%), Middle East $1.1tn (1.1%) and Africa $0.4tn (0.4%).

As everyone investing in stock markets should know, individual share values can go down as well as up, which is why diversifying your investments often makes good sense.

However, in the case of global stock markets – and the US in particular – the total value of listed equities around the world are highly dependent on the fortunes (or otherwise) of just nine companies.

Be careful out there.

This chart was originally published by ICAEW.

ICAEW chart of the month: Cabinet government

26 June 2020: The prime minister has announced a reduction in the number of government departments. How big is the cabinet compared to the rest of the world?

The news that the UK Government is reducing the number of government departments by one prompts the #icaewchartofthemonth to take a look at the size of government executives across the world.
 
As the chart highlights, with 26 members, the UK cabinet is one of the largest amongst major economies – comprising the prime minister Boris Johnson, 21 department ministers and four ‘ministers attending cabinet’. This does not include the Cabinet Secretary or other officials, meaning that cabinet meetings generally involve more than 30 people in total.
 
Compare that with the more compact 16-member German federal cabinet (Chancellor Angela Merkel and 15 departmental ministers) and the ten-member Chinese state council executive (comprising the premier Li Keqiang, five vice-premiers and four other senior departmental ministers).
 
It is certainly much larger than FTSE-100 company boards, where the average size is 11, and very few listed companies have more than 16 board members.
 
There is some debate around whether reducing the size of the UK cabinet would be more conducive to effective government. Some suggestions that the merger of the Department for International Development (DfID) with the Foreign & Commonwealth Office (FCO) to form the new Foreign, Commonwealth & Development Office (FCDO) in September is the first step on the way to that goal – with further mergers possible. However, although there will be one fewer departmental minister, there is a reasonable prospect of the minister responsible for development at the FCDO being invited to attend cabinet given its importance to the government’s global agenda.
 
Of course, merging departments is not the only way to achieve a slimmer cabinet – for example, the 31-member Russian cabinet (not shown in the chart) rarely meets as one body. Instead, there are regular meetings of the 10-strong prime ministerial group (the prime minister Mikhail Mishustin and nine deputy prime ministers) and occasional meetings of the 20-strong cabinet praesidium that includes the most senior ministers as well.
 
The UK Cabinet also works in this way to a certain extent, with critical decisions often being made in smaller groupings of senior ministers, such as the 9-member National Security Council, the 9-member Climate Change Committee or the 12-strong EU Exit Operations Committee for example. Canada, with its 37-member cabinet, also operates through a series of cabinet committees ranging from around 8 to 15 members. However, in both cases, the full cabinet still meets regularly and remains the formal executive body for authorising government actions.
 
With rumours of a cabinet reshuffle in the UK this autumn, it will be interesting to see whether moves to reduce the size of the cabinet will actually take place or whether we will see further development of cabinet committees as the places to be ‘in the room where it happens’.

This chart of the month was originally published by ICAEW.